Definition TQM Diagram
The Total Quality Management (TQM) diagrams visualize business and industrial processes. TQM diagram helps to show clearly step-by-step process and to compare the ideal and real process stages visually.

Pic.1 Business process TQM diagram.
This example shows a business process Total Quality Management diagram that can be then analyzed for ways to improve the process effectiveness and diagnose quality issues that require resolution.
See also Samples:
TEN RELATED HOW TO's:
A full-featured project management solution with all the necessary functions right at your fingertips. Generates an extensive variety of reports on project and task statuses.
These videos provide a series of lessons that will enhance the understanding of all our users, from people just starting out with the software, through to expert users.
Picture: Project — Working With Tasks
ConceptDraw DIAGRAM diagramming and vector drawing software extended with Total Quality Management (TQM) Diagrams solution from the Quality area of ConceptDraw Solution Park perfectly suits for development and visually representing a Quality Management System.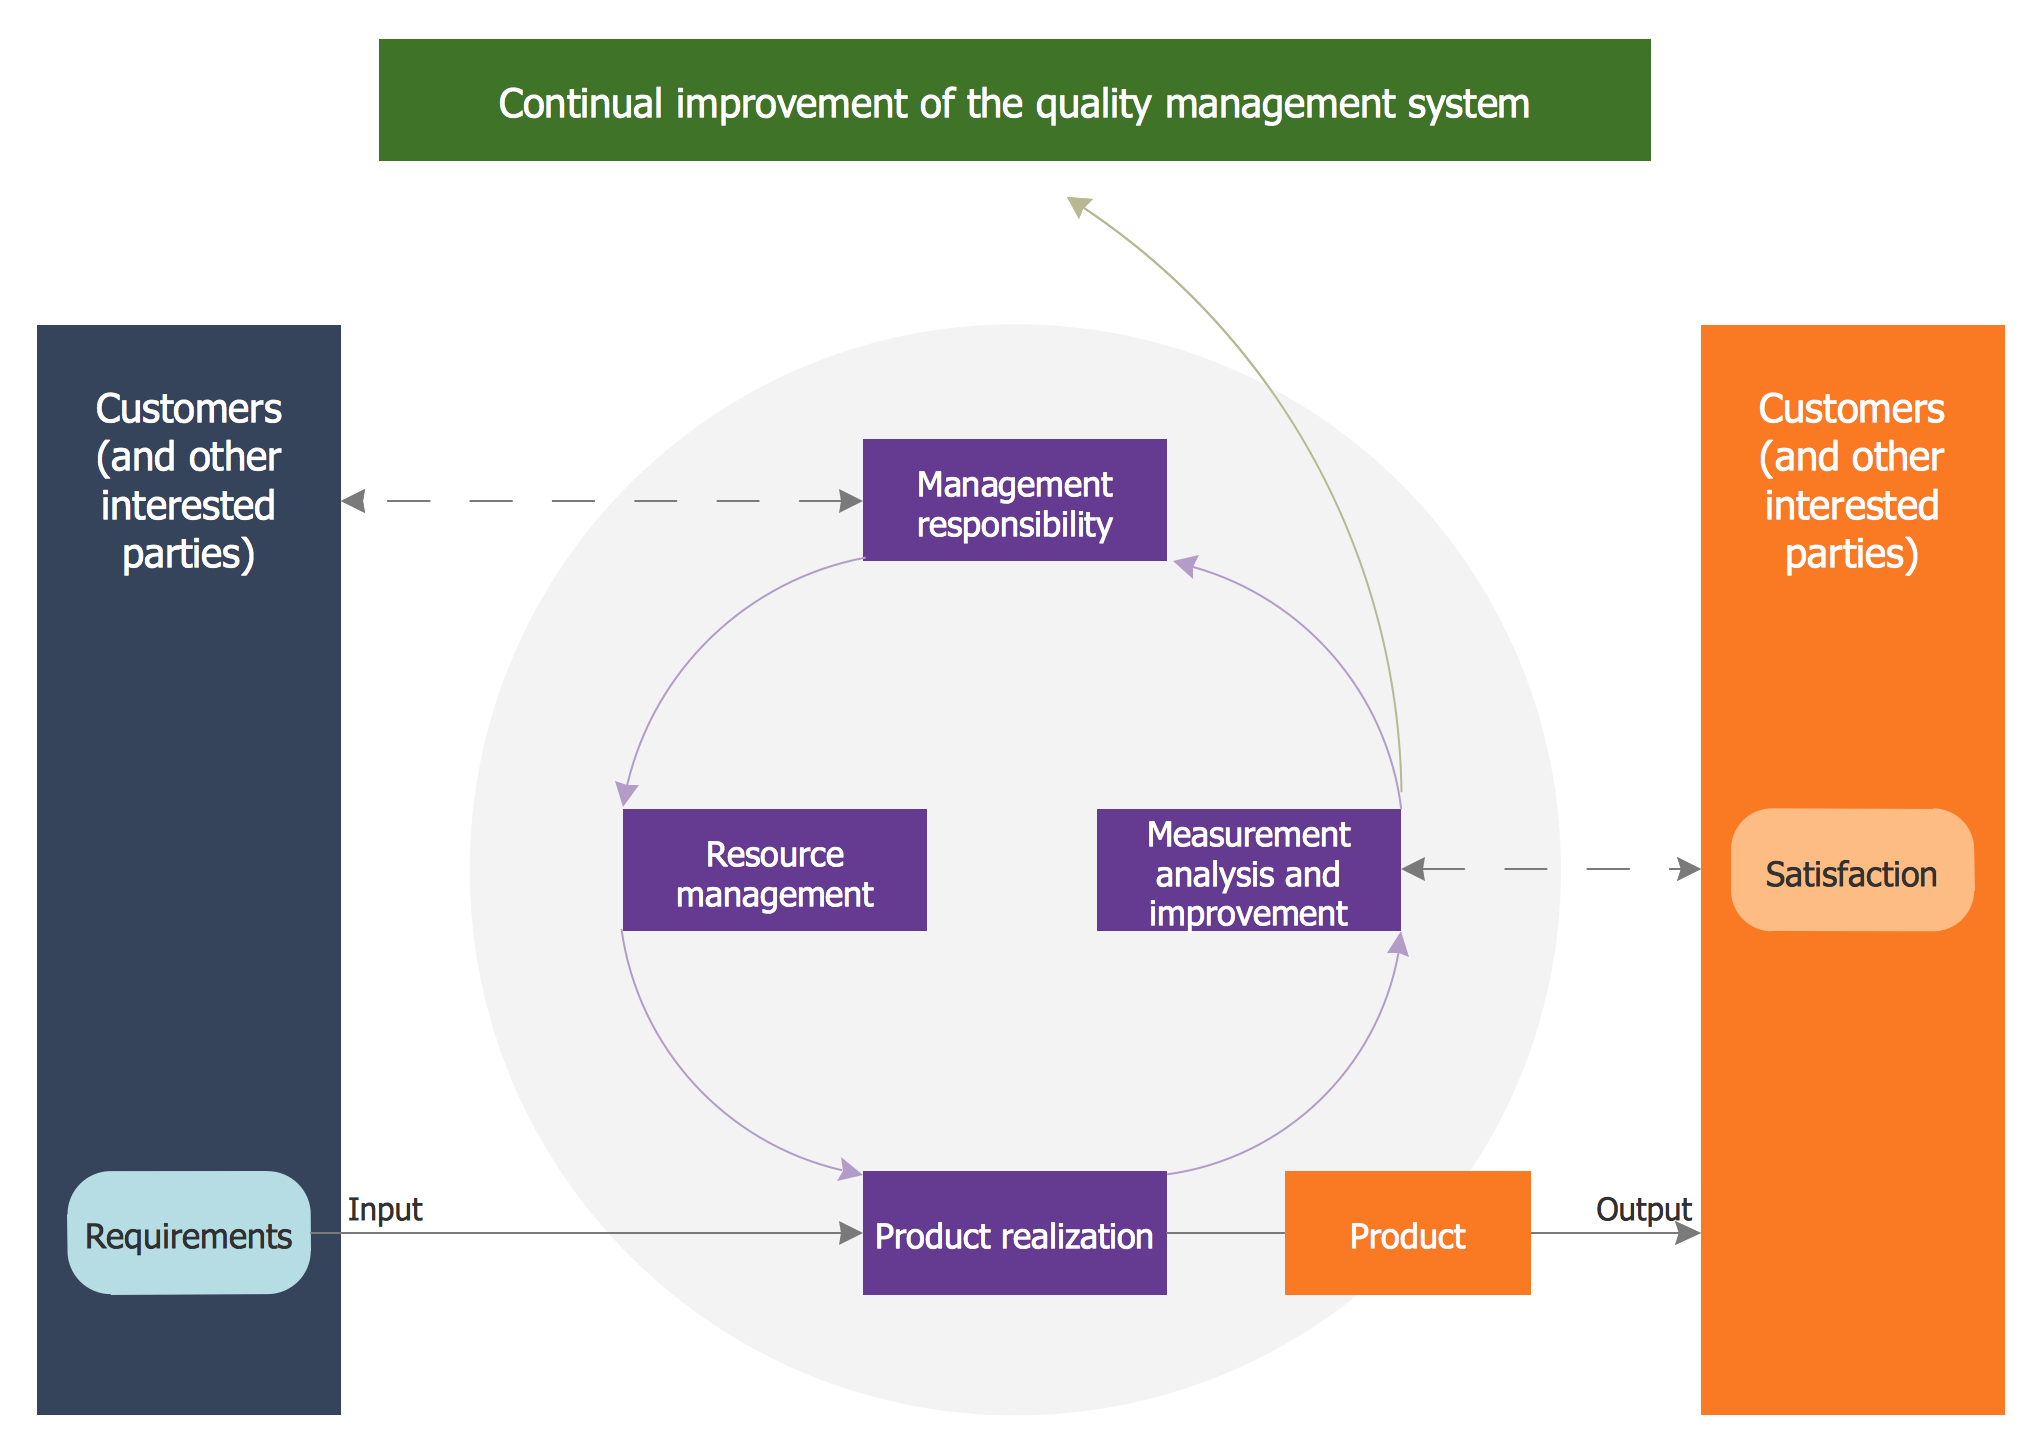
Picture: Quality Management System
Related Solution:
Value stream maps (VSM) are an essential tool for organizations applying Lean methods.
Picture: What is Value Stream Mapping?
Related Solution:
UML Composite Structure Diagram shows the internal structure of a class and the possible interactions at this structure.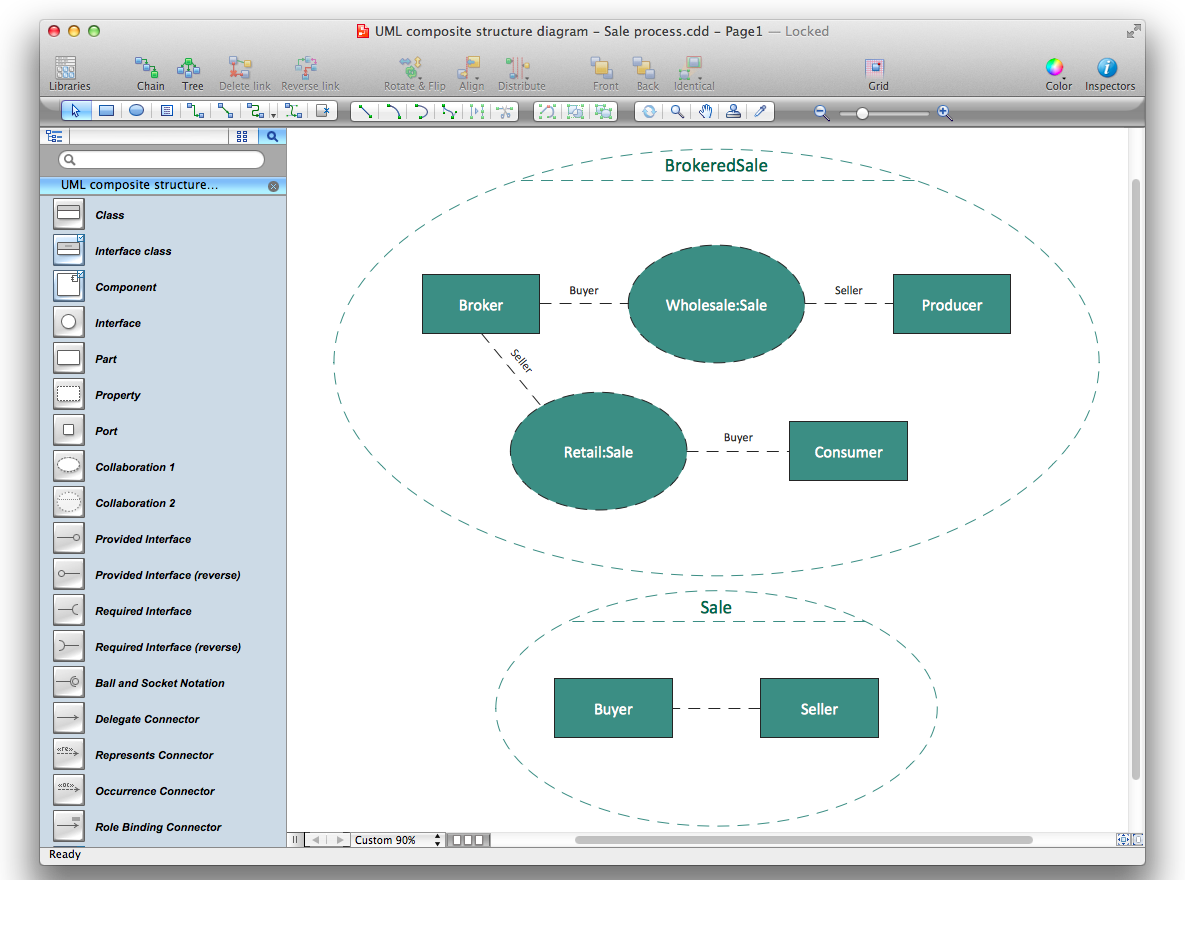
Picture: Diagramming Software for UML Composite Structure Diagrams
You need create a Sales Process Map? Use the ConceptDraw DIAGRAM software which is ideal for the sales process management, marketing and engineering thanks to the powerful Sales Flowcharts solution from the Marketing area of ConceptDraw Solution Park.
Picture: Sales Process Map
Related Solution:
Cause and Effect Diagrams are designed to identify the potential factors that cause an overall effect. The causes are grouped into the categories, each cause is a source of variation.
ConceptDraw DIAGRAM powerful diagramming and vector drawing software provides the Fishbone Diagrams solution from the Management area of ConceptDraw Solution Park that allows to design the Cause and Effect Diagrams quick, easy and effective.
Picture: Cause and Effect Diagrams
Related Solution:
ConceptDraw DIAGRAM diagramming and vector drawing software enhanced with Network Security Diagrams Solution from the Computer and Networks Area of ConceptDraw Solution Park is the best for effective design professional, colorful and attractive Network Security Diagram of any complexity and degree of detailing.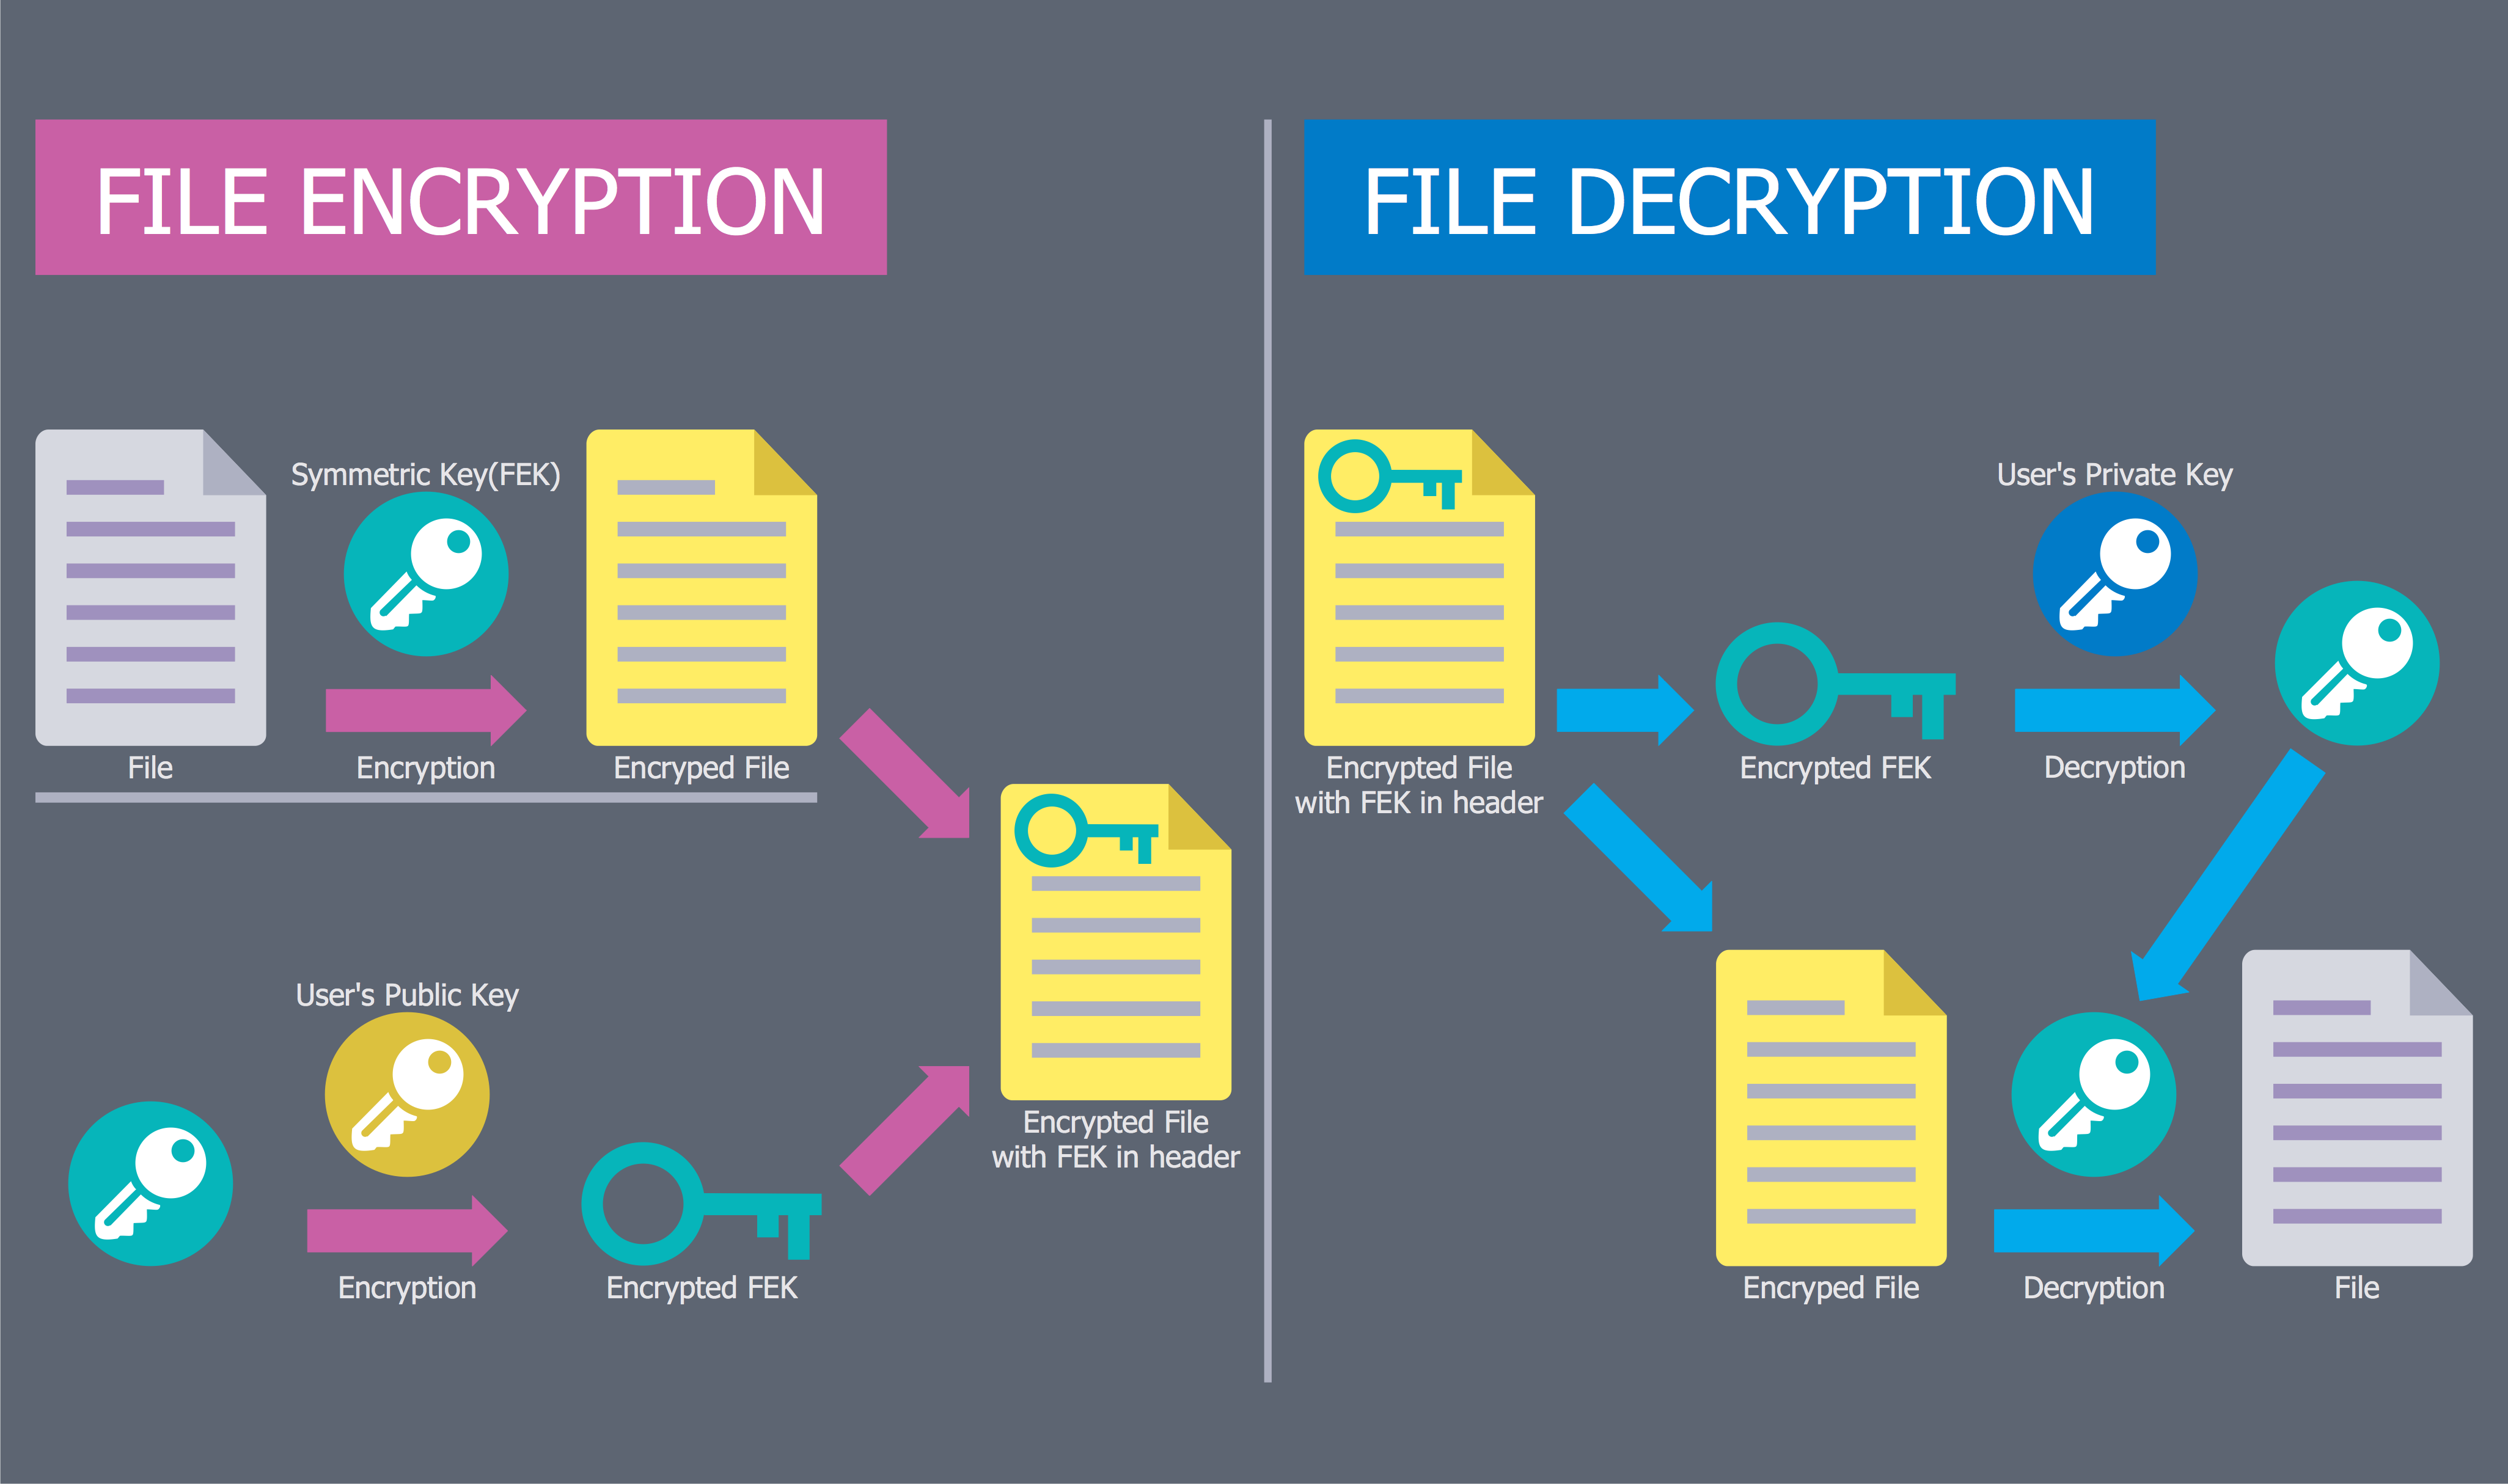
Picture: Network Security Diagram
Related Solution:
SIPOC is a tool that summarizes the inputs and outputs of one or more processes in table form.
You need to draw professional looking SIPOC Diagram quick and easy? Pay please your attention on ConceptDraw DIAGRAM diagramming and vector drawing software. Extended with Business Process Mapping Solution from the Business Processes Area of ConceptDraw Solution Park, it suits ideal for this.
Picture: SIPOC Diagram
Related Solution:
Structured-systems analysis and design method uses data flow diagrams to represent the process of data flowing through a system. Talking about this might be useless without a proper example of DFD for online store (Data Flow Diagram). This DFD example shows all the distinctness that a diagram can bring into a scattered data structure.
Data flow diagrams are used to show how data is processed within some business processes. Making DFD is a common practice for business process modeling and analysis. This diagram represents the online store business flow. It describes inputs and outputs within online selling process and depicts the interactions between its participants. This DF diagram can be used by system analysts to create an overview of a business, to study and discover its inherent strengths and weak points.
Picture: Example of DFD for Online Store (Data Flow Diagram)
Related Solution:
Every engineering project starts from a terms of reference document. The next stage of developing is a technical drawing, which requires using appropriate software. However, revisions and discussions about requirements are possible at any stage of development.
This technical drawing demonstrates a schematic flow diagram of pulp reclaiming. This diagram of magnetite pulp reclaiming is created using ConceptDraw Chemical and Process engineering solution, The solution delivers more than 460 vector graphic icons and connectors. Generally, it is intended for designing process and instrumentation diagrams (P&ID) for chemical and process engineering. block flow diagrams (BFD), process flow diagrams (PFD) for chemical industry.
Picture: Technical Drawing Software
Related Solution:
ConceptDraw
DIAGRAM 18