Made with
ConceptDraw
DIAGRAM 18

Structured Systems Analysis and Design Method. SSADM with ConceptDraw DIAGRAM

Structured Systems Analysis and Design Method (SSADM) is the method which is used at projecting and analysis of information systems. This method was developed for government of Great Britain in the beginning of 80th of the past century. It was accepted as the national standard of Great Britain for information systems development in 1993. Thus SSADM usage is expedient for those who work with governmental organizations as this method is a standard for these organizations.

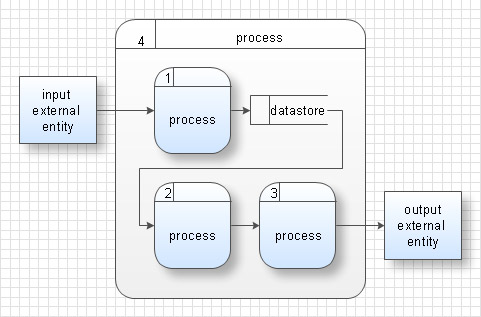
SSADM is based on the data flow diagrams. At the early stages of projecting at description of models (functional, informational and event-trigger) the top-down method is used.

At the description of data flows out of the system and into the system DFD, which denote boundaries of the system, are used.

At the description of data models LDS (Logical Data Structure) diagrams are used. LDS describes which data the system operates with. It is created for existing system and is added at the development of the new one.

For modelling events, happened in the system, ELN (Entity Life History) diagrams are used. These diagrams support states indications and the possibility of description not only consecutive but parallel or reiterative events and also description of the choice of events course. ELN describes how data change in the system in the course of time at different variants of events.

Thus, the most important SSADM elements are flows modelling with the help of DFD, data logic modelling with the help of LDS and description of entities behavior.

Analysis, projecting and documenting of information system accordingly to SSADM involves 6 main stages. Each stage is divided into several steps, which define tasks that should be fulfilled at the given stage. The system is studied for getting system requirements. Detailed project is created on the logic level and then transformed into physical project.

SSADM stages:

  • Analysis of the existing system or estimation of practicability. It involves the analysis of the existing system and creation of DFD for visualization of known problems and system description. If the system is developed from the beginning than the projecting starts from definition of new system requirements.
  • Requirements definition. On the basis of available data about the system new functions, which the system must execute are defined. Also boundaries of the future system and data which will be processed by the system are defined. Infological model of requirements is constructed.
  • Definition of technical requirements and device equipment cost. Definition of the expected profit with the introduction of new functions.
  • Development of logical data model. Specification of the list of functional requirements. After development of the logical project the adding of new requirements on SSADM is forbidden. Only correction of the existing requirements, their specification and concrete definition are allowed.
  • Projecting of logical requirements. Specification of requirements.
  • Physical projecting. Physical information model and specification to program elements are developed and optimized. Specifications to program elements are specified and documentation is drawn up.

The advantages of SSADM are the precise definition and support of so-called “non functional requirements”. Such requirements define the level of the quality with which the system must execute its functions. For example, access limitations, the mean time of lifelength to denial, time of the response, safety requirements, etc.

In comparison with other methods of information system projecting, particularly with E. Yordon and A. Young methods, SSADM is characterized with presence of clear consecution of steps at projecting.

Structured Systems Analysis and Design Method solution

Structured Systems Analysis and Design Method

Pic.1. Structured Systems Analysis and Design Method solution

The following features make ConceptDraw DIAGRAM the best Data Flow Diagram software:

  1. You don't need to be an artist to draw professional looking diagrams in a few minutes.
  2. Large quantity of ready-to-use vector objects makes your drawing diagrams quick and easy.
  3. Great number of predesigned templates and samples give you the good start for your own diagrams.
  4. ConceptDraw DIAGRAM provides you the possibility to use the grid, rules and guides. You can easily rotate, group, align, arrange the objects, use different fonts and colors to make your diagram exceptionally looking.
  5. All ConceptDraw DIAGRAM documents are vector graphic files and are available for reviewing, modifying, and converting to a variety of formats: image, HTML, PDF file, MS PowerPoint Presentation, Adobe Flash, MS Visio.
  6. Using ConceptDraw STORE you can navigate through ConceptDraw Solution Park, managing downloads and updates. You can access libraries, templates and samples directly from the ConceptDraw STORE.
  7. If you have any questions, our free of charge support is always ready to come to your aid.


TEN RELATED HOW TO's:
This sample was created in ConceptDraw DIAGRAM diagramming and vector drawing software using the Flowcharts solution from the Diagrams area of ConceptDraw Solution Park. This sample shows the Flowchart of the Subprime Mortgage Crisis. This Flowchart describes the decline in housing prices when the housing bubble burst and what it caused on the housing and financial markets. You can also see the Government and Industry responses in this crisis situation.Flowchart on Bank. <br>Flowchart Examples *
Picture: Flowchart on Bank. Flowchart Examples
Related Solution:
This sample shows the Polar Graph. The Polar Graph is a graph in the polar coordinate system in which the each point on the plane is defined by two values - the polar angle and the polar radius. The certain equations have very complex graphs in the Cartesian coordinates, but the application of the polar coordinate system allows usually produce the simple Polar Graphs for these equations.Polar Graph *
Picture: Polar Graph
The Workflow diagrams are the specialized type of flowcharts which allow to visualize any sorts of step-by-step processes. They are usually created as flowcharts, with objects that represent in a simple visual manner the steps in the process connected by arrows that indicate the next step. The ability easily create Workflow diagrams visually describing the tasks, documents associated with the tasks, people which are responsible for execution at each stage of workflow is made possible with Workflow Diagrams solution. This solution extends ConceptDraw DIAGRAM with a Workflow Diagram library that contains large collection of predesigned workflow flowchart symbols.Workflow Flowchart Symbols *
Picture: Workflow Flowchart Symbols
Related Solution:
Activity diagram describes the business and operational step-by-step workflows of components in a system. An activity diagram shows the overall flow of control.Diagramming Software for Design UML Activity Diagrams *
Picture: Diagramming Software for Design UML Activity Diagrams
For depicting the onion model are actively used Stakeholder Onion Diagrams. The ConceptDraw DIAGRAM diagramming and vector drawing software extended with Stakeholder Onion Diagrams Solution from the Management Area of ConceptDraw Solution Park offers the number of useful tools and Stakeholder Onion Diagram template for their easy design.Stakeholder Onion Diagram Template *
Picture: Stakeholder Onion Diagram Template
Related Solution:
ConceptDraw DIAGRAM diagramming and vector drawing software enhanced with powerful HR Flowcharts Solution perfectly suits for Human Resource Management.Human Resource Management
Picture: Human Resource Management
Related Solution:
Any product planning matrix can be also named as the house of quality. Being a matrix that can organize all the needed customer requirements as well as the product design ones into some particular structure and analyze the interactions between such requirements, a product planning matrix can be created with the help of ConceptDraw DIAGRAM diagramming and drawing software with the help of the House of Quality solution that is the one which contains all the needed tools, such as the design elements and the pre-made templates to complete the drawing within a short period of time.Product Planning *
Picture: Product Planning
Related Solution:
Sales process management is a business discipline which focuses on the development and practical application of various sales techniques, and on the management of sales operations of the company.

It is effective to use professional software for the sales process management. ConceptDraw DIAGRAM diagramming and vector drawing software extended with Sales Flowcharts solution from the Marketing area of ConceptDraw Solution Park is the best choice.Sales Process Management *

Picture: Sales Process Management
Related Solution:
This sample represents the actors, use cases and dependencies between them, and also the relationships between use cases. There are used dependency and use case generalization associations on this UML diagram. Use case generalization is used when you have two similar use cases, but one of them does more than another. This sample shows the work of the Financial Trade sphere and can be used by trading companies, commercial organizations, traders, different exchanges.Financial Trade <br>UML Use Case Diagram Example *
Picture: Financial Trade UML Use Case Diagram Example
When searching for a diagramming tool, we look for a powerful and reliable software that would be easy to use. To mention one, ConceptDraw DIAGRAM has all the necessary features to create cross-functional flowcharts (Swim Lanes) quick and effortlessly. You can draw swim lane diagrams in both vertical and horizontal ways. This cross-functional flowchart displays a payroll process. It explains to each participant his role in the process depending on the category, represented with swimlanes. Using this flowchart, every employee can easily find out what he can expect in terms of salary. Generally a cross-functional diagram enables one to take a look at processes with a wider scope and with more precision than simple flowchart. Business process capturing using cross-functional flowcharts can be useful for stakeholders and managers to define clearly the staff's roles and responsibilities.Cross-Functional Flowchart (Swim Lanes) *
Picture: Cross-Functional Flowchart (Swim Lanes)
Related Solution:
ConceptDraw
DIAGRAM 18