Made with
ConceptDraw
DIAGRAM 18

Network Security Model

The network security involves all tools, devices, strategies and activities which enterprises and organizations undertake to protect their networks, data and operations. An effective network security strategy must include the most effective set of tools for identification and reflection various threats and attacks. Creation of well thought-out network security model will effectively help you in realization your network's security. The network security model (NSM) is a scheme that reflects the general plan and the policy of ensuring the network security, and usually includes all or some of the following seven layers in different modifications according to the specific company's needs:

  • Physical layer — involves organization of physical security against the access to the data on computer devices, this can be access control devices, cameras, alarm.
  • VLAN layer — involves creation of Virtual Local Area Networks (VLANs) which join together common hosts for security purposes.
  • ACL layer — supposes creation and maintenance of Access Control Lists (ACLs) which allow or deny the access between hosts on different networks.
  • Software layer — helps to protect the user layer and ensures the software's actuality.
  • User layer — involves the user’s training of security on the network.
  • Administrative layer — supposes the training of administrative users.
  • IT department layer — this layer is the most important for network security, it contains all network security professionals and support specialists, network technicians and architects, which organize and maintain the work of the network and hosts.

Pay please your attention for the powerful ConceptDraw DIAGRAM diagramming and vector drawing software extended with Network Security Diagrams Solution from the Computer and Networks Area of ConceptDraw Solution Park which lets fast and easy design all variety of network security models: Open network security model, Closed network security model, Restrictive network access model.

Network Security Model

Example 1. Network Security Model

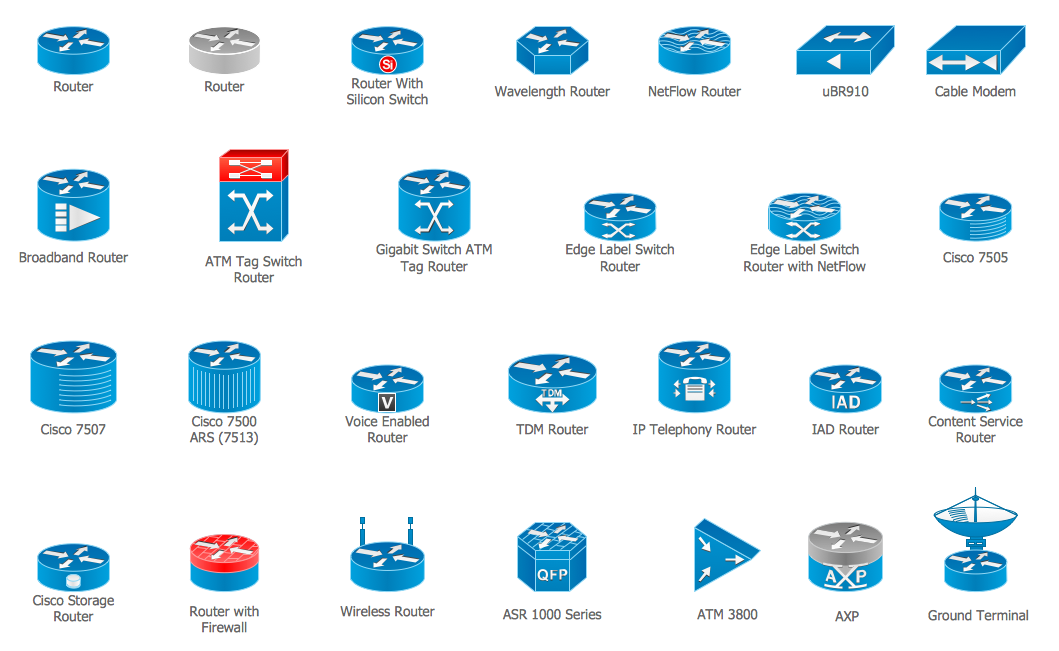
To design the Network Security Model, we recommend to use already ready-to-use 460 predesigned colorful vector objects offered by 4 libraries of the Network Security Diagrams Solution:

  • Cybersecurity Clipart
  • Cybersecurity Shapes
  • Cybersecurity Connectors
  • Cybersecurity Round Icons

Simply drag desired objects from the libraries to your document, arrange them, depict relationships between devices with help of connectors from the Cybersecurity Connectors library, type the text and make your diagram more attractive with help of bright colors applied for objects, connectors and background.

Network Security Diagrams Solution in ConceptDraw STORE

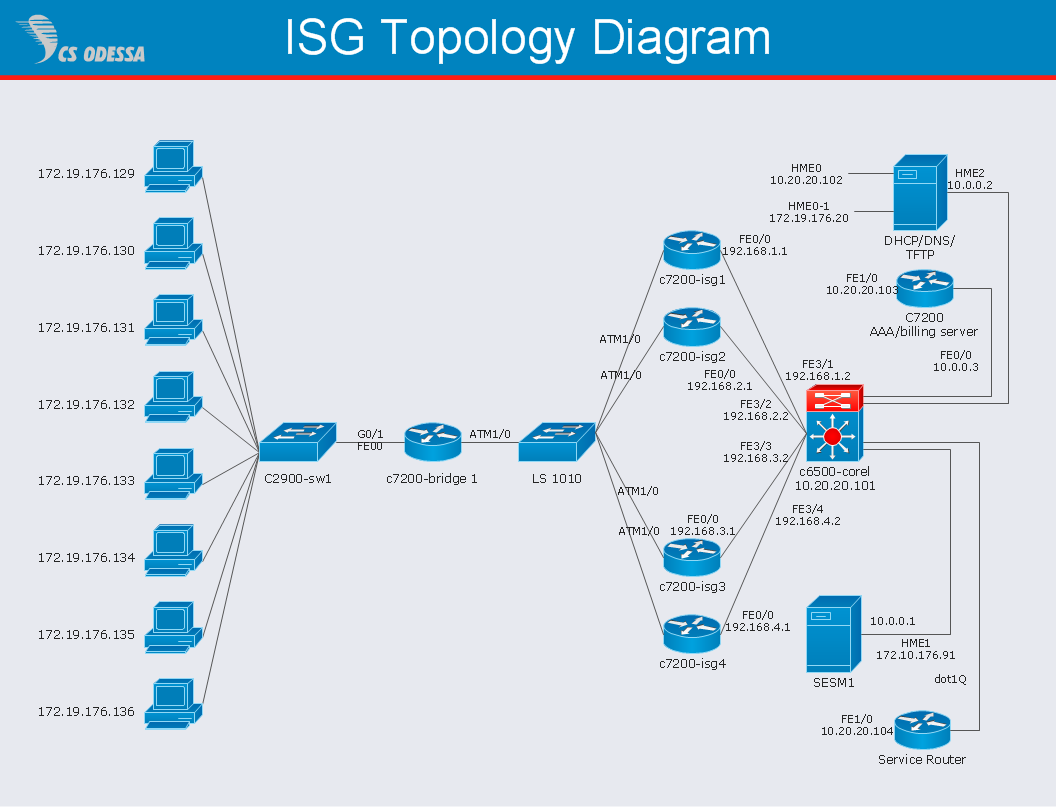
Example 2. Network Security Diagrams Solution in ConceptDraw STORE

One more useful way for inspiration and excellent start for drawing Network Security Diagrams and Network Security Model is collection of predesigned network security samples and examples offered by Network Security Diagrams Solution in ConceptDraw STORE.

Network Security Diagram - Access Control and Encryption

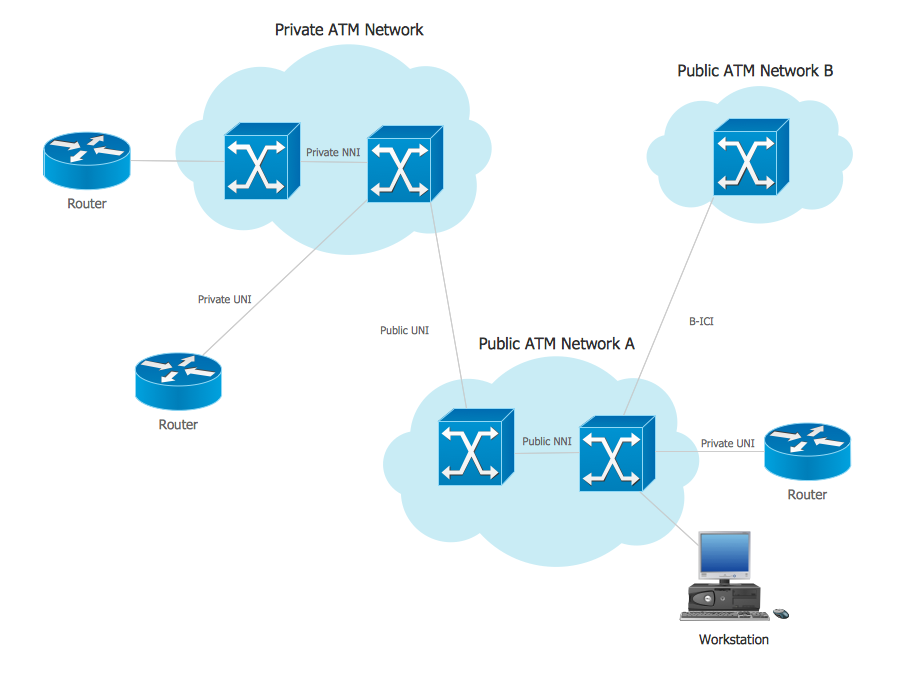
Example 3. Network Security Diagram — Access Control and Encryption

The samples you see on this page were created in ConceptDraw DIAGRAM using the tools of Network Security Diagrams Solution for ConceptDraw DIAGRAM software. An experienced user spent 10 minutes creating each of these samples.

Use the Network Security Diagrams Solution for ConceptDraw DIAGRAM to create your own Network Security Model and Network Security Diagrams quick, easy and effective.

All source documents are vector graphic documents. They are available for reviewing, modifying, or converting to a variety of formats (PDF file, MS PowerPoint, MS Visio, and many other graphic formats) from the ConceptDraw STORE. The Network Security Diagrams Solution is available for all ConceptDraw DIAGRAM users.

TEN RELATED HOW TO's:
Chemical and Process Engineering solution contains variety predesigned process flow diagram elements relating to instrumentation, containers, piping and distribution necessary for chemical engineering, and can be used to map out chemical processes or easy creating various Chemical and Process Flow Diagrams in ConceptDraw DIAGRAM.Process Flow Diagram Symbols
Picture: Process Flow Diagram Symbols
Related Solution:
Garrett IA diagrams are used at development of Internet-resources, in particulars at projecting of interactions of web-resource elements. The diagram of information architecture of the web resource which is constructed correctly with necessary details presents to developers the resource in comprehensible and visual way.Garrett IA Diagrams with ConceptDraw DIAGRAM  *
Picture: Garrett IA Diagrams with ConceptDraw DIAGRAM
A database is a data collection, structured into some conceptual model. Two most common approaches of developing data models are UML diagrams and ER-model diagrams. There are several notations of entity-relationship diagram symbols and their meaning is slightly different. Crow’s Foot notation is quite descriptive and easy to understand, meanwhile, the Chen notation is great for conceptual modeling. An entity relationship diagrams look very simple to a flowcharts. The main difference is the symbols provided by specific ERD notations. There are several models applied in entity-relationship diagrams: conceptual, logical and physical. Creating an entity relationship diagram requires using a specific notation. There are five main components of common ERD notations: Entities, Actions, Attributes, Cardinality and Connections. The two of notations most widely used for creating ERD are Chen notation and Crow foot notation. By the way, the Crow foot notation originates from the Chen notation - it is an adapted version of the Chen notation.ERD Symbols and Meanings
Picture: ERD Symbols and Meanings
Related Solution:
Any hierarchical structure of any company can be represented as a triangle or a pyramid. You can create a pyramid diagram and pyramid chart of any complexity using special libraries included in ConceptDraw DIAGRAM. Actually, any knowledge or chain of facts can also be depicted as a pyramid. A wide range of graph and chart are utilized in marketing to maintain documentation and various visual issues, that deal with marketing information and data. The marketing value pyramid can be created to illustrate how the value of company, or product is based on its competitiveness. To design this diagram we used ConceptDraw DIAGRAM drawing tools in conjunction with Pyramid solution for Solution Park.Pyramid Diagram and Pyramid Chart *
Picture: Pyramid Diagram and Pyramid Chart
Related Solutions:
ConceptDraw Wireless Networks solution contains a library with 81 vector stencils for drawing different types of wireless network diagrams.Wireless Network Elements *
Picture: Wireless Network Elements
Related Solution:
ConceptDraw DIAGRAM diagramming and vector drawing software as a sequence diagram tool provides the Rapid UML Solution from the Software Development Area that contains the UML Sequence library.Sequence Diagram Tool *
Picture: Sequence Diagram Tool
Related Solution:
ConceptDraw DIAGRAM software is the best Mac software for drawing workflow diagrams. Its rich set of samples and templates, and specific features to draw diagrams faster make this software as comfortable as possible for drawing workflow diagrams. Use the ConceptDraw DIAGRAM professional Mac OS X software for drawing workflow diagram. The Workflow Diagrams solution with its libraries and templates set make the possibility to identify resources that are required for work goal implementation. The process flow diagram identify flow which occurs as network of process dependencies, organizational decisions and interactions between departments. Usually workflow diagrams show business participants actions that carry product or service to the final destination, the consumer.Workflow Diagram Software Mac *
Picture: Workflow Diagram Software Mac
Related Solution:
There are several basic topologies including bus, star, point-to-point, ring and a hybrid. Two computers can form a fully connected network topology, and as the number of network nodes increases, the network diagram gets more complicated. This type of topology is also called a full mesh. This is a visual example of a computer network built using a mesh topology. This diagram presents the schematic structure of the full mesh network topology. A common mesh network topology means that each network device is connected with several points in the network, so if the one node of the network goes down, it does not cause an issue with an operability of the entire computer network. In a full mesh network topology, every computer or device in the network is interconnected with each of the other devices in the network.Fully Connected Network Topology Diagram *
Picture: Fully Connected Network Topology Diagram
Related Solution:
The ConceptDraw Flowchart component includes a set of samples and templates. This geathered as flowchart maker toolbox which focused on drawing flowcharts of any industry standards.Flowchart Components
Picture: Flowchart Components
Related Solution:
Large crowds need a lot of planning for; keep areas and events organized by creating a seating plan. Be the first to know when it is standing room only!Interior Design. Seating Plan — Design Elements *
Picture: Interior Design. Seating Plan — Design Elements
Related Solution:
ConceptDraw
DIAGRAM 18