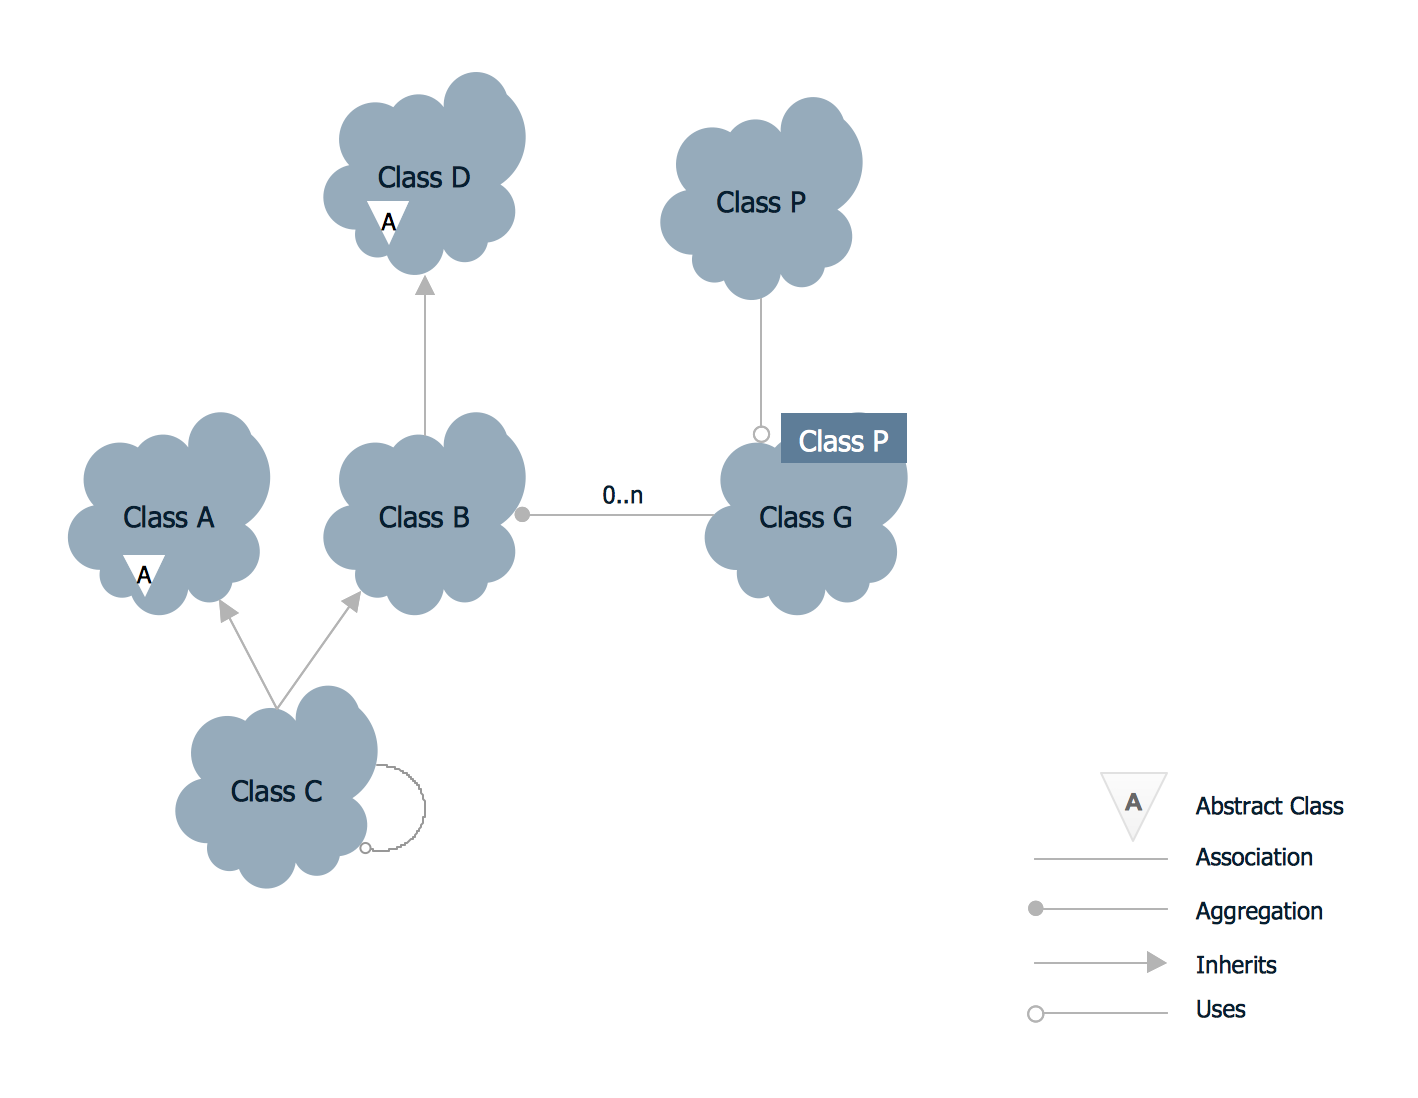
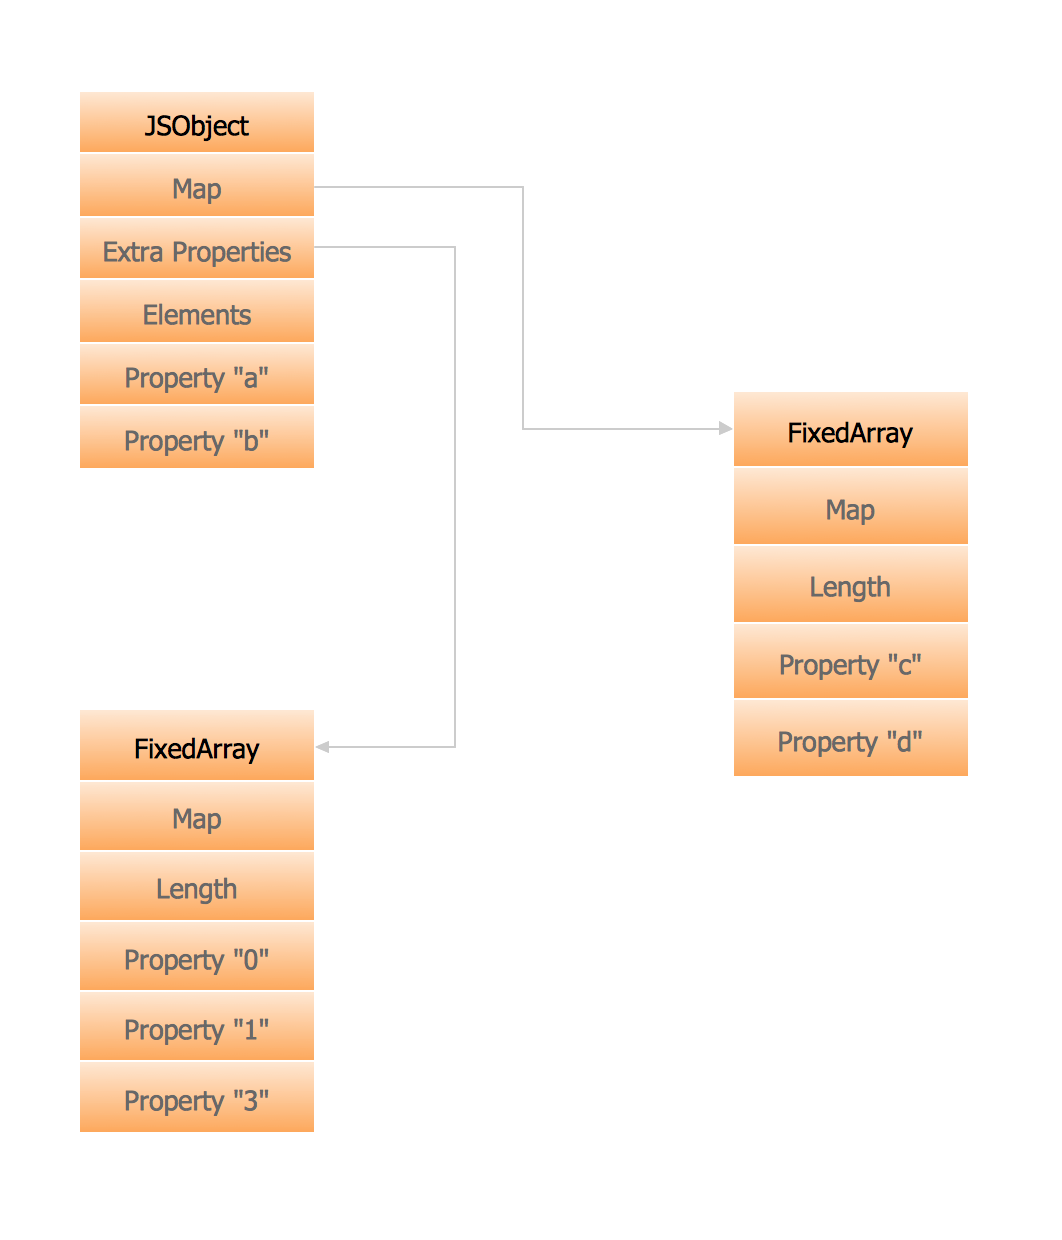
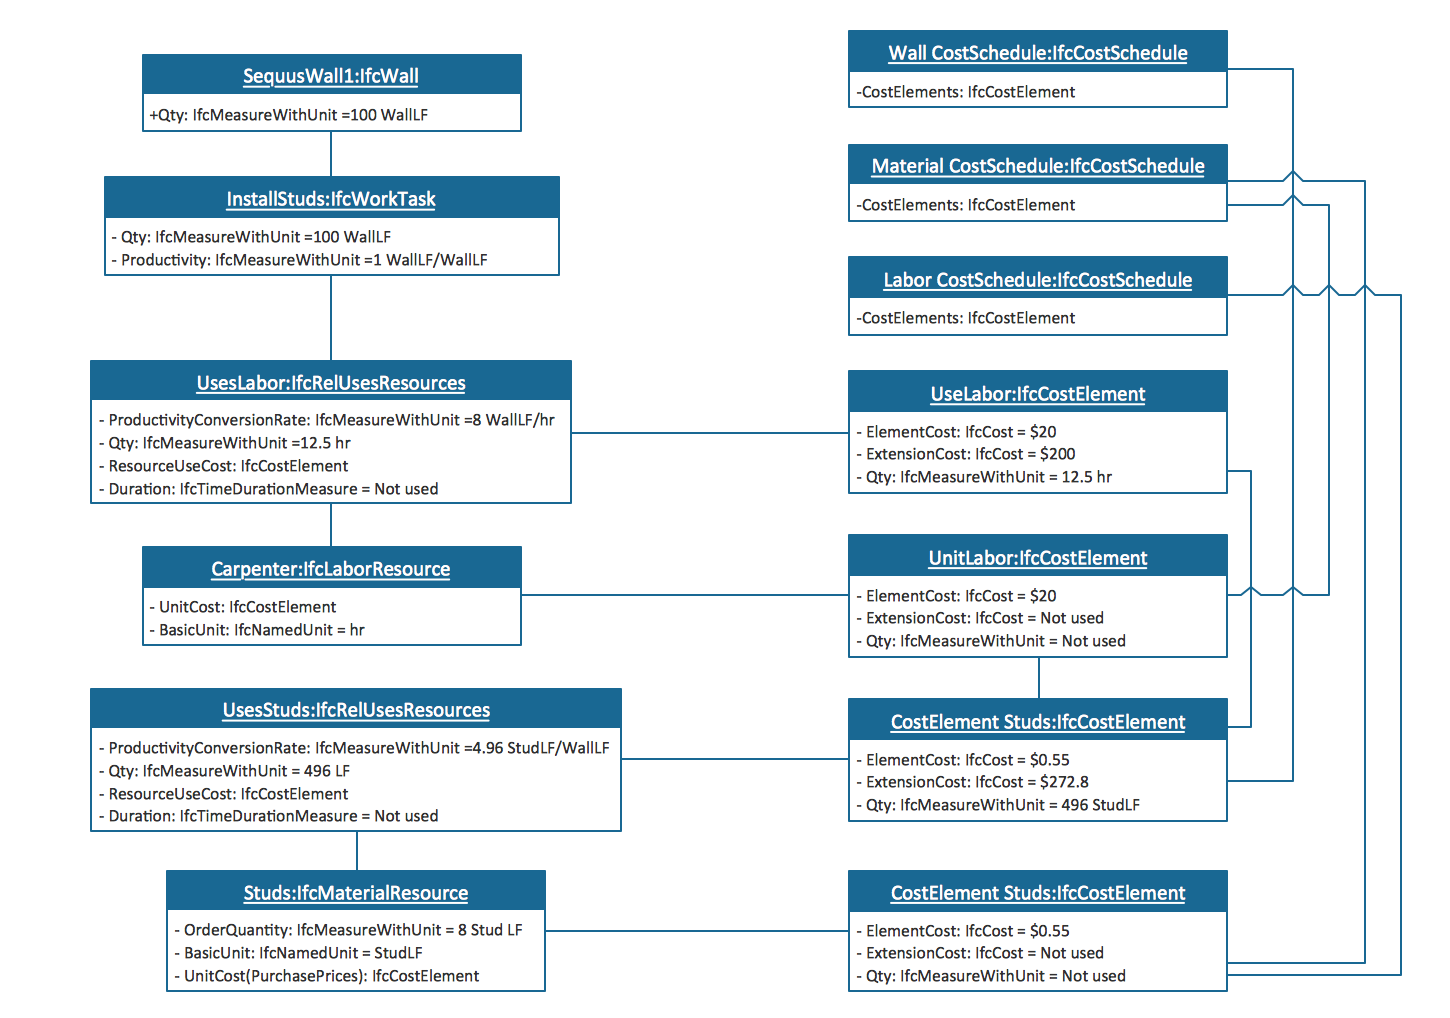
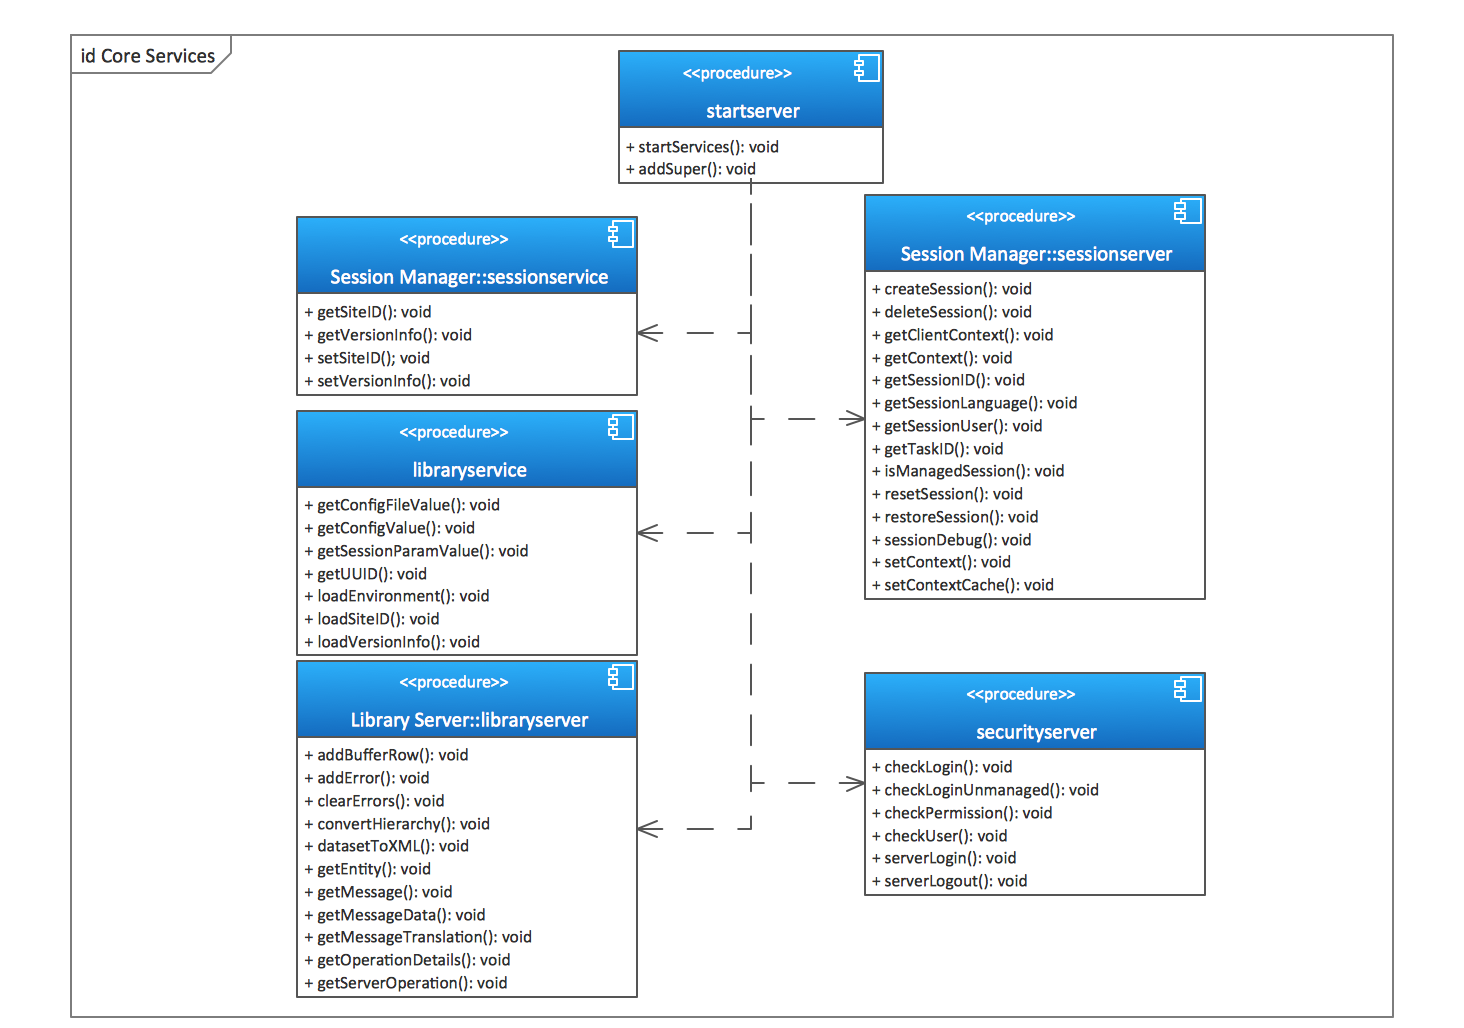
Example 1. UML Class Diagrams
This UML Class Diagram was created in ConceptDraw DIAGRAM diagramming software using the Rapid UML solution from the Software Development area of ConceptDraw Solution Park. On this diagram you can see classes and the relationships between them. Classes are represented as boxes and are connected with different types of associations.
Use the solutions of Software Development area for ConceptDraw DIAGRAM to create your own professional looking Software Diagrams quick and easy.
TEN RELATED HOW TO's:
Newfoundland and Labrador is the easternmost province of Canada.
The vector stencils library Newfoundland and Labrador contains contours for ConceptDraw DIAGRAM diagramming and vector drawing software. This library is contained in the Continent Maps solution from Maps area of ConceptDraw Solution Park.
Picture: Geo Map - Canada - Newfoundland and Labrador
Related Solution:
Credit Card Processing System UML Diagram. This sample shows the Use Case Diagram of the credit card processing system. You can see how the payment by credit card occurs. This sample can be used by the bank, financial enterprises, for understanding the work of the credit card processing system at the projecting the banking systems.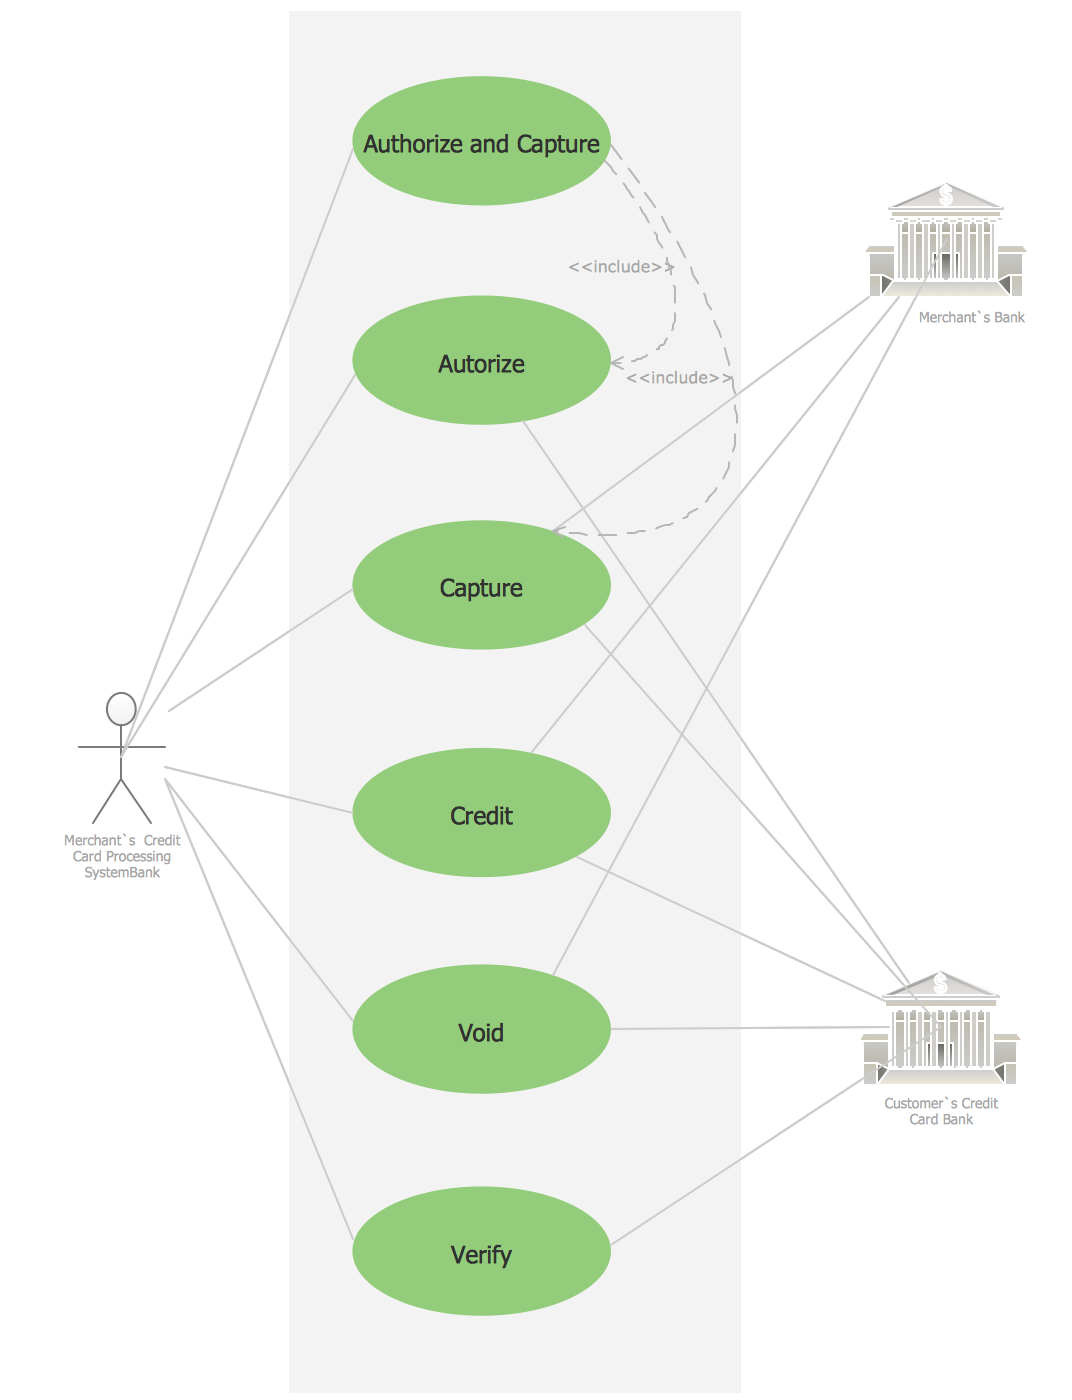
Picture: Credit Card Processing System UML Diagram
Related Solution:
How should diagramming software work? The answer is - Fast and easy.
Tree- mode drawing works like that. Just select objects in your drawing and press Tree or Chain button to connect all of them just in one click.
Your diagram looks professional and it took only a moment to draw.
Picture: ConceptDraw Arrows10 Technology
Try ConceptDraw program, the perfect drawing tool for creating all kinds of great-looking drawings, charts, graphs, and illustrations.
Picture: Basic Diagramming
Related Solution:
Holiday recipes are always recipes of amazingly delicious and beautiful dishes that delight by decoration and miraculous combination of ingredients, and remain long in the memory. Design of illustrations for recipes of holiday dishes for cookbooks, magazines and websites is a special art, because one of the main criteria for selection the recipe and its next cooking is colorful and appetizing illustration.
ConceptDraw DIAGRAM diagramming and vector drawing software extended with powerful tools of Cooking Recipes solution from the Food and Beverage area of ConceptDraw Solution Park will help easy create colorful, bright, attractive and appetizing illustrations on preparation and decoration holiday dishes.
Picture: Holiday Recipes
Related Solution:
When talking about engineering, one should define all the terms used, so anybody could understand the topic. Typical network glossary contains definitions of numerous network appliances, types of networks and cable systems. The understanding of basic is crucial for server management, network administration and investigating problems.
The network glossary defines terms related to networking and communications. The most of glossary items has their visual representation in ConceptDraw DIAGRAM libraries of the Computer Network Diagrams solution. This illustration presents a local area network (LAN) diagram. It designed to show the way the interaction of network devices in a local network. The diagram uses a library containing symbols of network equipment, connections and the end-point devices such as network printer, hubs, server, modem and finally computers (PC, mac, laptop). This diagram depicts a physical LAN topology.
Picture: Network Glossary Definition
Related Solution:
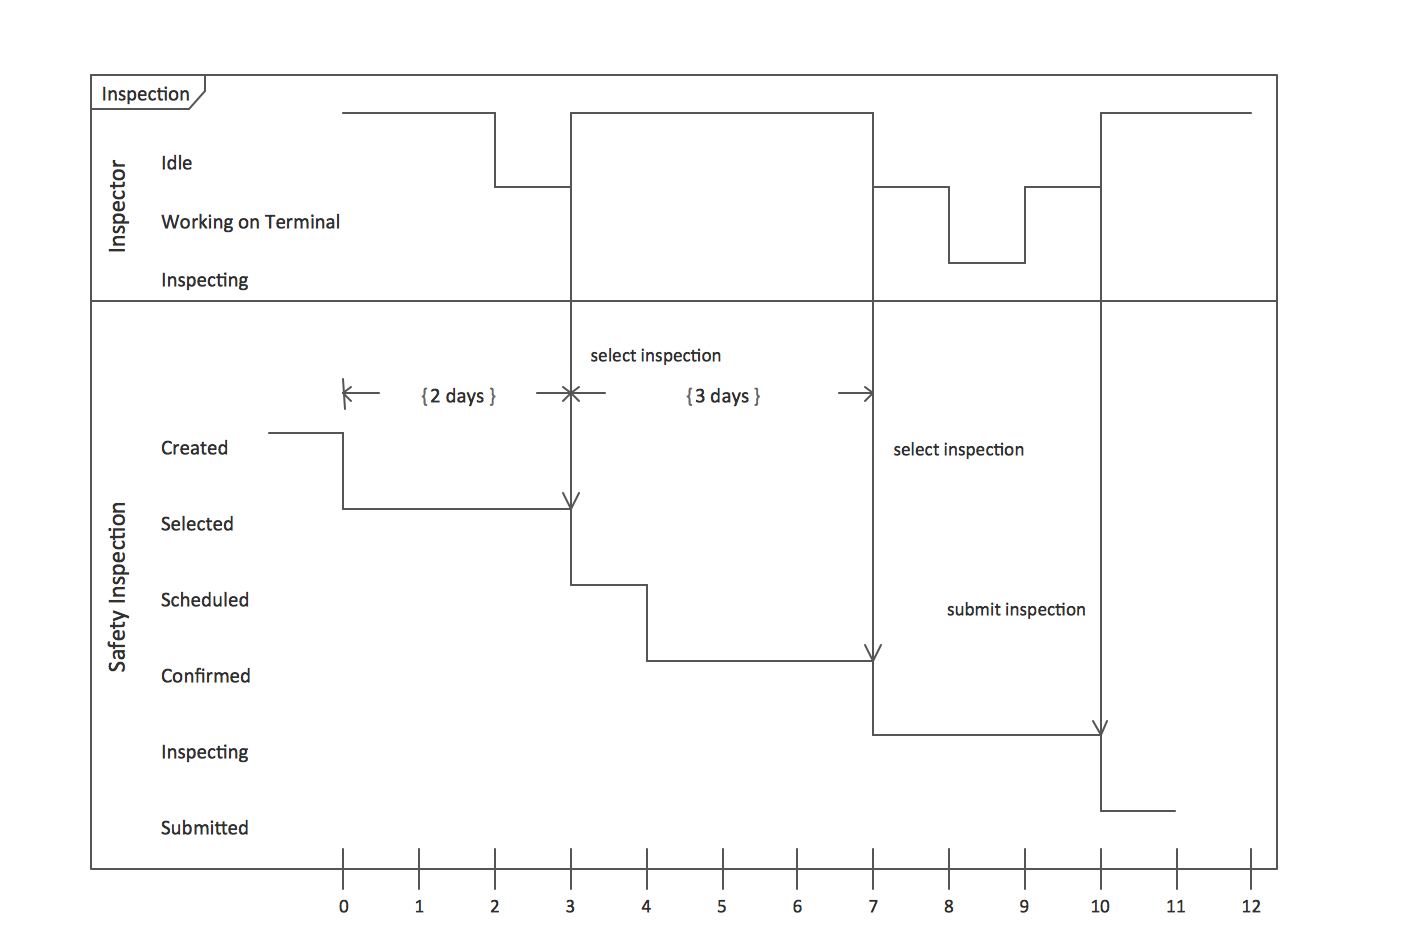
Sequence Diagrams shows how objects communicate with each other in terms of a sequence of messages. Also indicates the lifespans of objects relative to those messages.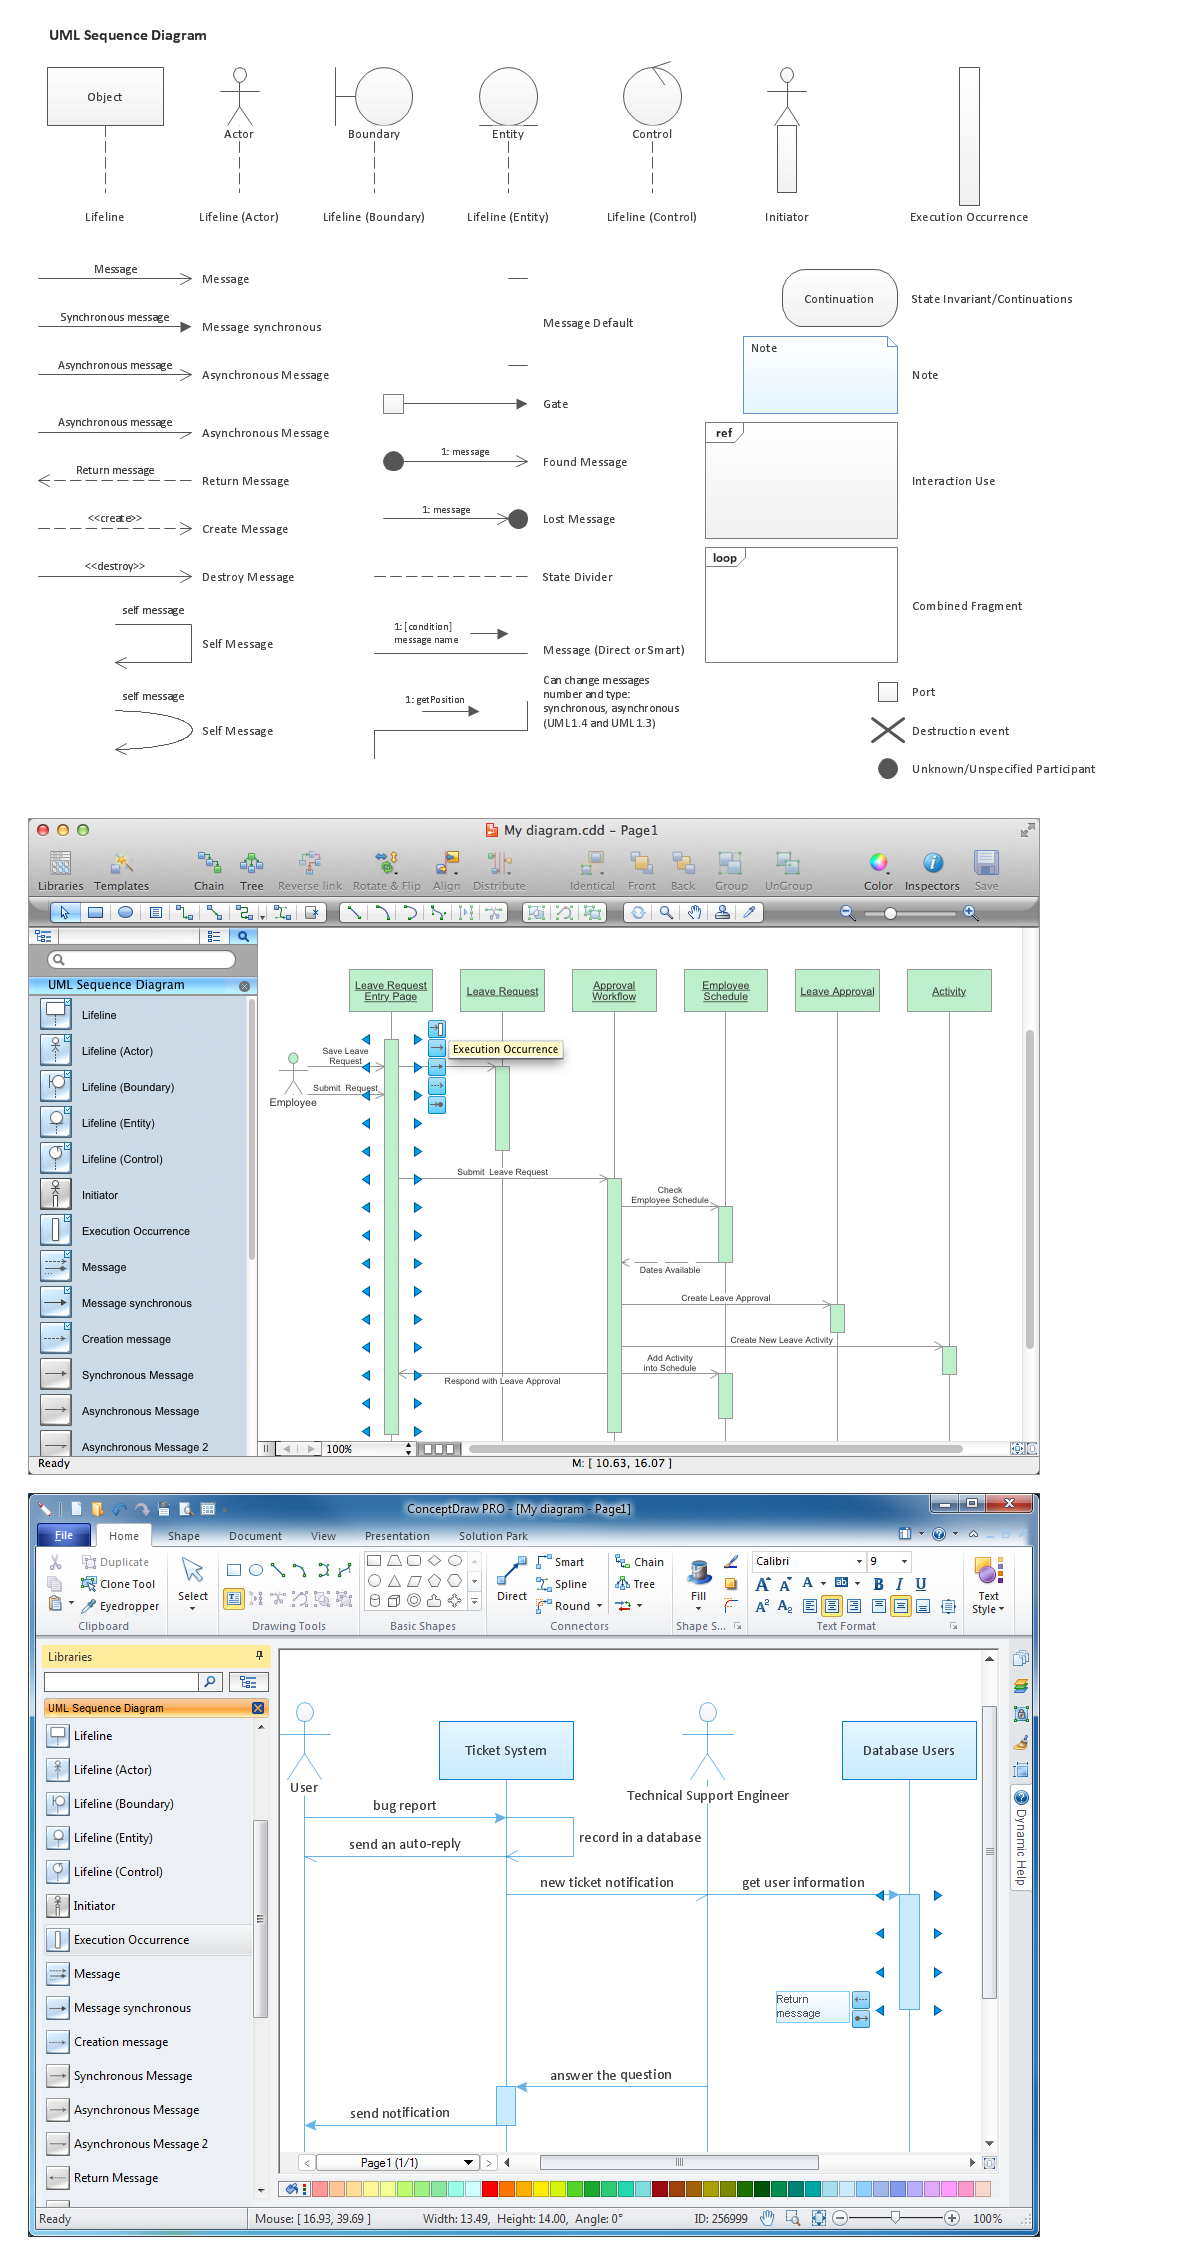
Picture: Diagramming Software for designing UML Sequence Diagrams
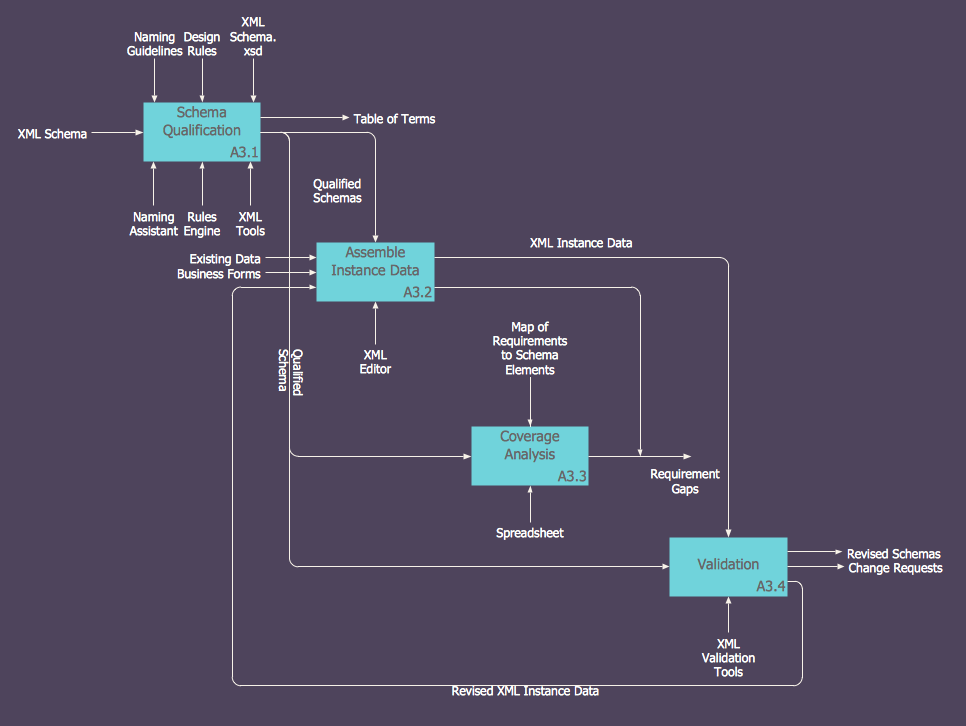
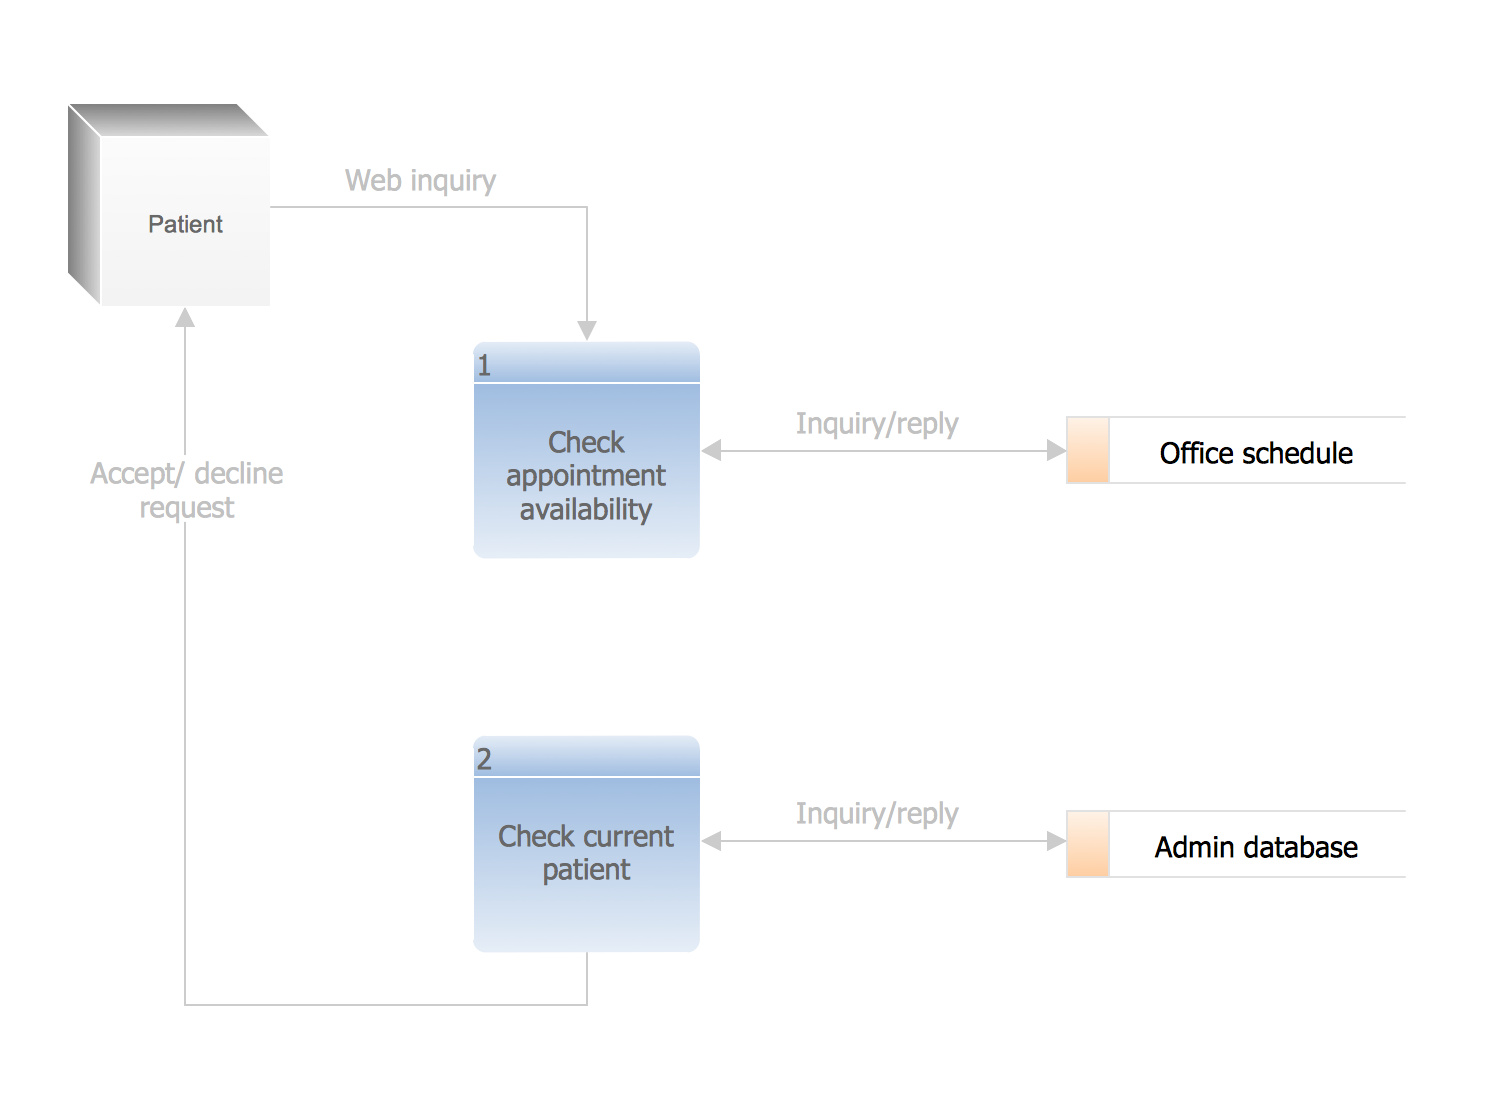
Use Case Diagrams technology. IDEF3 Standard is intended for description and further analysis of technological processes of an enterprise. Using IDEF3 standard it is possible to examine and model scenarios of technological processes.
Picture: IDEF3 Standard
The ConceptDraw Flowchart component includes a set of samples and templates. This geathered as flowchart maker toolbox which focused on drawing flowcharts of any industry standards.
Picture: Flowchart Components
Related Solution:
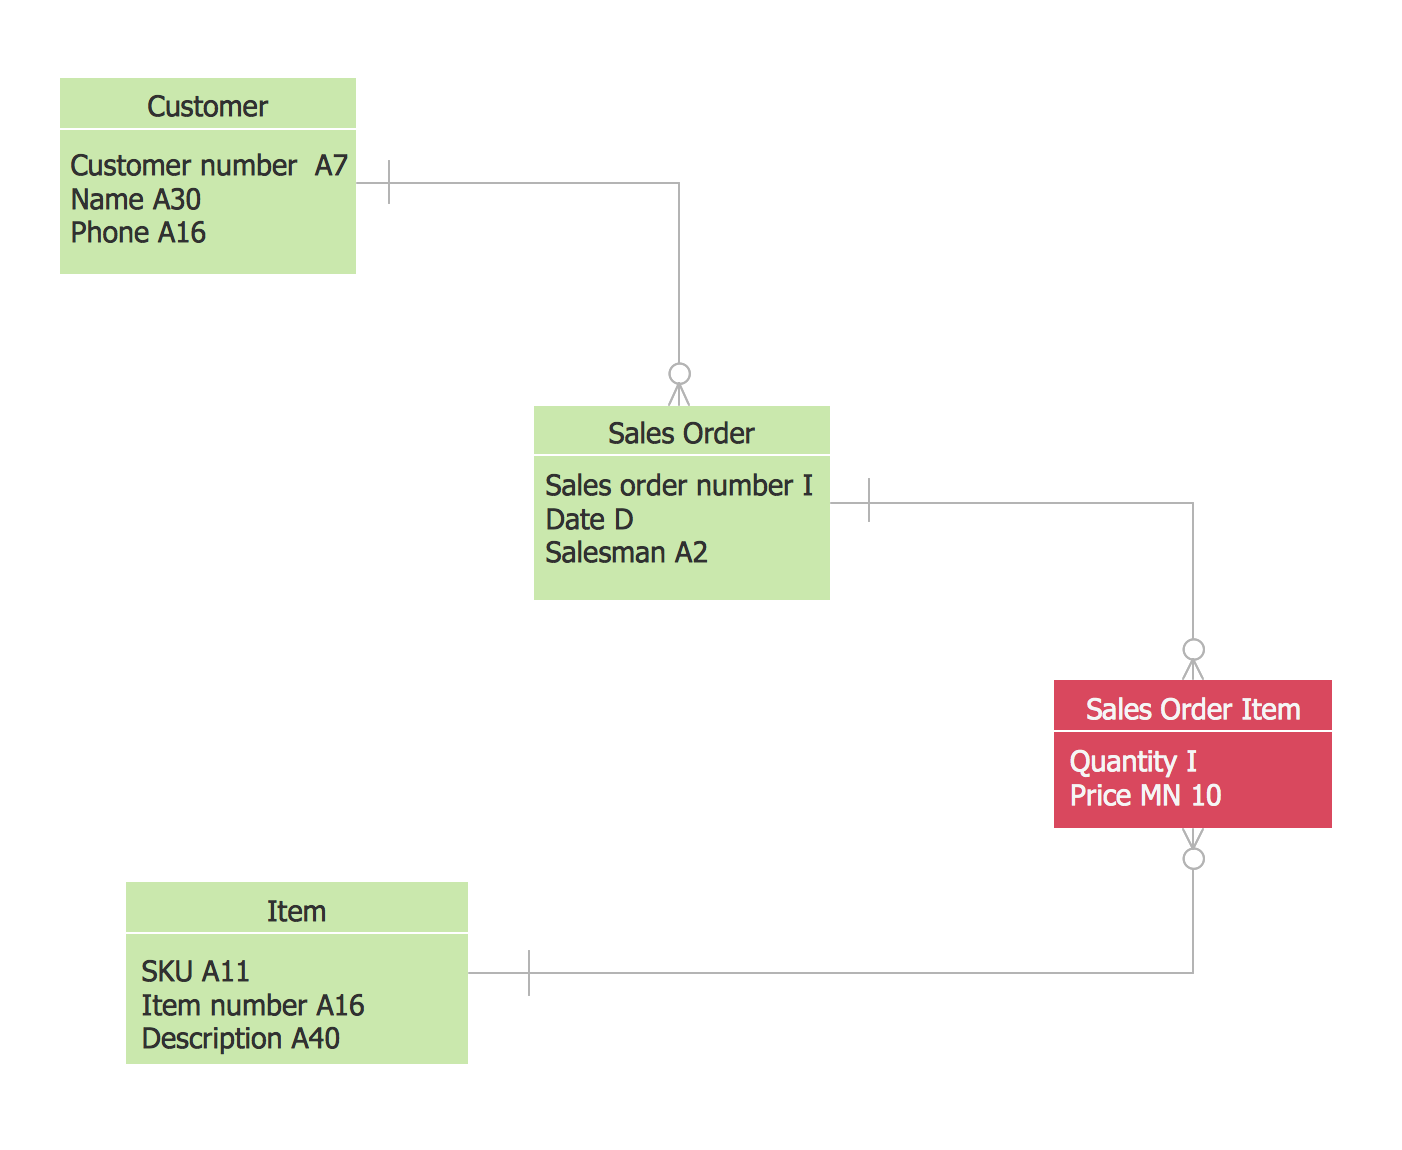
Database structures are usually described by ER-diagrams which represents entities as boxes with lines-connections between them. You can create any entity-relationship diagram (ERD) by means of ConceptDraw DIAGRAM using ready-to-use templates and special libraries containing all the needed symbols and shapes. Creating a model for your database from now on can take just a few minutes.
ERD (entity relationship diagram) designed to show the logical structure of databases. It intended to depict the relationships between data components (entities). ERDs are a popular tool for software engineers and architects. Using ERD they can manage the every aspect of database design. Also ERD can be used as guidelines for testing and communications before software release. This diagram represents the file reference system of the WordPress web platform. Because entity relationship diagrams have such a broad application area through the prevalence of database technology, it can be applied for a wide range of users.
Picture: Entity-Relationship Diagram (ERD) with ConceptDraw DIAGRAM
Related Solution:
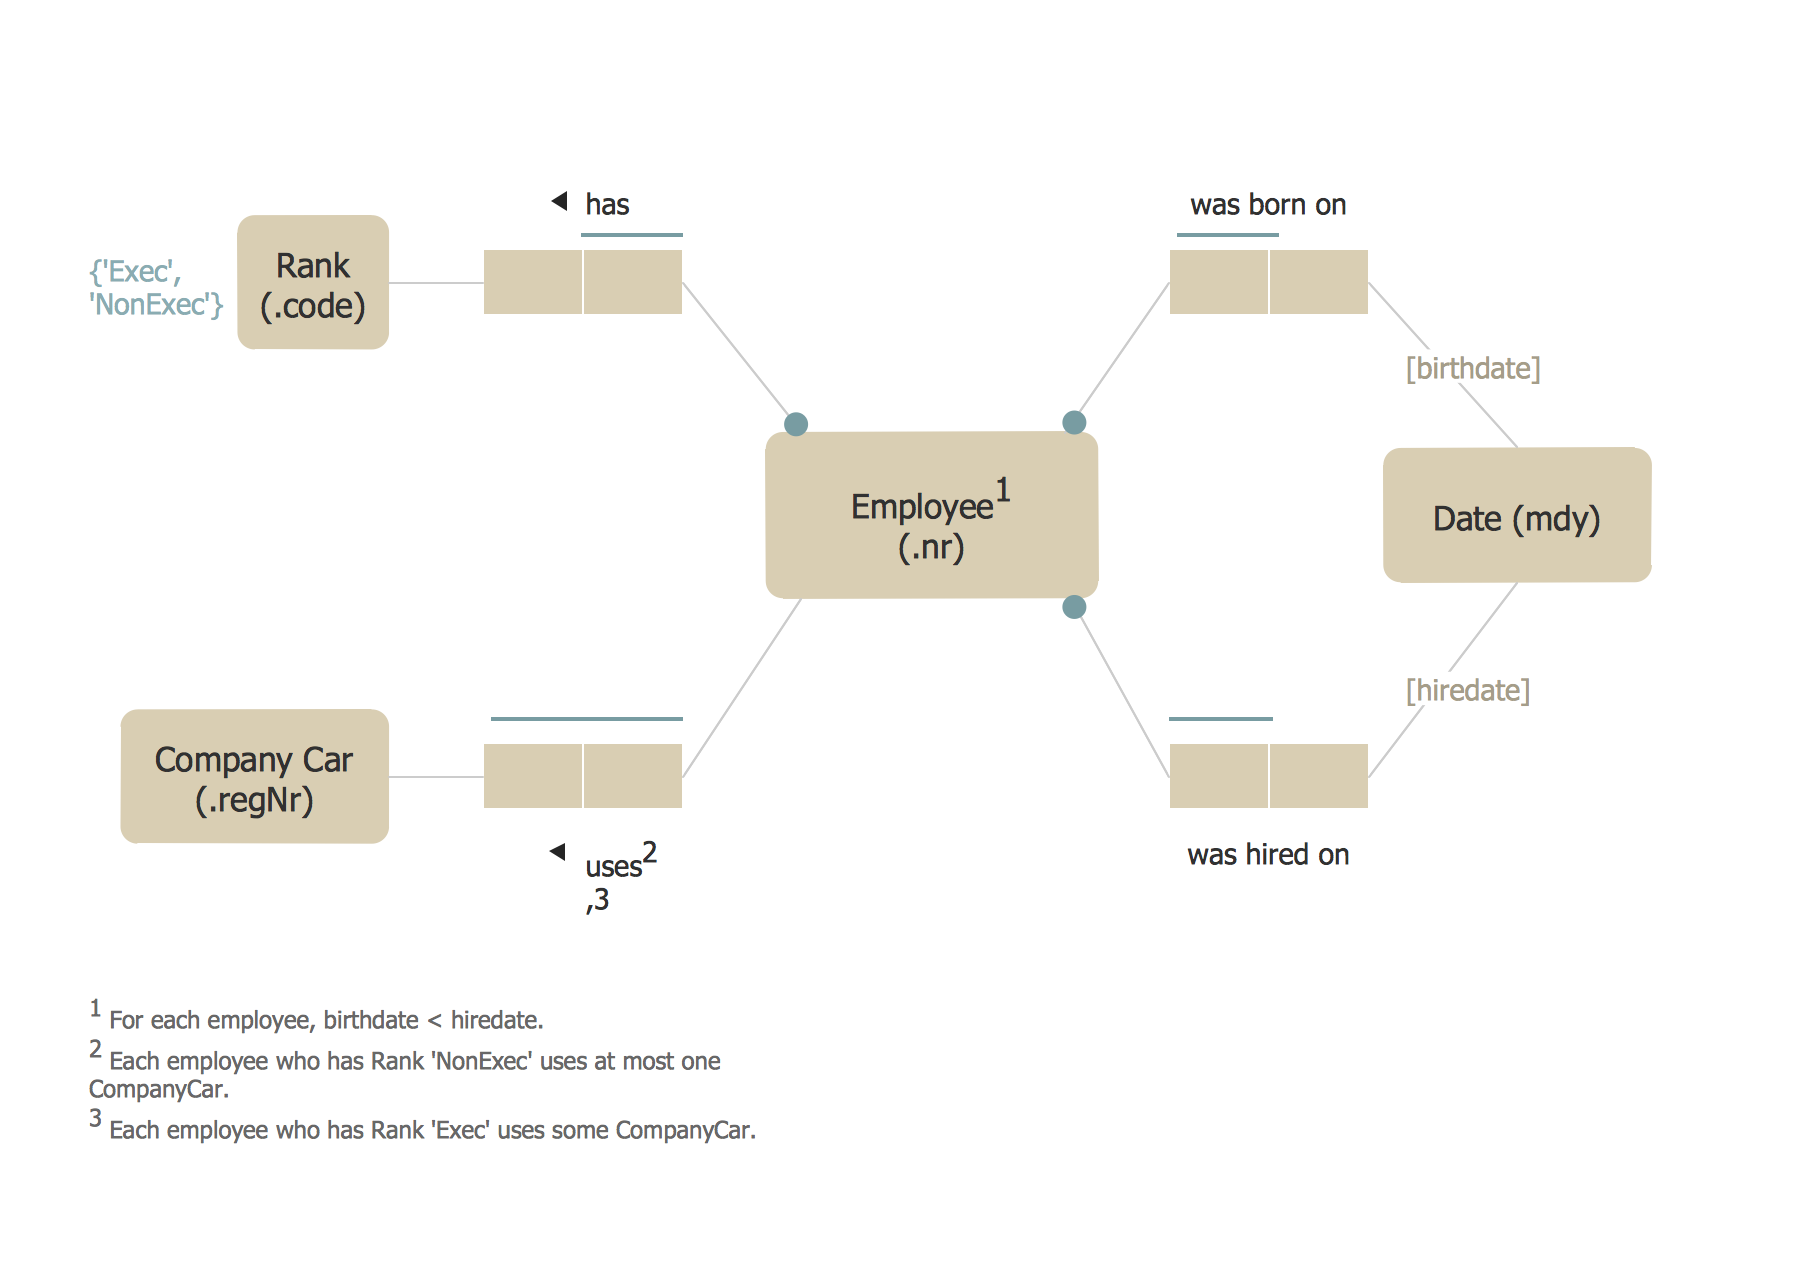
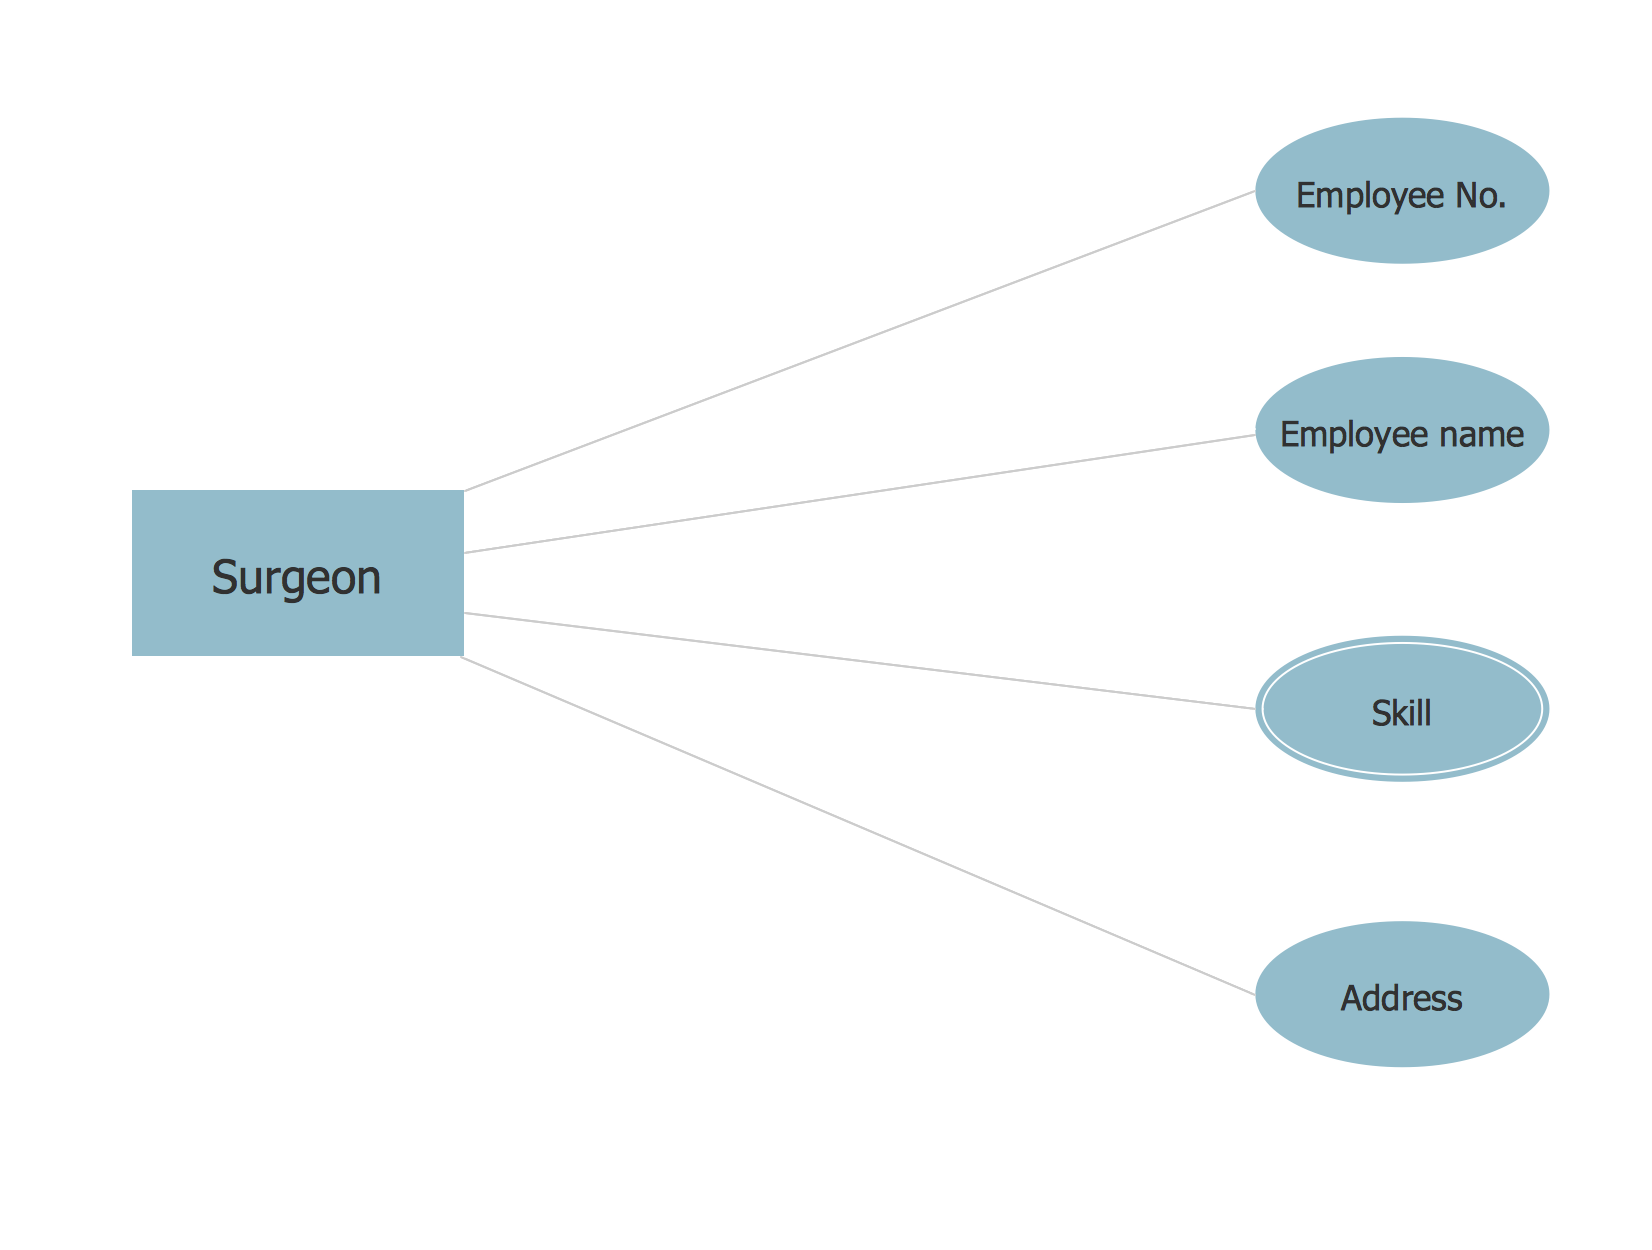
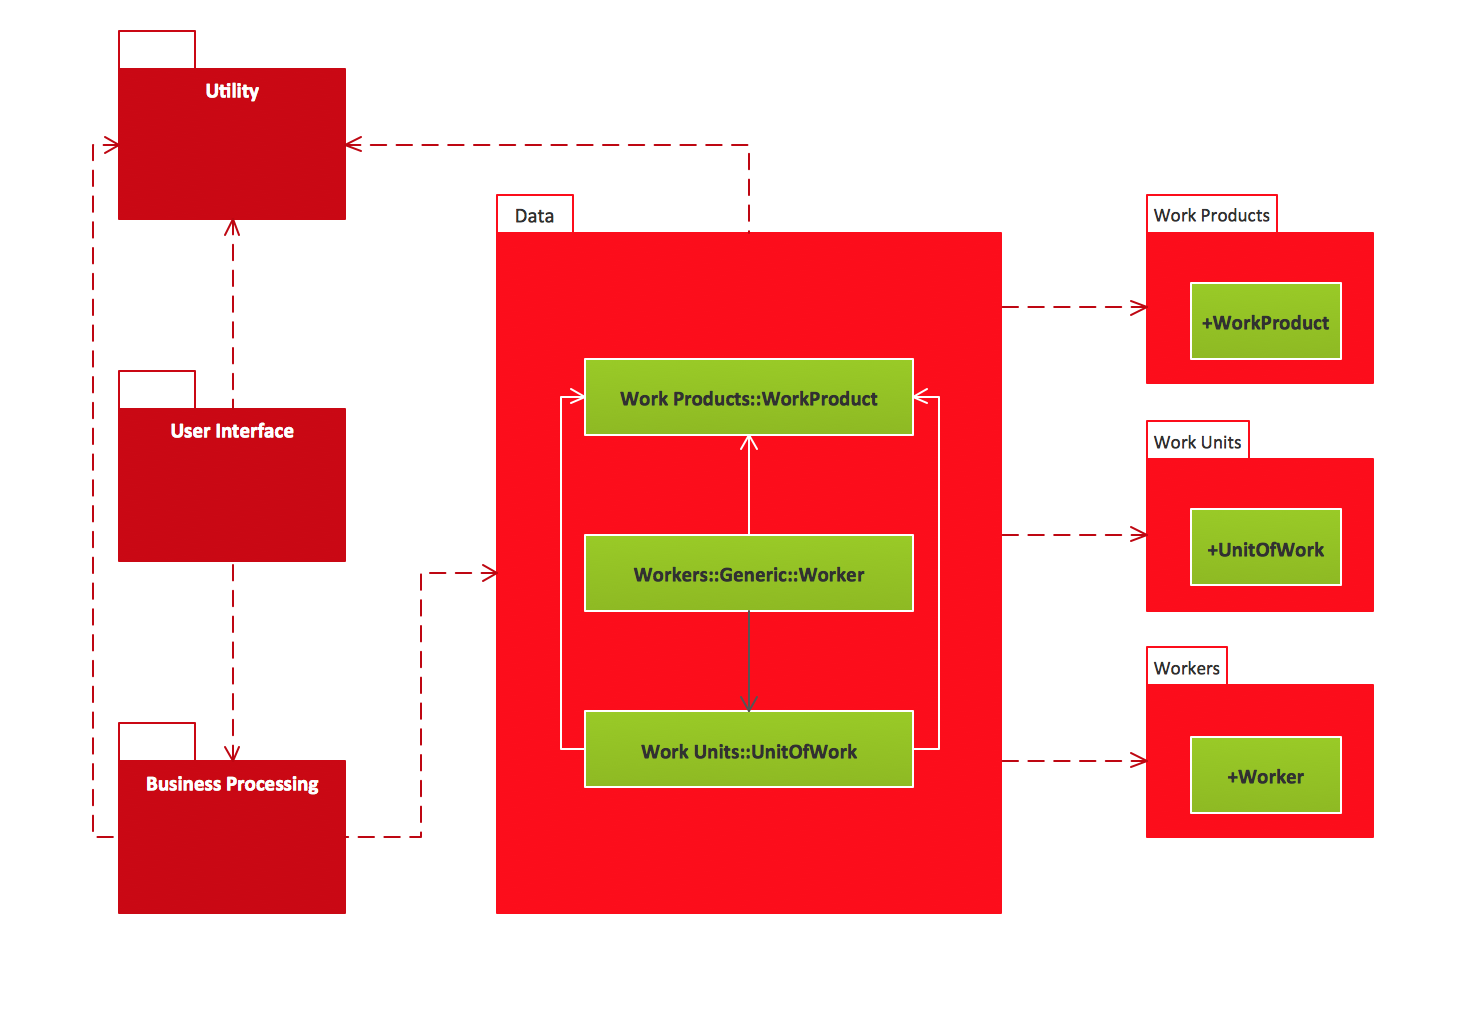
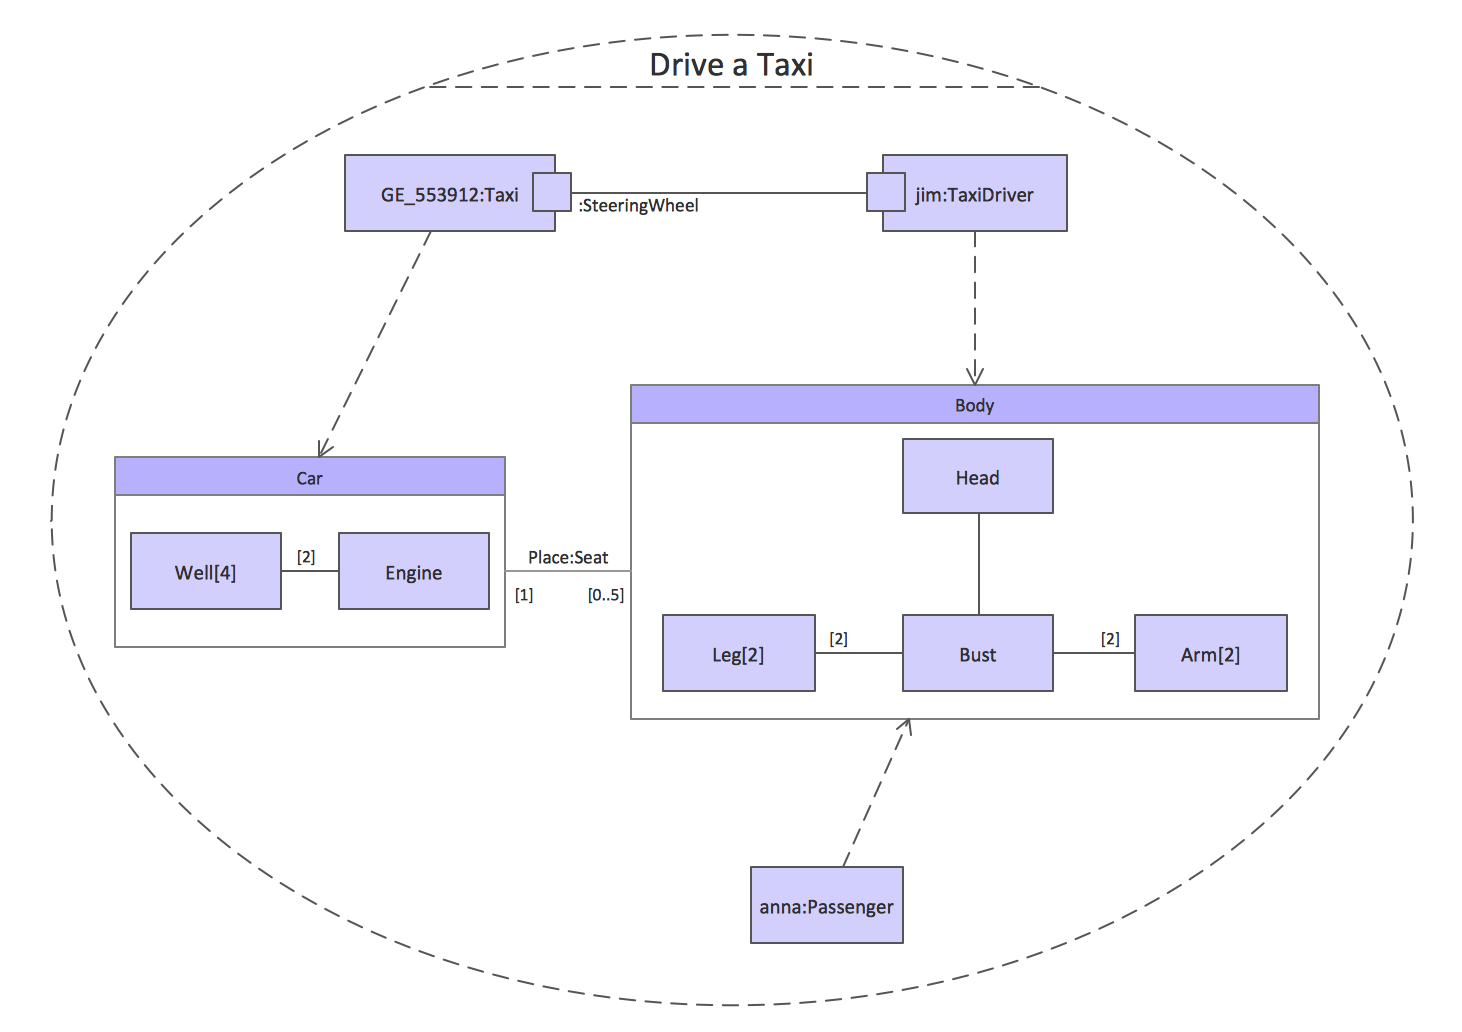
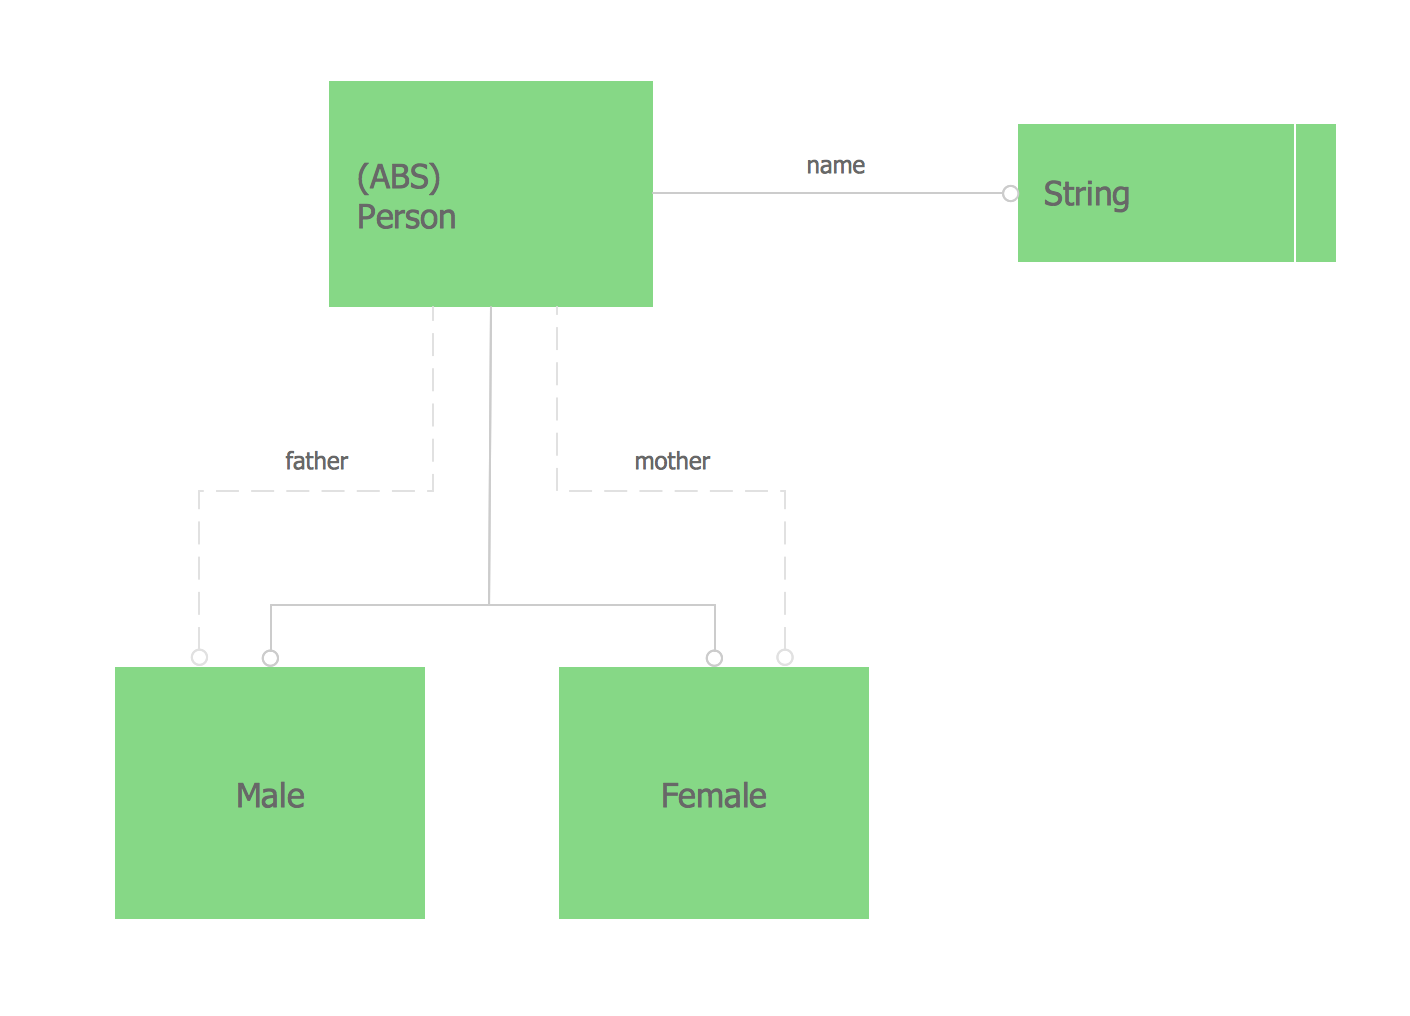 Express-G Diagram
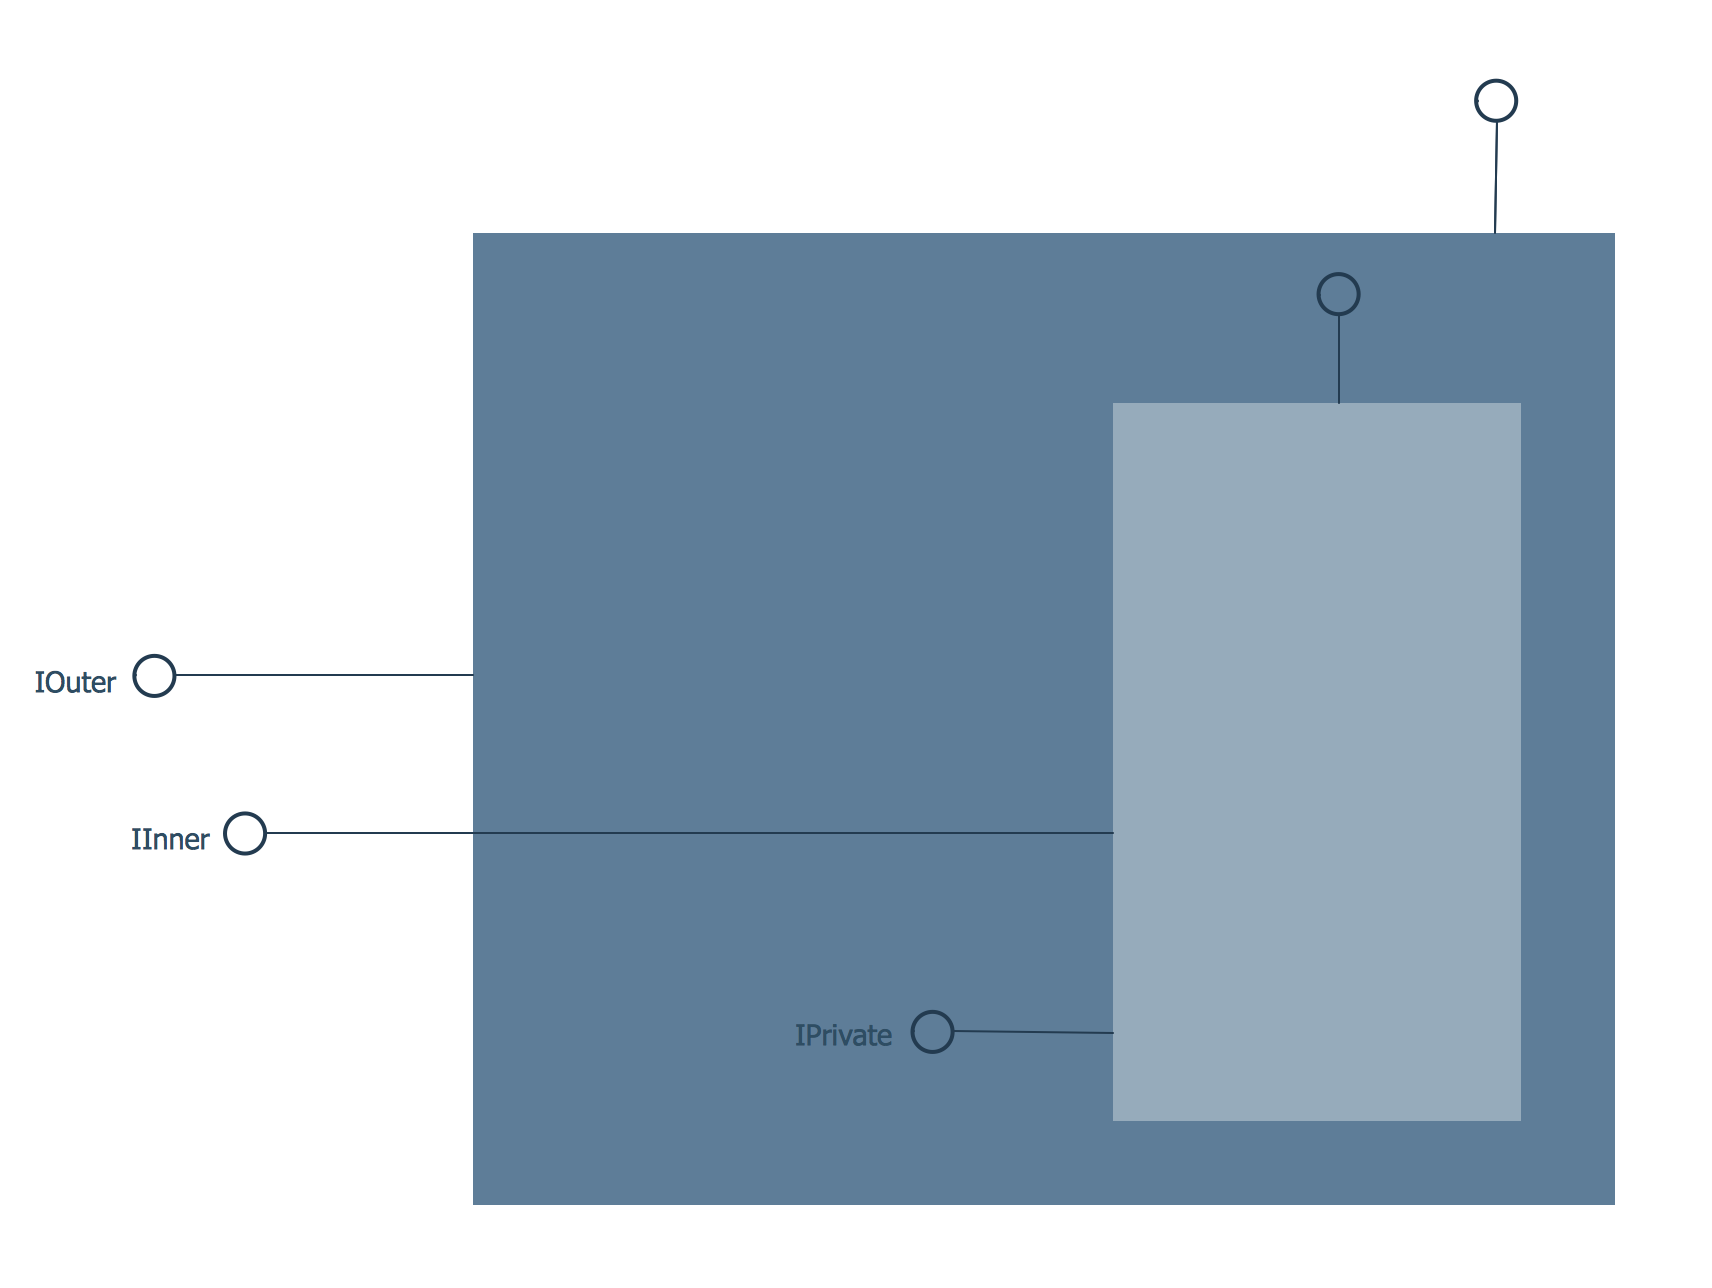
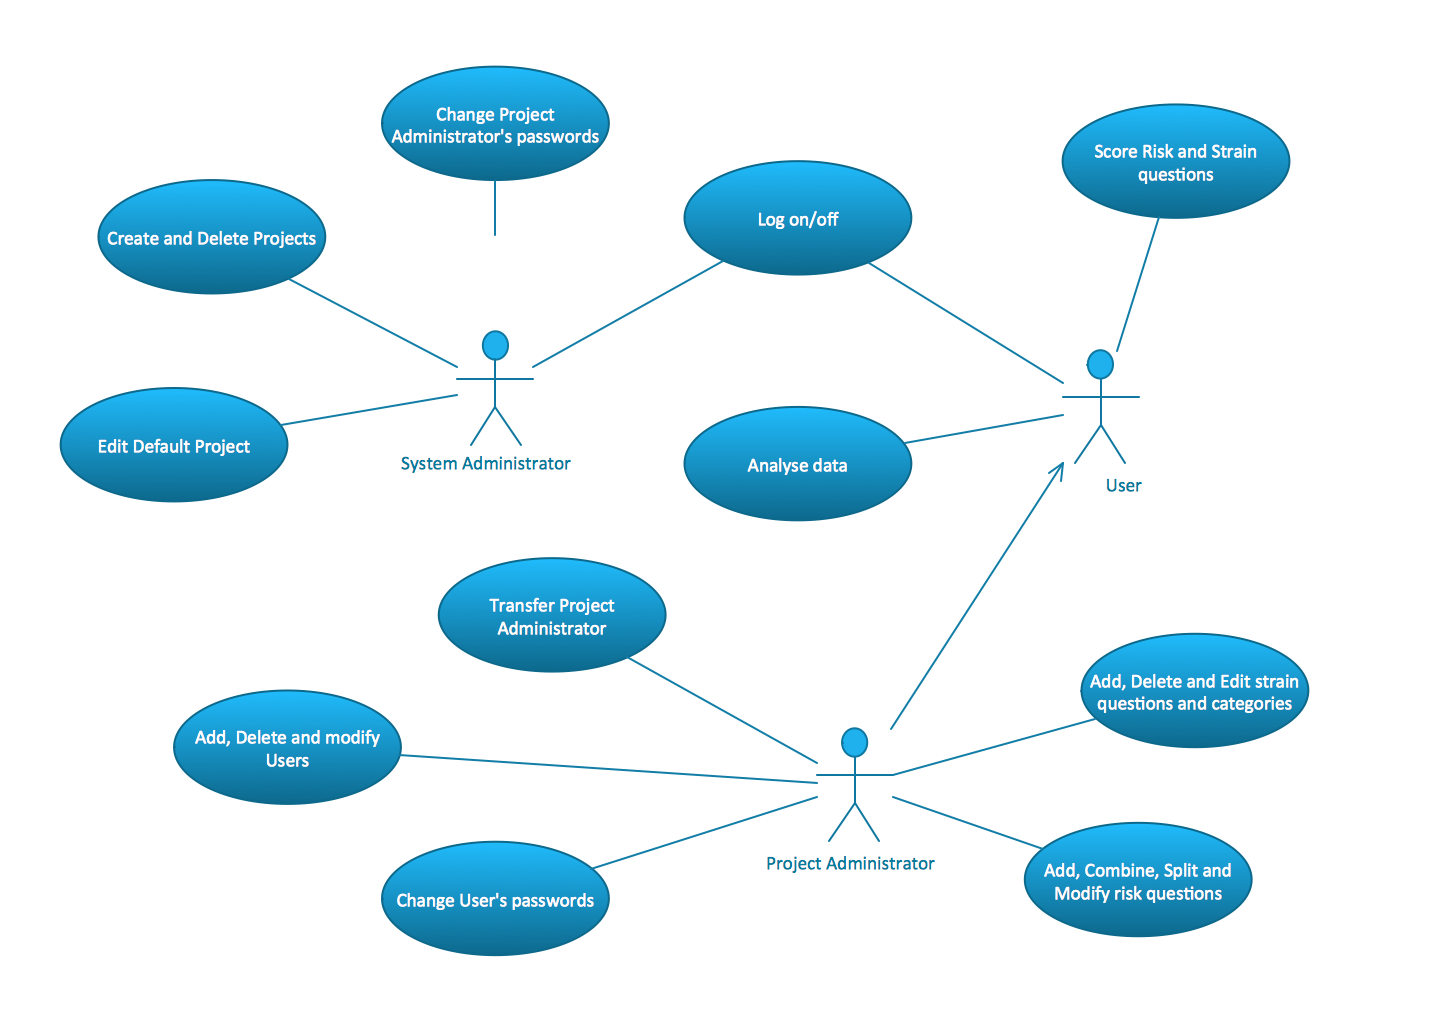
 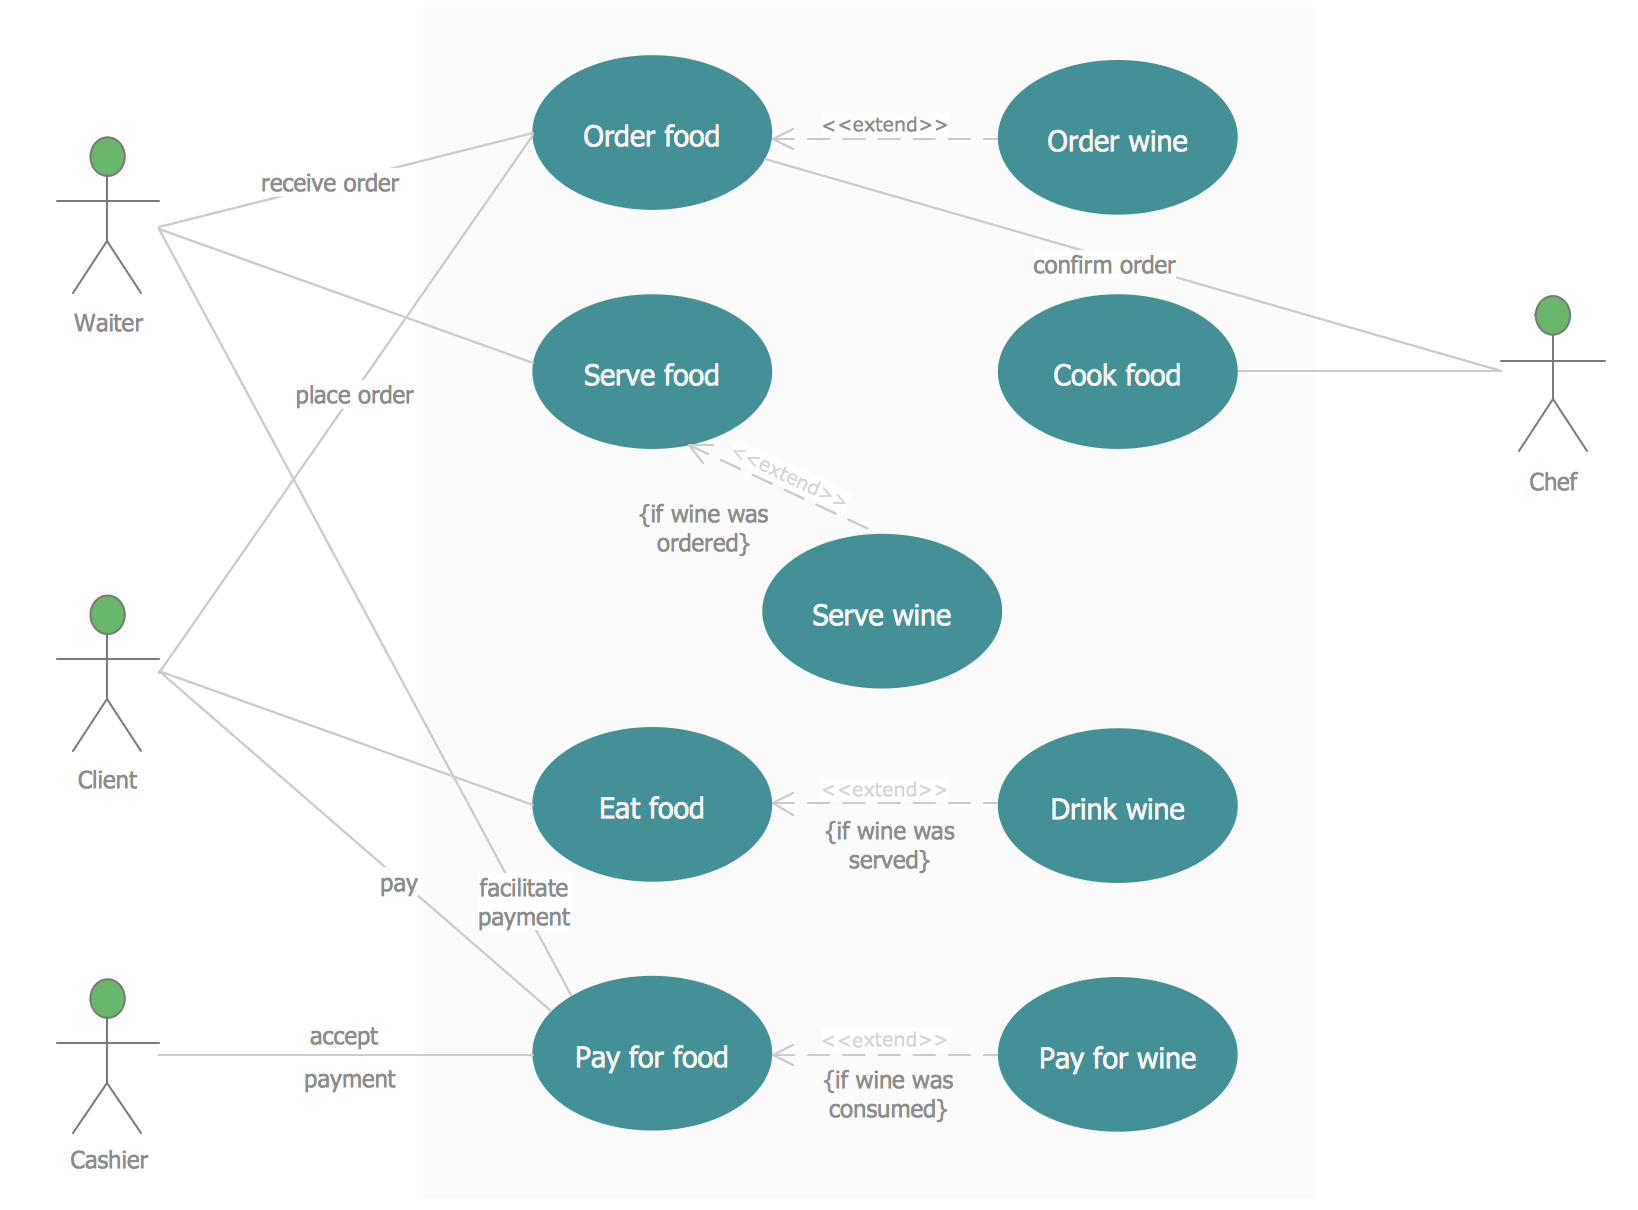 Jacobson Use Cases Diagram