UML Diagram for System
This sample shows the UML Class Diagram of delivery system. On this diagram you can see the classes that are connected with aggregation and composition associations indicated with the multiplicity. This sample can be used by delivery services, postal services.This sample was created in ConceptDraw DIAGRAM diagramming and vector drawing software using the UML Class Diagram library of the Rapid UML Solution from the Software Development area of ConceptDraw Solution Park.
This sample shows the UML Class Diagram of delivery system. On this diagram you can see the classes that are connected with aggregation and composition associations indicated with the multiplicity. This sample can be used by delivery services, postal services.

Example 1. UML Diagram for System
Using the libraries of the Rapid UML Solution for ConceptDraw DIAGRAM you can create your own visual vector UML diagrams quick and easy.
UML Resource:
- UML Software
- How to create a UML Diagram
- UML Diagram Examples
- Class Diagram
- Use Case Diagram
- Timing Diagram
- Interaction Overview Diagram
- Communication Diagram
- State Machine Diagram
- Activity Diagram
- Deployment Diagram
- Package Diagram
- Collaboration Diagram
- Object Diagram
- Sequence Diagram
- Composite Structure
- Component Diagram
TEN RELATED HOW TO's:
UML Composite Structure Diagram shows the internal structure of a class and the possible interactions at this structure.
ConceptDraw has 393 vector stencils in the 13 libraries that helps you to start using software for designing your own UML Diagrams. You can use the appropriate stencils of UML notation from UML Composite Structure library.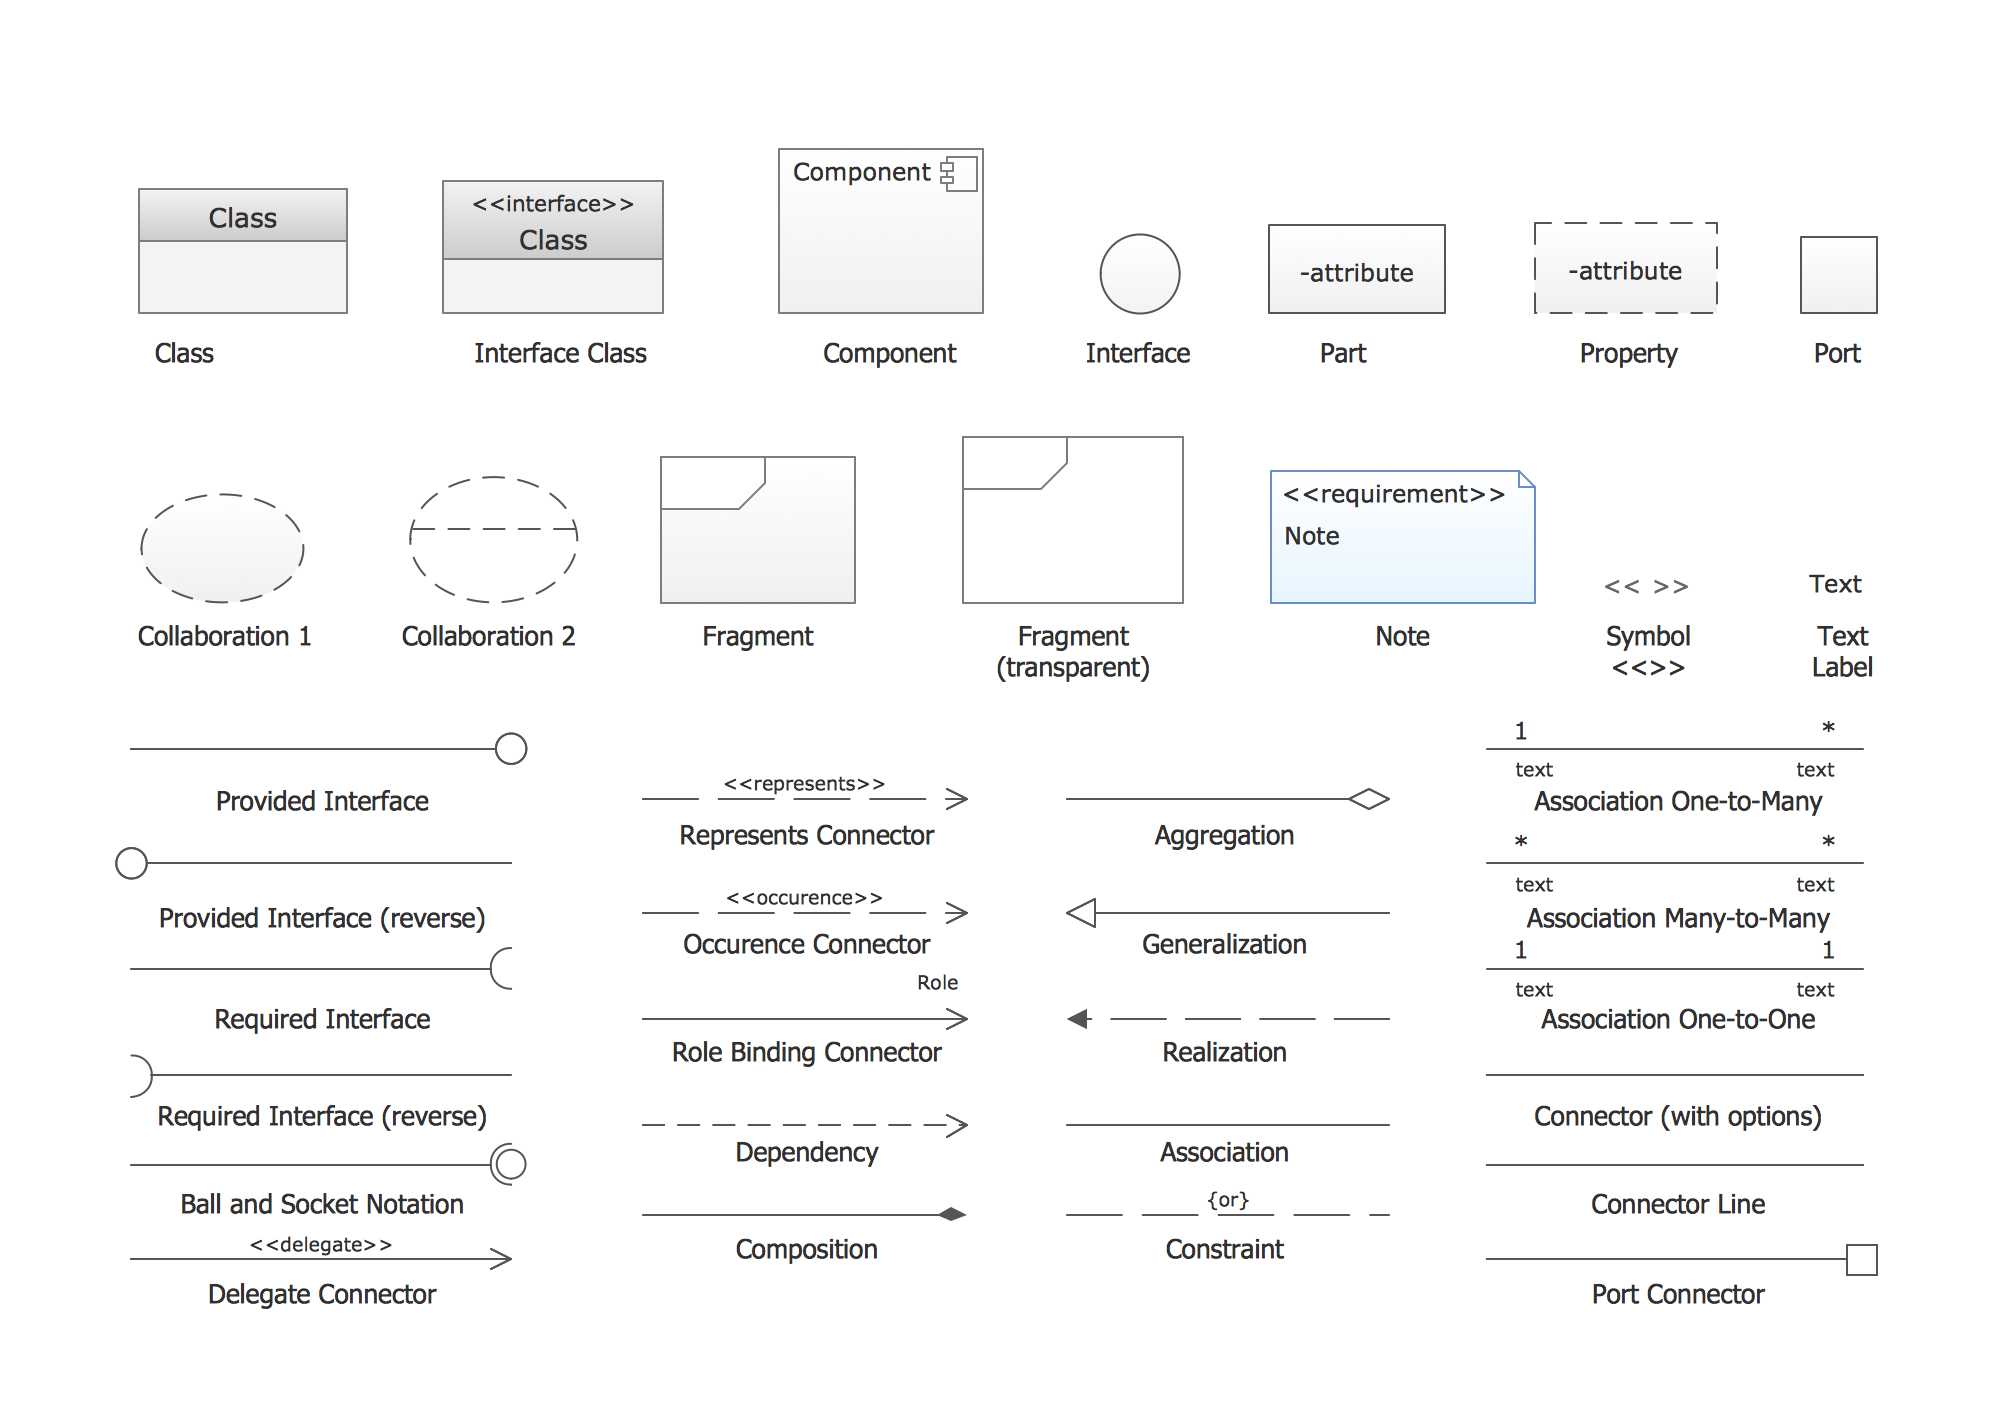
Picture: UML Composite Structure Diagram. Design Elements
Related Solution:
UML Component Diagram Online Shopping. This sample was created in ConceptDraw DIAGRAM diagramming and vector drawing software using the UML Component Diagram library of the Rapid UML Solution from the Software Development area of ConceptDraw Solution Park.
This sample shows the concept of the online shopping and is used for the understanding of the online shopping processes, of the online shops working processes, for projection and creating of the online stores.
Picture: UML Component Diagram Example - Online Shopping
Related Solution:
Wireless Network solution contains template, library and a set of design elements that help network engineers visualize Wireless Network. Network engineers and designers use this solution to design, create and illustrate the wireless networks.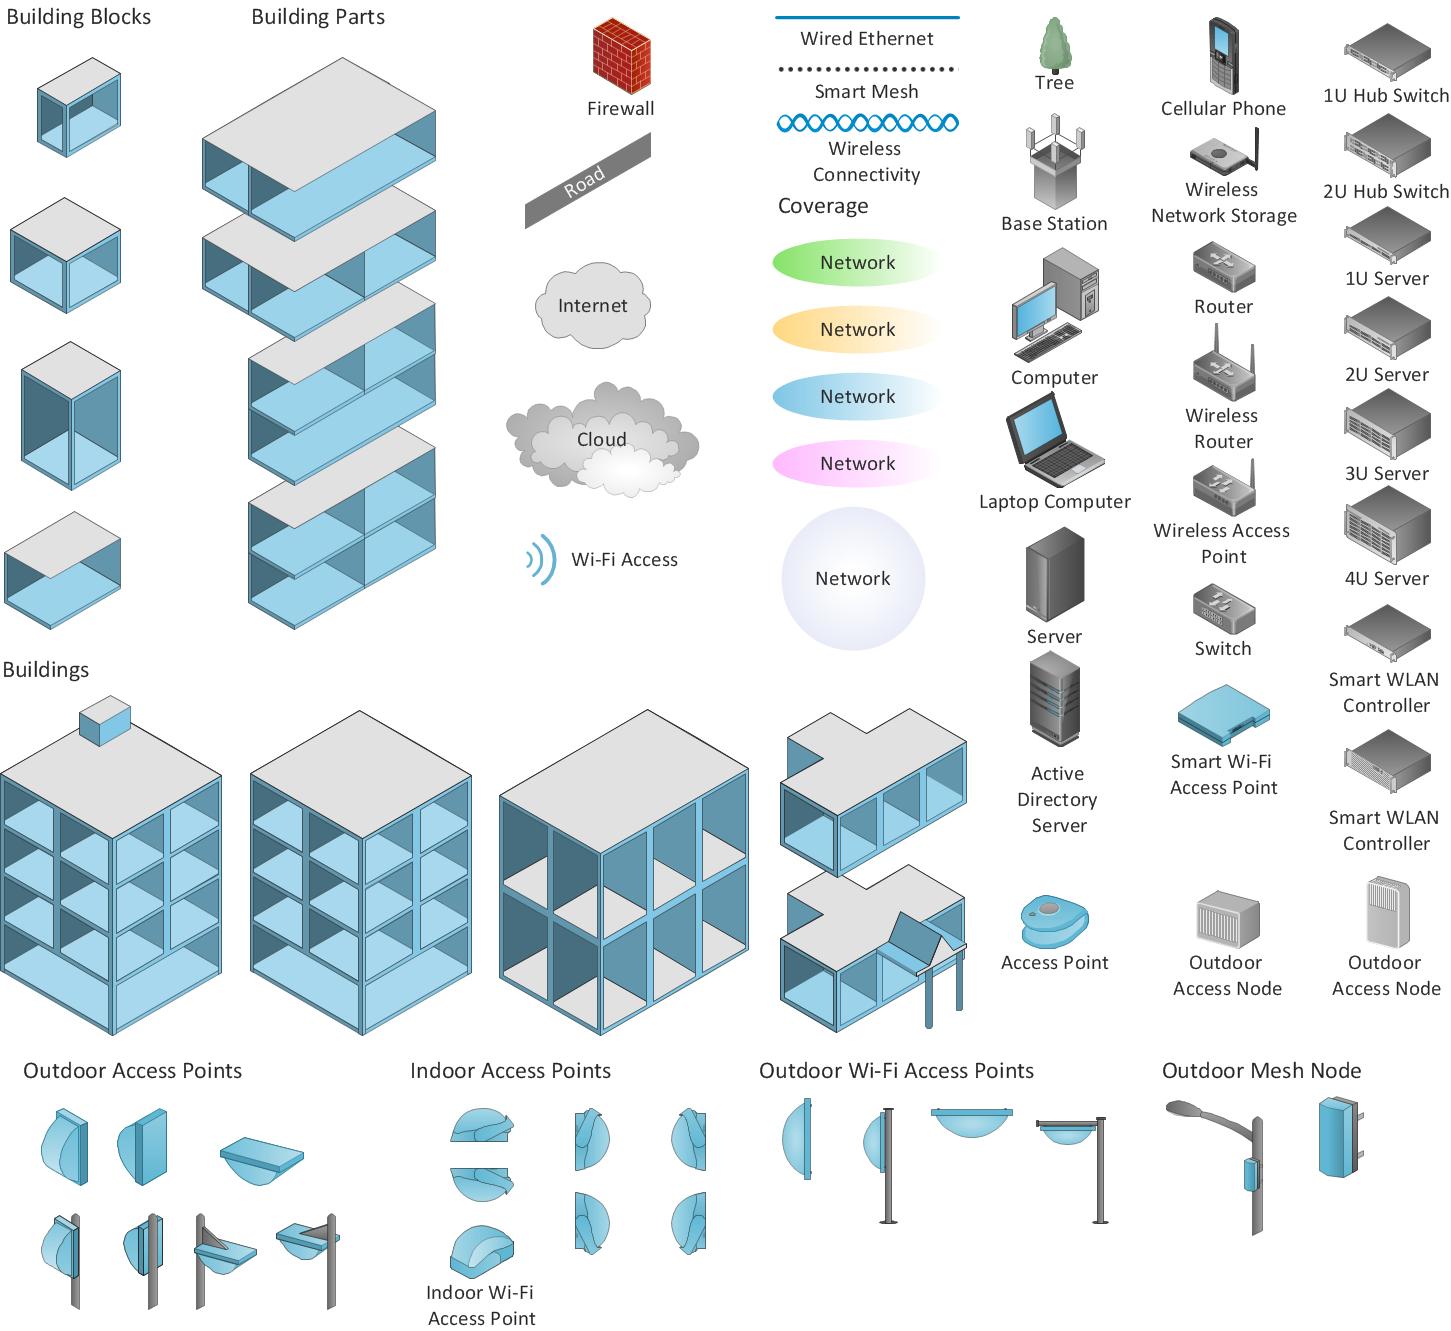
Picture: ConceptDraw DIAGRAM is an Advanced tool for Professional Network Diagrams Creation
Related Solution:
Computer networks nowadays are spread all across the world. The large number of parameters, such as geographic scale or communication protocols, can divide networks. One of the most common types of networks is called local area network (LAN). It convenient to represent network examples by means of diagrams.
This local area network (LAN) diagram provides an easy way to see the way the devices in a local network are interacted. The diagram uses a library containing specific symbols to represent network equipment , media and the end-user devices such as computers (PC, mac, laptop) , network printer, hubs, server and finally a modem. There are two types of network topologies: physical and logical. The current diagram represents precisely a physical type of LAN topology because it refers to the physical layout of a local network equipment.
Picture:
What is a Local Area Network?
Examples of LAN Diagrams
Related Solution:
A flowchart is a powerful tool for examining processes. It helps improving processes a lot, as it becomes much easier to communicate between involved people, to identify potential problems and to optimize workflow. There are flowcharts of different shapes, sizes and types of flowchart vary from quite basic process flowcharts to complex program flowcharts. Nevertheless, all these diagrams use the same set of special symbols like arrows to connect blocks, parallelogram to show data receiving or rectangles for showing process steps.
Basic flowcharts are used to represent a simple process algorithm. A basic flowchart notation consists of rectangles (business processes), arrows (the flow of information, documents, etc.). The same notation is used in items such as the "decision", which allow you to do the branching. To indicate the start of the entire business process and its termination can be used the "Terminator" element. The advantages of Basic Flowchart are simplicity and clarity. With it you can quickly describe the business process steps. Creating of Basic Flowchart does not require any special knowledge, as easily understand by employees with different levels of education and IQ.
Picture: Types of Flowchart: Comprehensive Overview
Related Solution:
For documenting the Cloud Computing Architecture with a goal to facilitate the communication between stakeholders are successfully used the Cloud Computing Architecture diagrams. It is convenient and easy to draw various Cloud Computing Architecture diagrams in ConceptDraw DIAGRAM software with help of tools of the Cloud Computing Diagrams Solution from the Computer and Networks Area of ConceptDraw Solution Park.
Picture: Cloud Computing Architecture Diagrams
Related Solution:
The Rapid UML solution provides diagram examples, templates and vector stencils libraries for quick and easy drawing all types of UML 2.x and 1.x diagrams
Picture: UML Business Process
Related Solution:
When studying a business process or system involving the transfer of data, it is common to use a Data Flow Diagram (DFD) to visualize how data are processed. Being initially used exclusively in regards to the flow of data through a computer system, now DFDs are employed as the business modeling tools. They are applied to describe the business events and interactions, or physical systems involving data storage and transfer. ConceptDraw DIAGRAM is a powerful Data Flow Diagram software thanks to the Data Flow Diagrams solution from the Software Development area of ConceptDraw Solution Park.
Picture: Data Flow Diagram Software
Related Solution:
The Rapid UML Solution from the Software Development area of ConceptDraw Solution Park helps you to create the UML Class Diagrams quick and easy using ConceptDraw DIAGRAM diagramming and vector drawing software.
Picture: UML Class Diagram Tutorial
Related Solution:
ConceptDraw DIAGRAM extended with Data Flow Diagrams solution is the best diagramming and vector drawing software for quick and easy designing the Data Flow Diagram Example of any complexity.
Picture: Data Flow Diagram Example
Related Solution:
ConceptDraw
DIAGRAM 18