Diagramming Software for Design
UML Communication Diagrams
UML Communication Diagrams Designing
UML Communication Diagram depicts the interactions between objects or parts in terms of sequenced messages and describes both the static structure and dynamic behavior of a system.
ConceptDraw helps you to start designing your own UML Communication Diagrams with examples and templates.
You can use the appropriate stencils of UML notation for drawing UML Communication Diagram.
UML Communication Diagram Library
ConceptDraw Rapid UML solution delivers libraries contain pre-designed objects fit UML notation, and ready to draw professional UML Communication Diagram.

UML Timing Diagram Design Elements
Design elements sample shows all library objects at one page for quick review.

Design UML Communication Diagram in ConceptDraw DIAGRAM software
ConceptDraw DIAGRAM workspace is clear and simple. All tools you need for drawing UML Communication Diagram are on hand.


Examples of UML Communication Diagram
This is an example of UML Communication Diagram for an process.

ConceptDraw Rapid UML solution provides samples, templates and library of vector stencils to create both UML 2.0 communication diagrams and UML 1.x collaboration diagrams.
Use ConceptDraw DIAGRAM diagramming and vector drawing software enhanced with Rapid UML solution from ConceptDraw Solution Park to create your own UML 2.0 communication diagrams and UML 1.x collaboration diagrams that model both static structure and dynamic behavior of your systems.

TEN RELATED HOW TO's:
The Rapid UML Solution from the Software Development area of ConceptDraw Solution Park helps you to create the UML Class Diagrams quick and easy using ConceptDraw DIAGRAM diagramming and vector drawing software.
Picture: UML Class Diagram Tutorial
Related Solution:
To support you in your tasks you can use the power of ConceptDraw DIAGRAM providing
intelligent vector graphics that are useful for management diagramming and
ConceptDraw MINDMAP for key management mind maps.
Picture: Business Productivity - Management
Related Solution:
An organizational chart is a diagram that shows the structure of an organization and the relationships of its parts. ConceptDraw DIAGRAM extended with Organizational Charts Solution from the Management Area is powerful Organizational Chart Software.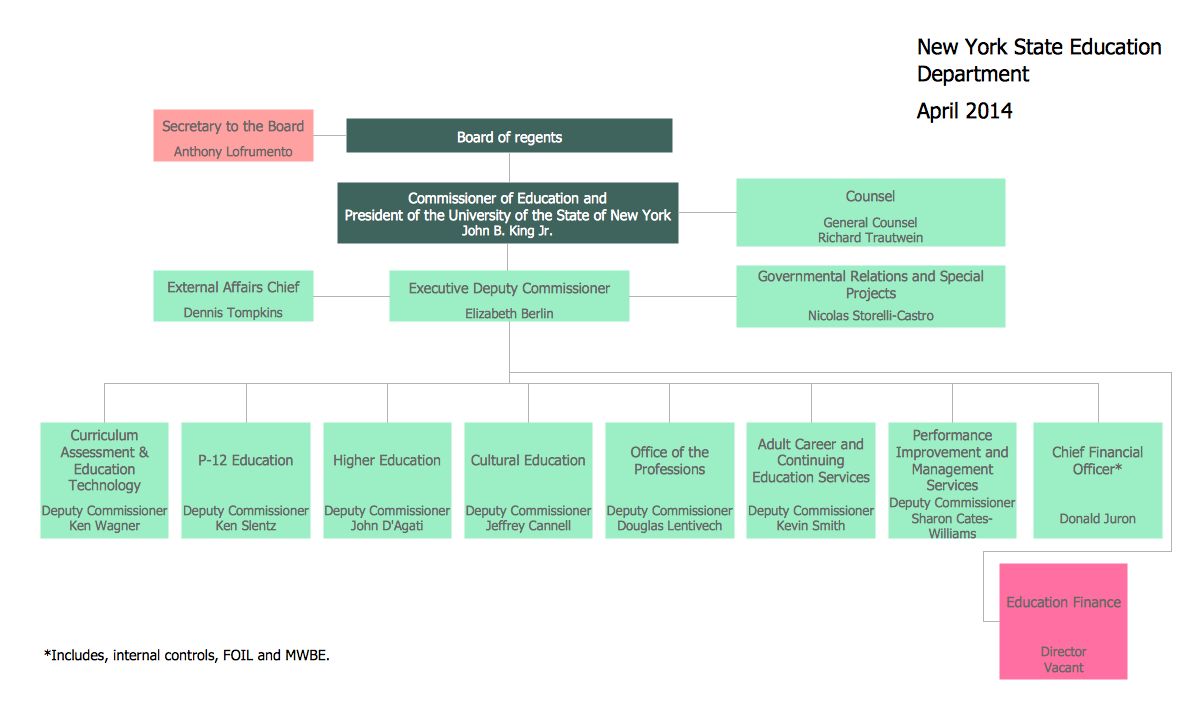
Picture: Organizational Chart
Related Solution:
A more detailed mind map of a business plan for a computer hardware reseller.
Picture: Computer Hardware - Reseller Business Plan
Related Solution:
ConceptDraw DIAGRAM vector diagramming and drawing software extended with Business Diagrams solution from the Management Area is a powerful software that will help you design professional-looking Circular Arrow Diagrams.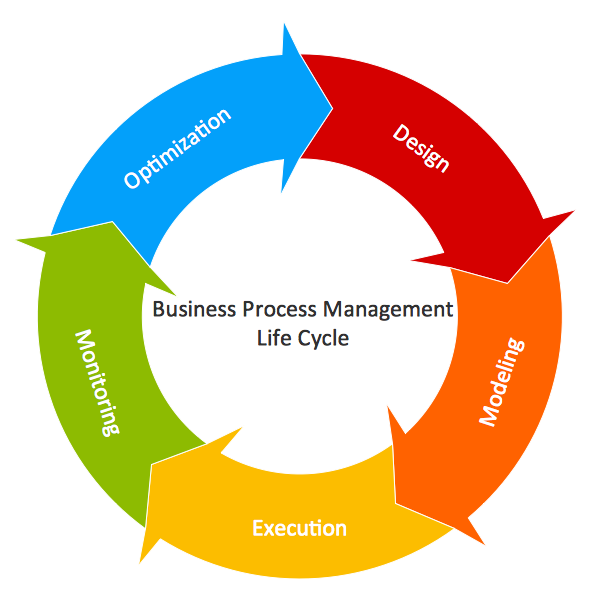
Picture: Circular Arrow
Related Solution:
UML Package Diagram illustrates the functionality of a software system.
ConceptDraw has 393 vector stencils in the 13 libraries that helps you to start using software for designing your own UML Diagrams. You can use the appropriate stencils of UML notation from UML Package library.
Picture: UML Package Diagram. Design Elements
Related Solution:
Collaborating with co-workers is very important, not only in order to get things done effectively, but also to keep in touch with the outside world. Great way for business collaboration is Skype.
Picture: Online Collaboration via Skype
Related Solution:
Triangle diagram example of DIKW pyramid has 4 levels: data, information, knowledge and wisdom.
Picture: Pyramid Diagram
Related Solutions:
How to create Social Media Marketing Infographic? It’s very easy! All that you need is a powerful marketing infographics software. Never before creation of Social Media Marketing Infographic wasn’t so easy as now with tools of Marketing Infographics Solution from the Business Infographics Area for ConceptDraw Solution Park.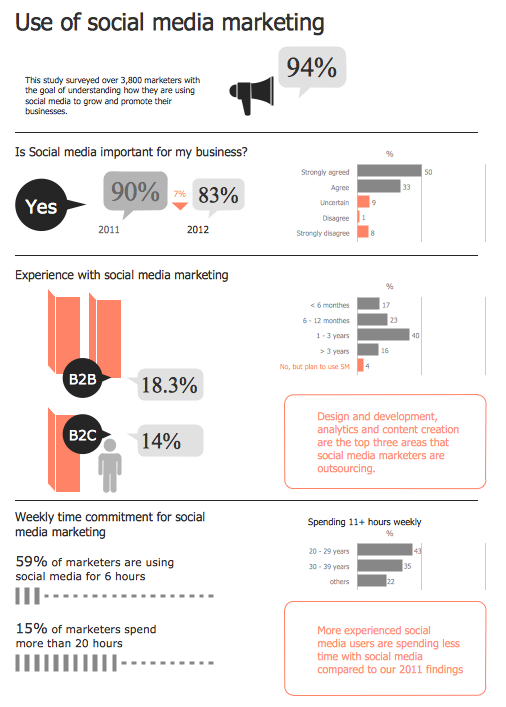
Picture: Social Media Marketing Infographic
Related Solution:
ConceptDraw DIAGRAM is a best business processes modeling software for graphical documenting processes of the company.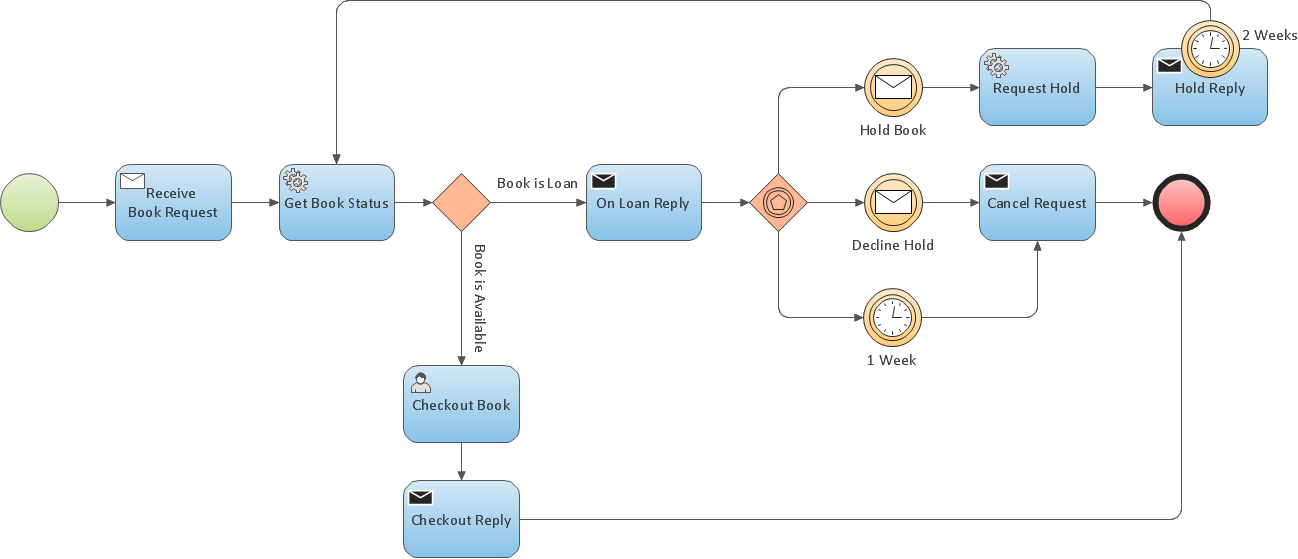
Picture: Business Process Modeling Resume


