
Sample 2. Basic flowchart symbols — Template
This template explains the basic flow chart symbols.
ConceptDraw DIAGRAM diagramming and vector graphics software provides templates, enhanced flowchart maker, samples and libraries of flowchart stencils, organizational chart elements, other type diagrams, and illustrations.
See also Samples:
TEN RELATED HOW TO's:
ConceptDraw gives the ability to draw Flowchart documents. Flowcharts solutionis a powerful tool that extends ConceptDraw application for drawing business flowcharts.
ConceptDraw DIAGRAM vector diagramming and business graphics software enhanced with with templates, green and interactive flowchart makers, samples and stencil libraries from ConceptDraw Solution Park which all focused to help with drawing flowcharts, block diagrams, bar charts, histograms, pie charts, divided bar diagrams, line graphs, area charts, scatter plots, circular arrows diagrams, Venn diagrams, bubble diagrams, concept maps, and others.
Picture: The Best Flowchart Software Available
Related Solution:
Don't let your first glance fool you. ConceptDraw is a lot easier to use than it looks. Use its cross-functional templates and library as basics to get started.
All you need to know are a few basic steps and terms.
ConceptDraw Arrows10 Technology is a new age in drawing software. Use it for process flows and its new rapid draw feature enables to draw an impressive charts in a seconds.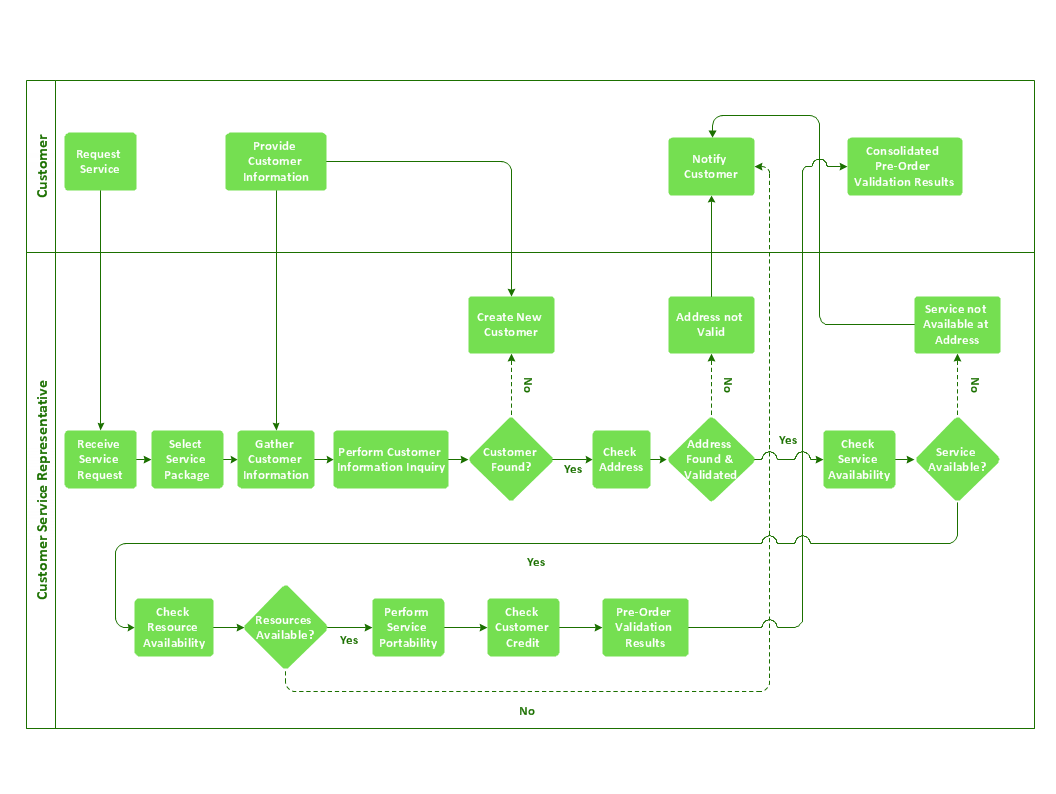
Picture: Cross-Functional Flowchart Basics
ConceptDraw DIAGRAM is a Mac OS X and Windows software. Numerous vector stencils, samples and templates created by designers are included in the basic package. This is classic flowchart maker which exactly follows the industry standards using flowchart symbols geathered during a ten years into solution park.
Picture: Flowchart Software
Related Solution:
Using mind mapping in education is very popular way to make your lecture materials more structural and clear both for you and for students. At remote learning session your students also can make notes or type questions to the current slides without interrupting slide show.
Picture: Presentations in Educational Process
Related Solution:
ConceptDraw DIAGRAM enhanced with Flowcharts Solution is the best flow chart maker online design software. Use it to ✔️ create clear and actionable Flowcharts, ✔️ improve decision-making, ✔️ enhance problem-solving in various scenarios, ✔️ enhance creativity and productivity across industries, ✔️ streamline workflows
Picture: Flow Chart Online
Related Solution:
IT world is extremely rational and logical. So what can be more precise than Software Diagrams to rate the results of work? Visual statistics is the best way to understand the data.
This figure demonstrates the data flow diagram (DFD), which was created to describe the electronic system of custom purchase. This is the process of buying using electronic bar code scanning system. Such systems are used in large stores. The cashier scans the bar code, the system outputs the data on the price of the goods and carries out a purchase process. This DFD utilizes the Gane/Sarson notation. To create it The ConceptDraw DFD solution has been applied.
Picture: Software Diagrams
Event-Driven Process chain Diagrams for improvement throughout an organisation.
ConceptDraw DIAGRAM - software that reduces the time needed to create a business process model.
Picture: Modelling Concepts for Business Engineering - EPC
Related Solution:
The Total Quality Management Diagram solution helps your organization visualize business and industrial processes. Create Total Quality Management diagrams for business process with ConceptDraw software.
Picture: Probability Quality Control Tools
Related Solution:
Both Crow’s Foot and Chen’s notations are used to build database models. Each of them has its’ own features, and if you use a proper entity relationship diagram software, you’ll be able to create diagrams of any notation. Database model with clearly defined entities and relationships between them facilitates further work greatly.
This ERD represents the model of Employee Certification Entity. The entity-relationship diagram is a visual instrument of database software development. It is used to structure data and to define the relationships between structured data groups. This ERD was designed with a help of ConceptDraw Entity-Relationship Diagram (ERD) solution. The solution supports the both basic ERD notations used to describe the structure of database: Chen's and Crow’s Foot notations.
Picture: Entity Relationship Software
Related Solution:
Do you like the professional schemes that you can find on the Internet? Take into account that the most part of them is made using the Best Flowchart Software and Flowchart Symbols. Try you own powers in creating such diagrams!
Flowcharts are the most business diagramming tool. If you are a business manager, you can use flow chart to depict work flow in your organization, develop the effective organizational structure and present the information to investors or other stakeholders. Combining the smart management solutions with ConceptDraw DIAGRAM diagramming engine delivers the set of comprehensive flowchart tools necessary to support professionals in their creativeness and business activity.
Picture: Best Flowchart Software and Flowchart Symbols
Related Solution:
