UML Use Case Diagram Example - Estate Agency
This sample was created in ConceptDraw DIAGRAM diagramming and vector drawing software using the UML Use Case Diagram library of the Rapid UML Solution from the Software Development area of ConceptDraw Solution Park.
This sample shows the work of the estate agency and is used by the estate agencies, building companies, at the trainings of the estate agencies, for understanding the working processes of the estate agencies.
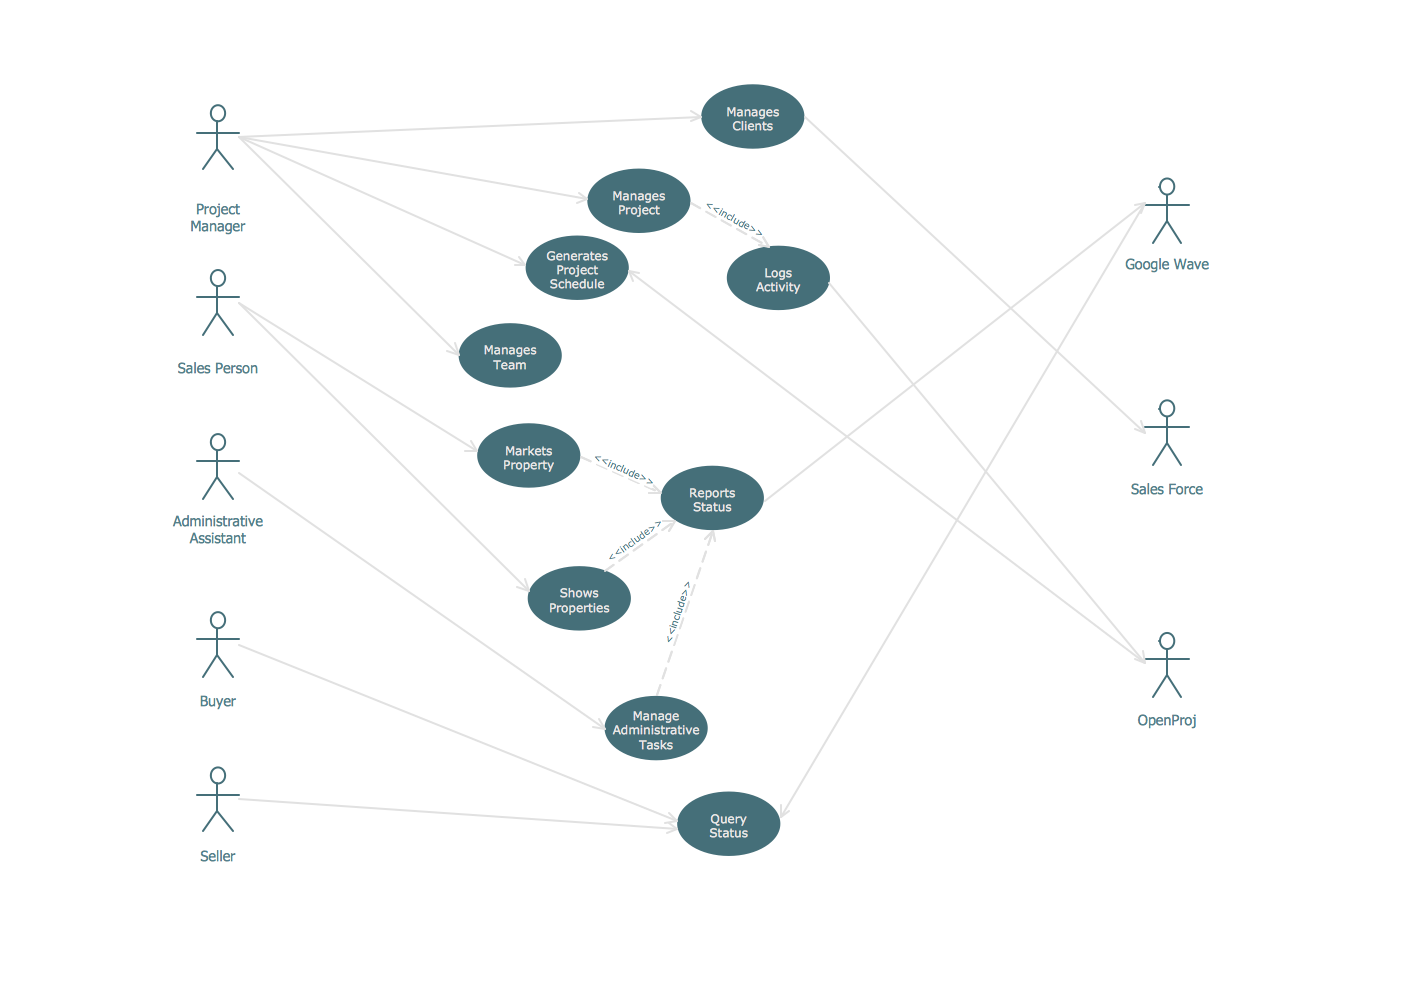
Example 1. UML Diagram Estate Agency
Using the libraries of the Rapid UML Solution for ConceptDraw DIAGRAM you can create your own visual vector UML diagrams quick and easy.
UML Resource:
- UML Software
- How to create a UML Diagram
- UML Diagram Examples
- Class Diagram
- Use Case Diagram
- Timing Diagram
- Interaction Overview Diagram
- Communication Diagram
- State Machine Diagram
- Activity Diagram
- Deployment Diagram
- Package Diagram
- Collaboration Diagram
- Object Diagram
- Sequence Diagram
- Composite Structure
- Component Diagram
TEN RELATED HOW TO's:
Visual navigation through the stages of a response process helps you locate specific actions to be taken via Action Mind Maps. Use ConceptDraw DIAGRAM and ConceptDraw MINDMAP for organize the process of response for interactions occurring in social media.
Picture: Create Response Charts
Related Solution:
When trying to figure out the nature of the problems occurring within a project, there are many ways to develop such understanding. One of the most common ways to document processes for further improvement is to draw a process flowchart, which depicts the activities of the process arranged in sequential order — this is business process management. ConceptDraw DIAGRAM is business process mapping software with impressive range of productivity features for business process management and classic project management. This business process management software is helpful for many purposes from different payment processes, or manufacturing processes to chemical processes. Business process mapping flowcharts helps clarify the actual workflow of different people engaged in the same process. This samples were made with ConceptDraw DIAGRAM — business process mapping software for flowcharting and used as classic visio alternative because its briefly named "visio for mac" and for windows, this sort of software named the business process management tools.
This flowchart diagram shows a process flow of project management. The diagram that is presented here depicts the project life cycle that is basic for the most of project management methods. Breaking a project into phases allows to track it in the proper manner. Through separation on phases, the total workflow of a project is divided into some foreseeable components, thus making it easier to follow the project status. A project life cycle commonly includes: initiation, definition, design, development and implementation phases. Distinguished method to show parallel and interdependent processes, as well as project life cycle relationships. A flowchart diagram is often used as visual guide to project. For instance, it used by marketing project management software for visualizing stages of marketing activities or as project management workflow tools. Created with ConceptDraw DIAGRAM — business process mapping software which is flowcharting visio alternative or shortly its visio for mac, this sort of software platform often named the business process management tools.
Picture: Process Flowchart: A Step-by-Step Comprehensive Guide
Related Solution:
The vector stencils library from the solution Information Model Diagrams contains specific data type symbols of the EXPRESS-G notation such as entity data type symbols, simple data type symbols, enumeration data type symbols, defined data type symbols, select data type symbols and specific attribute symbols for ConceptDraw DIAGRAM diagramming and vector drawing software. The Information Model Diagrams solution is contained in the Software Development area of ConceptDraw Solution Park.
Picture: Express-G Diagram
While creating flowcharts and process flow diagrams, you should use special objects to define different statements, so anyone aware of flowcharts can get your scheme right. There is a short and an extended list of basic flowchart symbols and their meaning. Basic flowchart symbols include terminator objects, rectangles for describing steps of a process, diamonds representing appearing conditions and questions and parallelograms to show incoming data.
This diagram gives a general review of the standard symbols that are used when creating flowcharts and process flow diagrams. The practice of using a set of standard flowchart symbols was admitted in order to make flowcharts and other process flow diagrams created by any person properly understandable by other people. The flowchart symbols depict different kinds of actions and phases in a process. The sequence of the actions, and the relationships between them are shown by special lines and arrows. There are a large number of flowchart symbols. Which of them can be used in the particular diagram depends on its type. For instance, some symbols used in data flow diagrams usually are not used in the process flowcharts. Business process system use exactly these flowchart symbols.
Picture: Flowchart Symbols: Meaning and Examples
Related Solution:
The entity–relationship (ER) model is a data model that lets graphically represent the information system and depict the relationships between people, objects, concepts, places, and events within a given system. It is also convenient to use the ER Diagram for Cloud computing representation and description the Cloud computing architecture, design them with pleasure using the extensive tools of the Cloud Computing Diagrams solution from the Computers and Network area of ConceptDraw Solution Park.
Picture: ER Diagram for Cloud Computing
Related Solution:
ConceptDraw DIAGRAM is a world-class diagramming platform that lets you display, communicate, and present dynamically. It′s powerful enough to draw everything from basic flowcharts to complex engineering schematics.
Video tutorials on ConceptDraw products. Try it today!
Picture: Business Process Mapping — How to Map a Work Process
Related Solutions:
The Flowcharts are widely used in engineering, architecture, science, analytics, government, politics, business, marketing, manufacturing, administration, etc.
Picture:
Flowchart of Products
Flowchart ExamplesRelated Solution:
Entity Relationship Diagram (ERD) is the world-known way to show the logical structure of databases in visual manner. The best software tool for drawing Entity-Relationship Diagram is ConceptDraw DIAGRAM vector graphics software with Entity-Relationship Diagram (ERD) solution from Software Development area which gives the ability to describe a database using the Entity-Relationship model. The vector graphic diagrams produced using this solution can be successfully used in whitepapers, presentations, datasheets, posters, or any technical materials.
Picture: Entity-Relationship Diagram
Related Solution:
UML state machine's goal is to overcome the main limitations of traditional finite-state machines while retaining their main benefits.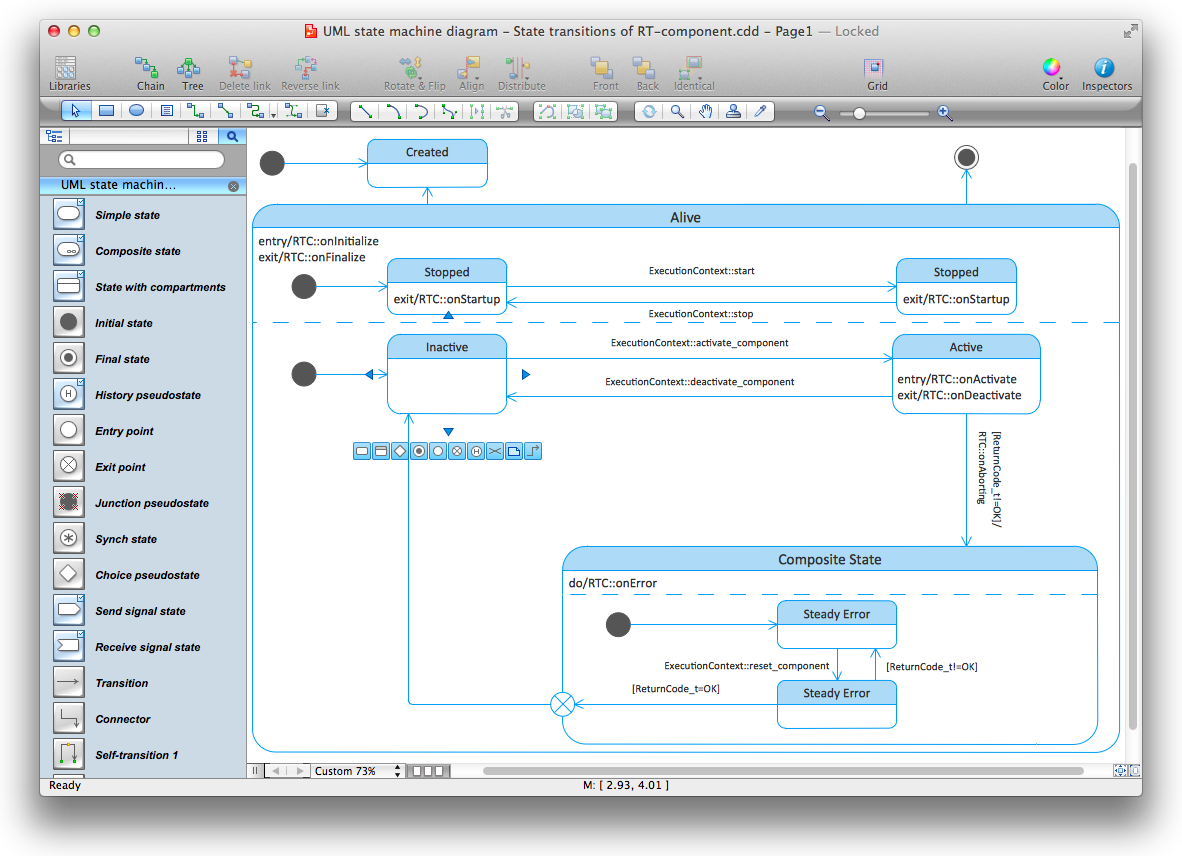
Picture: Diagramming Software for Design UML State Machine Diagrams
There are many ways to define the flow of information within a system. Structured-systems analysis method often uses data flow diagrams to show data flow, data storages and data processing visualization. These diagrams are easy to develop and quite useful.
Here is a dataflow diagram presenting an example of the manufacturing process flow. The oval process shapes represent a process that controls data within the current system. The process may produce data or make some action based on data. Data flows are represented by lines. They show the movement of information through the system. The direction of the data flow is depicted by the arrow. The external entities are shown by rectangles. They represent the external entities interacting with the system. The data store objects (unclosed rectangles) are used to show data bases participating in a process flow.
Picture: Data Flow Diagram
Related Solution:
ConceptDraw
DIAGRAM 18