UML Package Diagram. Design Elements
UML Package Diagram is a type of Structure Diagrams that represents the packages of the model and dependencies between them.
Package Diagrams are used to illustrate the layered architecture of a software system. The packages depict the different layers of a software system. To indicate the types of dependencies between the packages are used the stereotypes.
There are two special types of dependencies between the packages in UML: package import and package merge.
To design UML Package Diagrams use the following shape types:
- Package – it is the mechanism indispensable for organizing the elements and diagrams into the groups.
- Class - it is a description of logical structure of the system, its objects and their behavior in the system.
- Interface - it is a specification of the behavior.
- Object - it is an instance of class, and others.
UML Package Diagrams are very useful for working with large systems, because they allow to clearly view all the dependencies between the elements of these systems.
The Rapid UML Solution for ConceptDraw DIAGRAM contains 13 vector stencils libraries with 393 interactive shapes that you can use to design your UML diagrams.
To design a Package Diagram use the UML Package Diagram library.
UML Package Diagram library contains 23 shapes:
- Package
- Part
- Class 2
- Content
- Actor
- Import
- Dependency
- Note
- Interaction
- Access
- Constraint
- Generalization
- Merge
- Realization
- Class 1
- Model
- Activity
- Line connector
- Smart connector
- Request
- Content connector
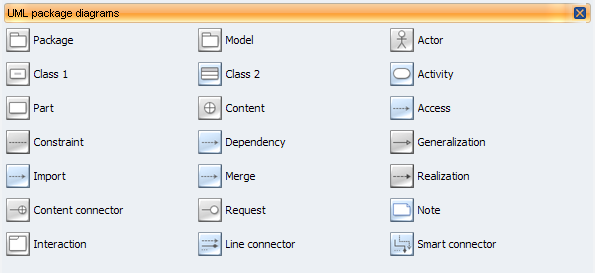
Pic.1. UML Package Diagram Library

Pic.2. UML Package Diagram Library Elements
ConceptDraw Rapid UML solution provides UML Package Diagram library of vector stencils for drawing the package diagrams using package blocks and assembly connectors.
All libraries for creating UML diagrams are available inside the ConceptDraw DIAGRAM Templates and samples are located in the Rapid UML section of ConceptDraw STORE.

Pic.3. UML Diagrams solution
Use design element from the UML Component Diagram library to draw your own UML package diagrams of complex systems and software applications.


TEN RELATED HOW TO's:
ConceptDraw DIAGRAM extended with IDEF Business Process Diagrams solution from the Business Processes area of ConceptDraw Solution Park is an ideal software for effective database design and drawing IDEF diagrams visually representing all steps of database design process.
Picture: Database Design
Related Solution:
ConceptDraw DIAGRAM diagramming and vector drawing software extended with Rapid UML Solution from the Software Development Area is a powerful UML Class diagram tool.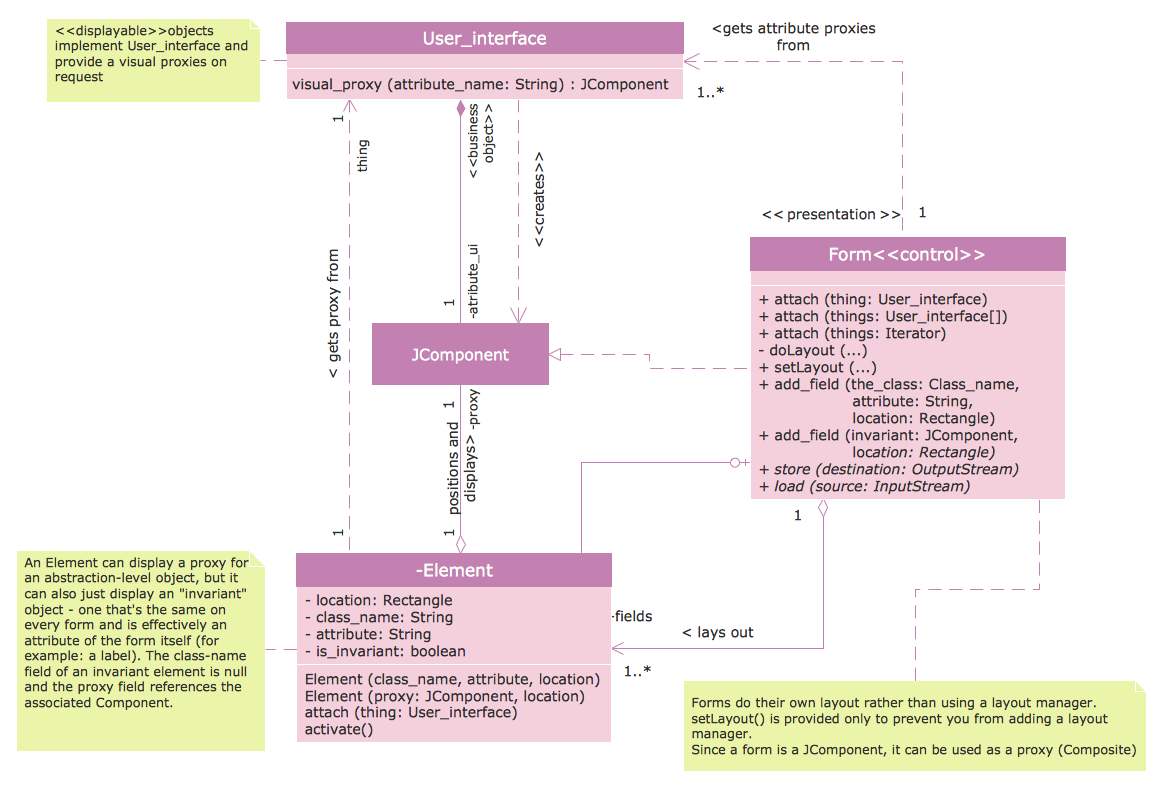
Picture: Class Diagram Tool
Related Solution:
SWOT Analysis solution extends ConceptDraw MINDMAP and ConceptDraw DIAGRAM products with easy-to-use SWOT Analysis tools.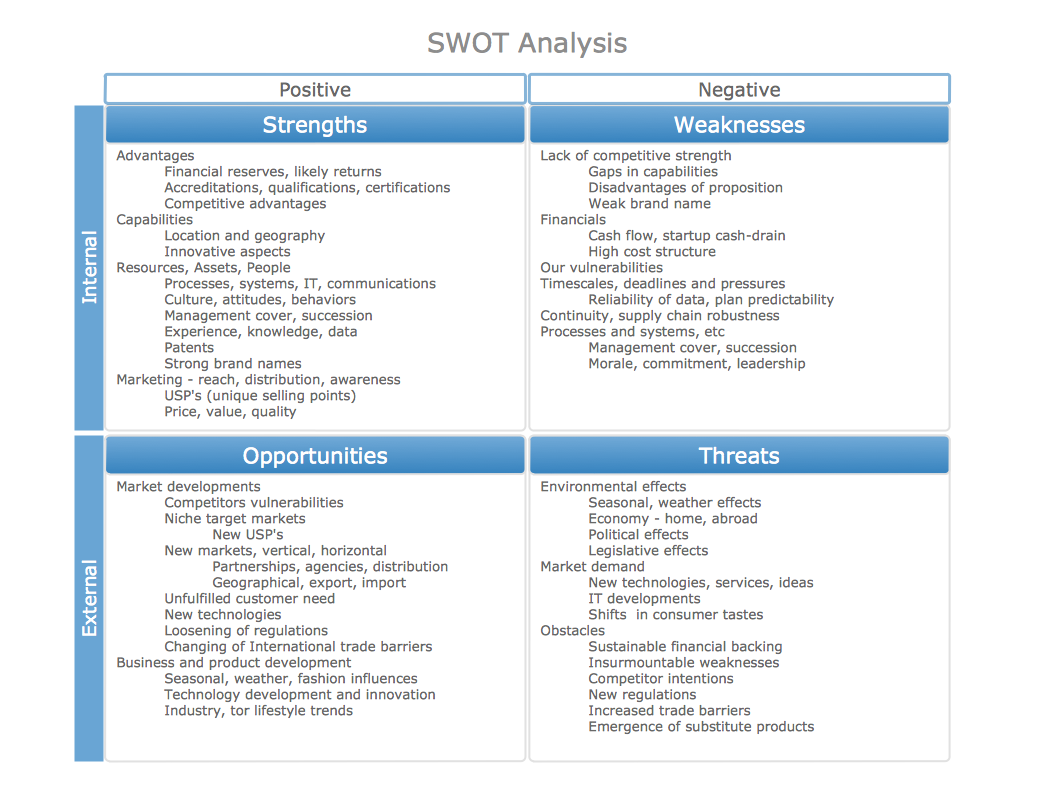
Picture: SWOT Analysis matrix templates and samples
ConceptDraw DIAGRAM es una conocida y popular aplicación de gráficos de negocios y diagramas para Windows y Macintosh. Contiene potentes herramientas de dibujo vectorial, bibliotecas de gráficos con cientos de formas pre-dibujados, soporte para importación y exportación de numerosos formatos de archivos y muchas otras características profesionales.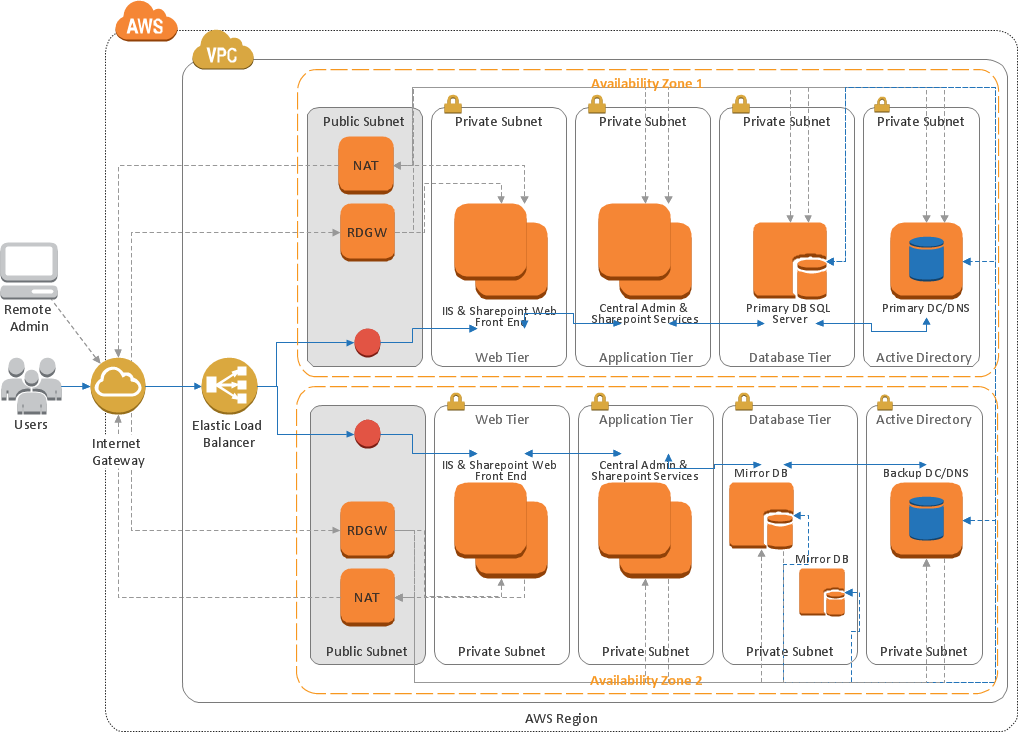
Picture: Creando Diagramas
Working with information can be quite tedious, furthermore, some data can be quite difficult to perceive without any graphic representation. So, to facilitate your work, you can use business diagrams, such as simple flowcharts or Gantt charts for project management and orgcharts for clarifying your company structure. You can use a proper software, like ConceptDraw Pro, draw them on paper, or use whiteboards, but it is more convenient to use a digital tool.
This diagram shows a cross-functional flowchart that was made fore telecom service provider. A workflow of a common telecommunication service provider has a rather branched structure. Thus, it is useful to have a flow chart to visualize the sequences and interrelations of the work flow steps. Business process flowchart contains 17 processes and 4 decision points,that are distributed through 2 lines depicting the participants involved. Also there are connectors that show the data flow within processes. This flowchart displays a detailed model of the telecom service trading process, as well as all participants in the process and how they interact with each other.
Picture: Business diagrams & Org Charts with ConceptDraw DIAGRAM
Any bar chart can be also called as a bar graph or a column chart or graph. Being a chart or a graph that is commonly used for presenting some categorical data with the rectangular bars having their lengths or heights proportional to the values that they represent, such drawings can be made with the help of the ConceptDraw DIAGRAM diagramming and drawing software. The created bars can be plotted either vertically or horizontally and any vertical bar chart can be also sometimes called as a line graph.
Picture: Column Chart Template
Related Solution:
This sample shows the UML Activity Diagram that describes the flow of controls in the system. This is preparation to see how the system will work when executed. Black circle indicates the start of the workflow, encircled black circle indicates the end of the workflow. This sample shows the decision of the problem and can be used when you need to solve some set of problems.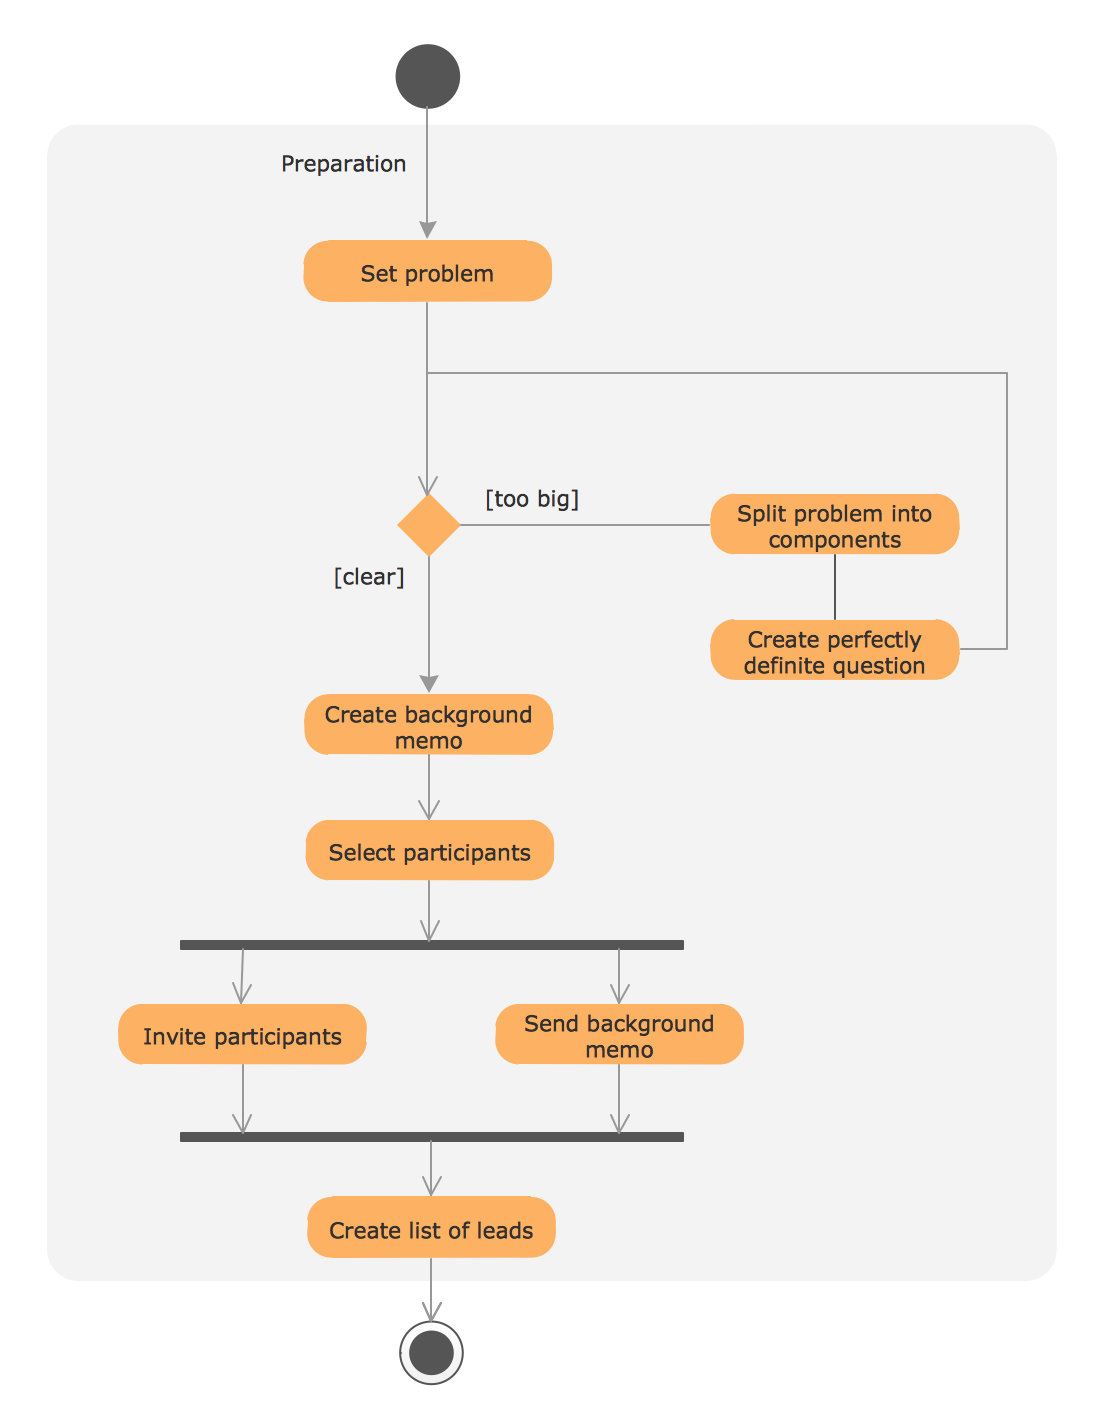
Picture: UML Process Diagram Example
Related Solution:
Semiconductors are crystalline or amorphous solids with distinct electrical characteristics. They are of high resistance — higher than typical resistance materials, but still of much lower resistance than insulators. Their resistance decreases as their temperature increases, which is behavior opposite to that of a metal. Finally, their conducting properties may be altered in useful ways by the deliberate, controlled introduction of impurities into the crystal structure, which lowers its resistance but also permits the creation of semiconductor junctions between differently-doped regions of the extrinsic semiconductor crystal. The behavior of charge carriers which include electrons, ions and electron holes at these junctions is the basis of diodes, transistors and all modern electronics.
26 libraries of the Electrical Engineering Solution of ConceptDraw DIAGRAM make your electrical diagramming simple, efficient, and effective. You can simply and quickly drop the ready-to-use objects from libraries into your document to create the electrical diagram.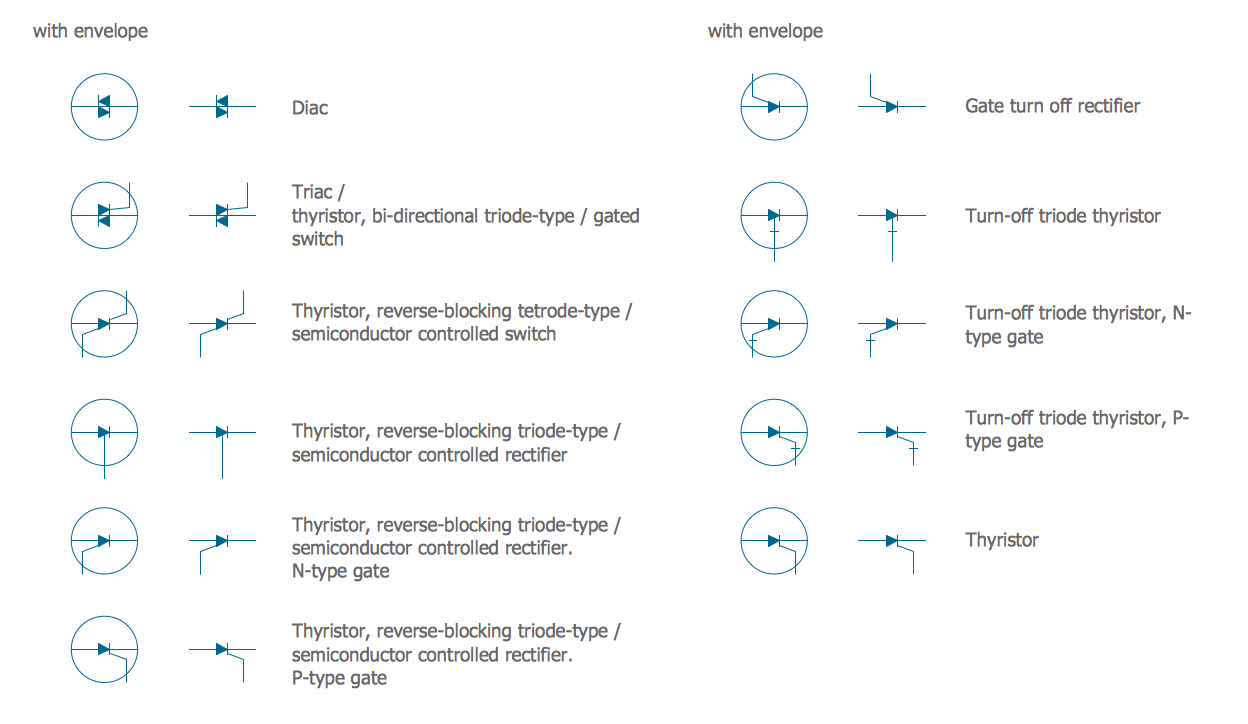
Picture: Electrical Symbols — Semiconductor
Related Solution:
One of the three main constituents of any enterprise is the Control and Information Architecture. The rest two are Production facilities and People and Organization.
Picture: Control and Information Architecture Diagrams (CIAD) with ConceptDraw DIAGRAM
The AWS Architecture Diagrams solution includes icons, sample and templates for several Amazon Web Services products and resources, to be used when creating architecture diagrams. The icons are designed to be simple so that you can easily incorporate them in your diagrams and put them in your whitepapers, presentations, datasheets, posters or any technical material you like.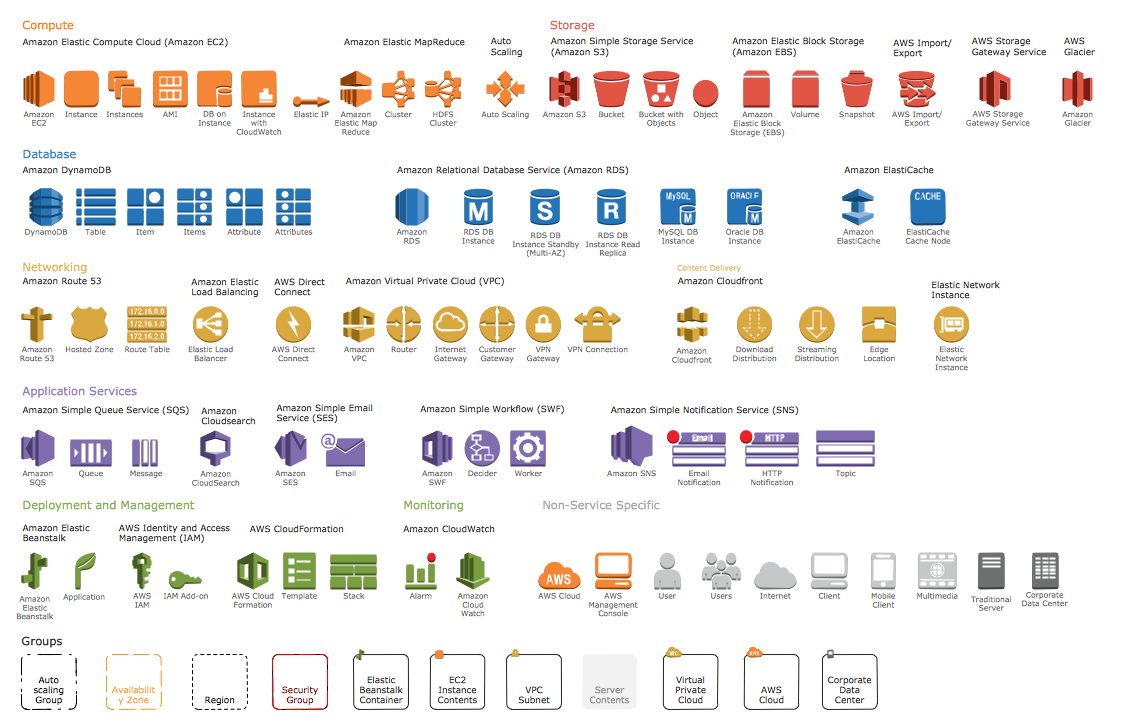
Picture: AWS Simple Icons for Architecture Diagrams


