Made with
ConceptDraw
DIAGRAM 18

UML Component Diagram. Design Elements

UML Component Diagram is a type of Structure Diagrams that shows how components are connected to larger components or software systems, and shows the dependencies among these components.

Component-based development supposes that constructed components can be reused and replaced by some other components.

Components in UML can represent logical components and physical components. The behavior of components is defined in the terms of provided interfaces and required.

There are two types of connectors linking components: assembly connectors and delegation connectors.

Assembly connector is a connector between two components that allows to connect the required interface of one component with the provided interface of another component. Thus the assembly connector is described that one component provides the services that another component requires.

A delegation connector is a connector that describes how a component realizes the specification of behavior. When a delegation connector is assigned, the signals that arrive at the port will be delegated on the internal part. To communicate with external part it is necessary to delegate signals from the internal part to a port using the delegation connector.

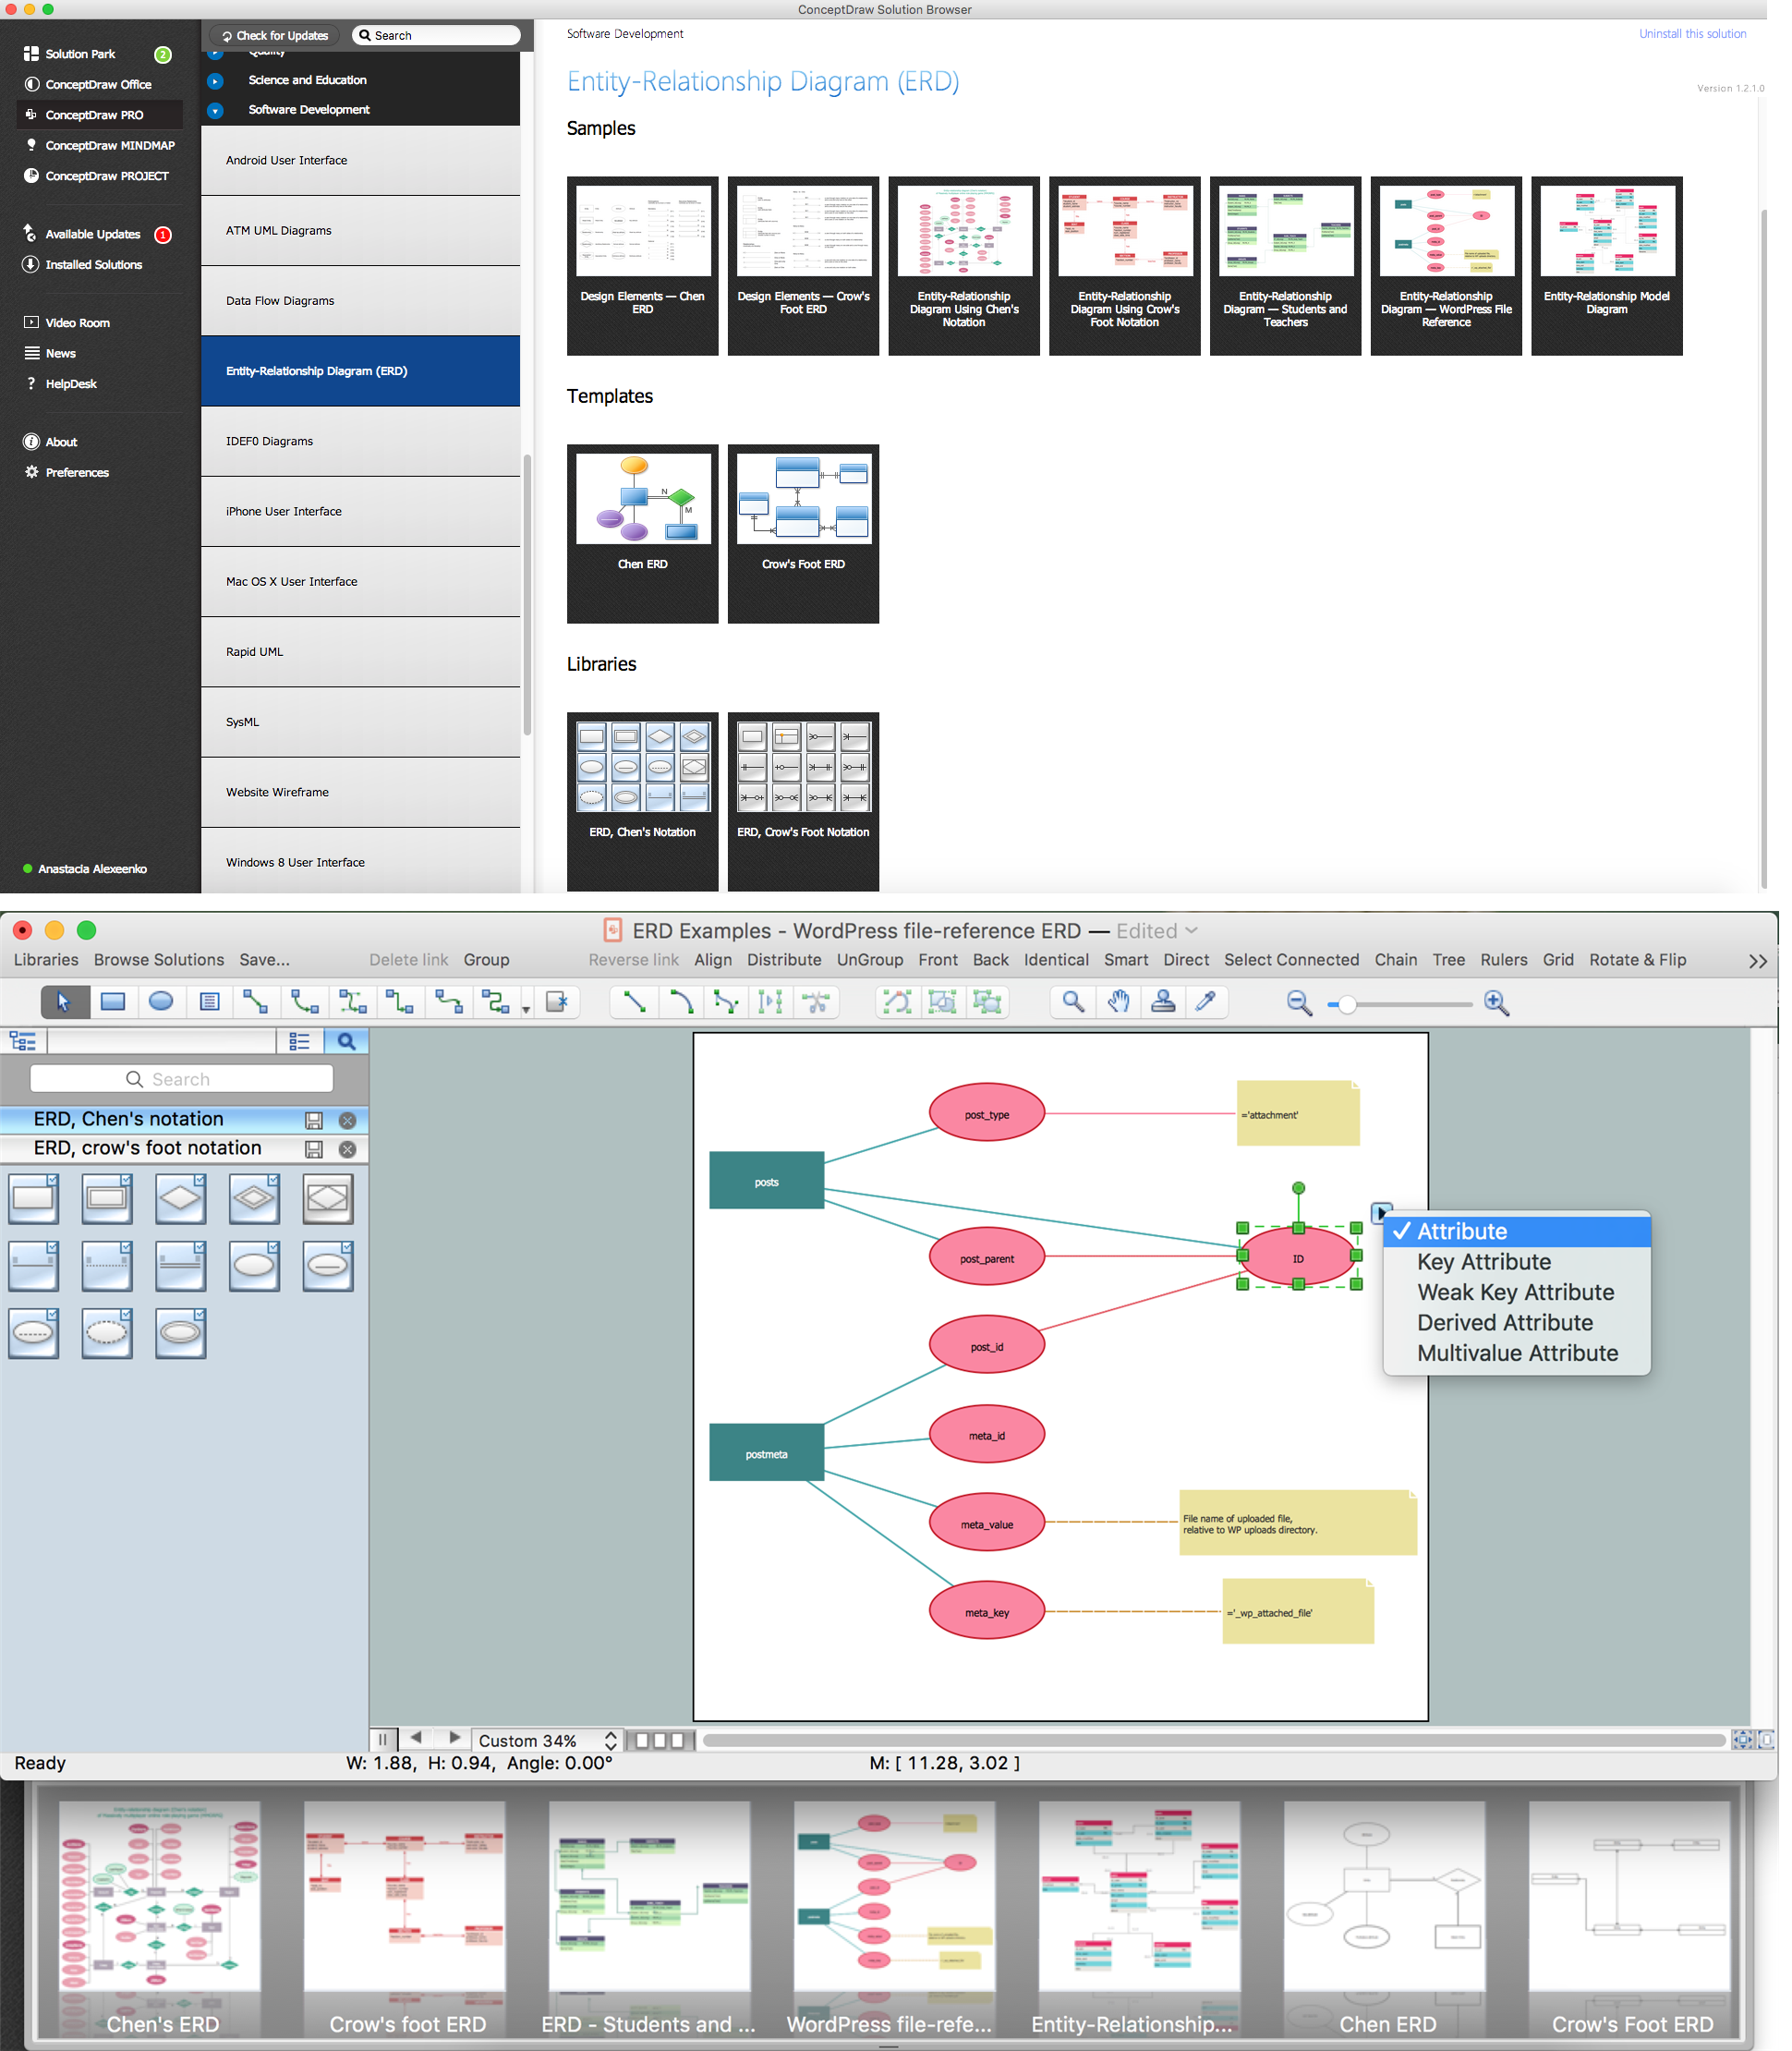
Rapid UML Solution for ConceptDraw DIAGRAM contains 13 vector stencils libraries with 393 interactive shapes that you can use to design your UML diagrams.

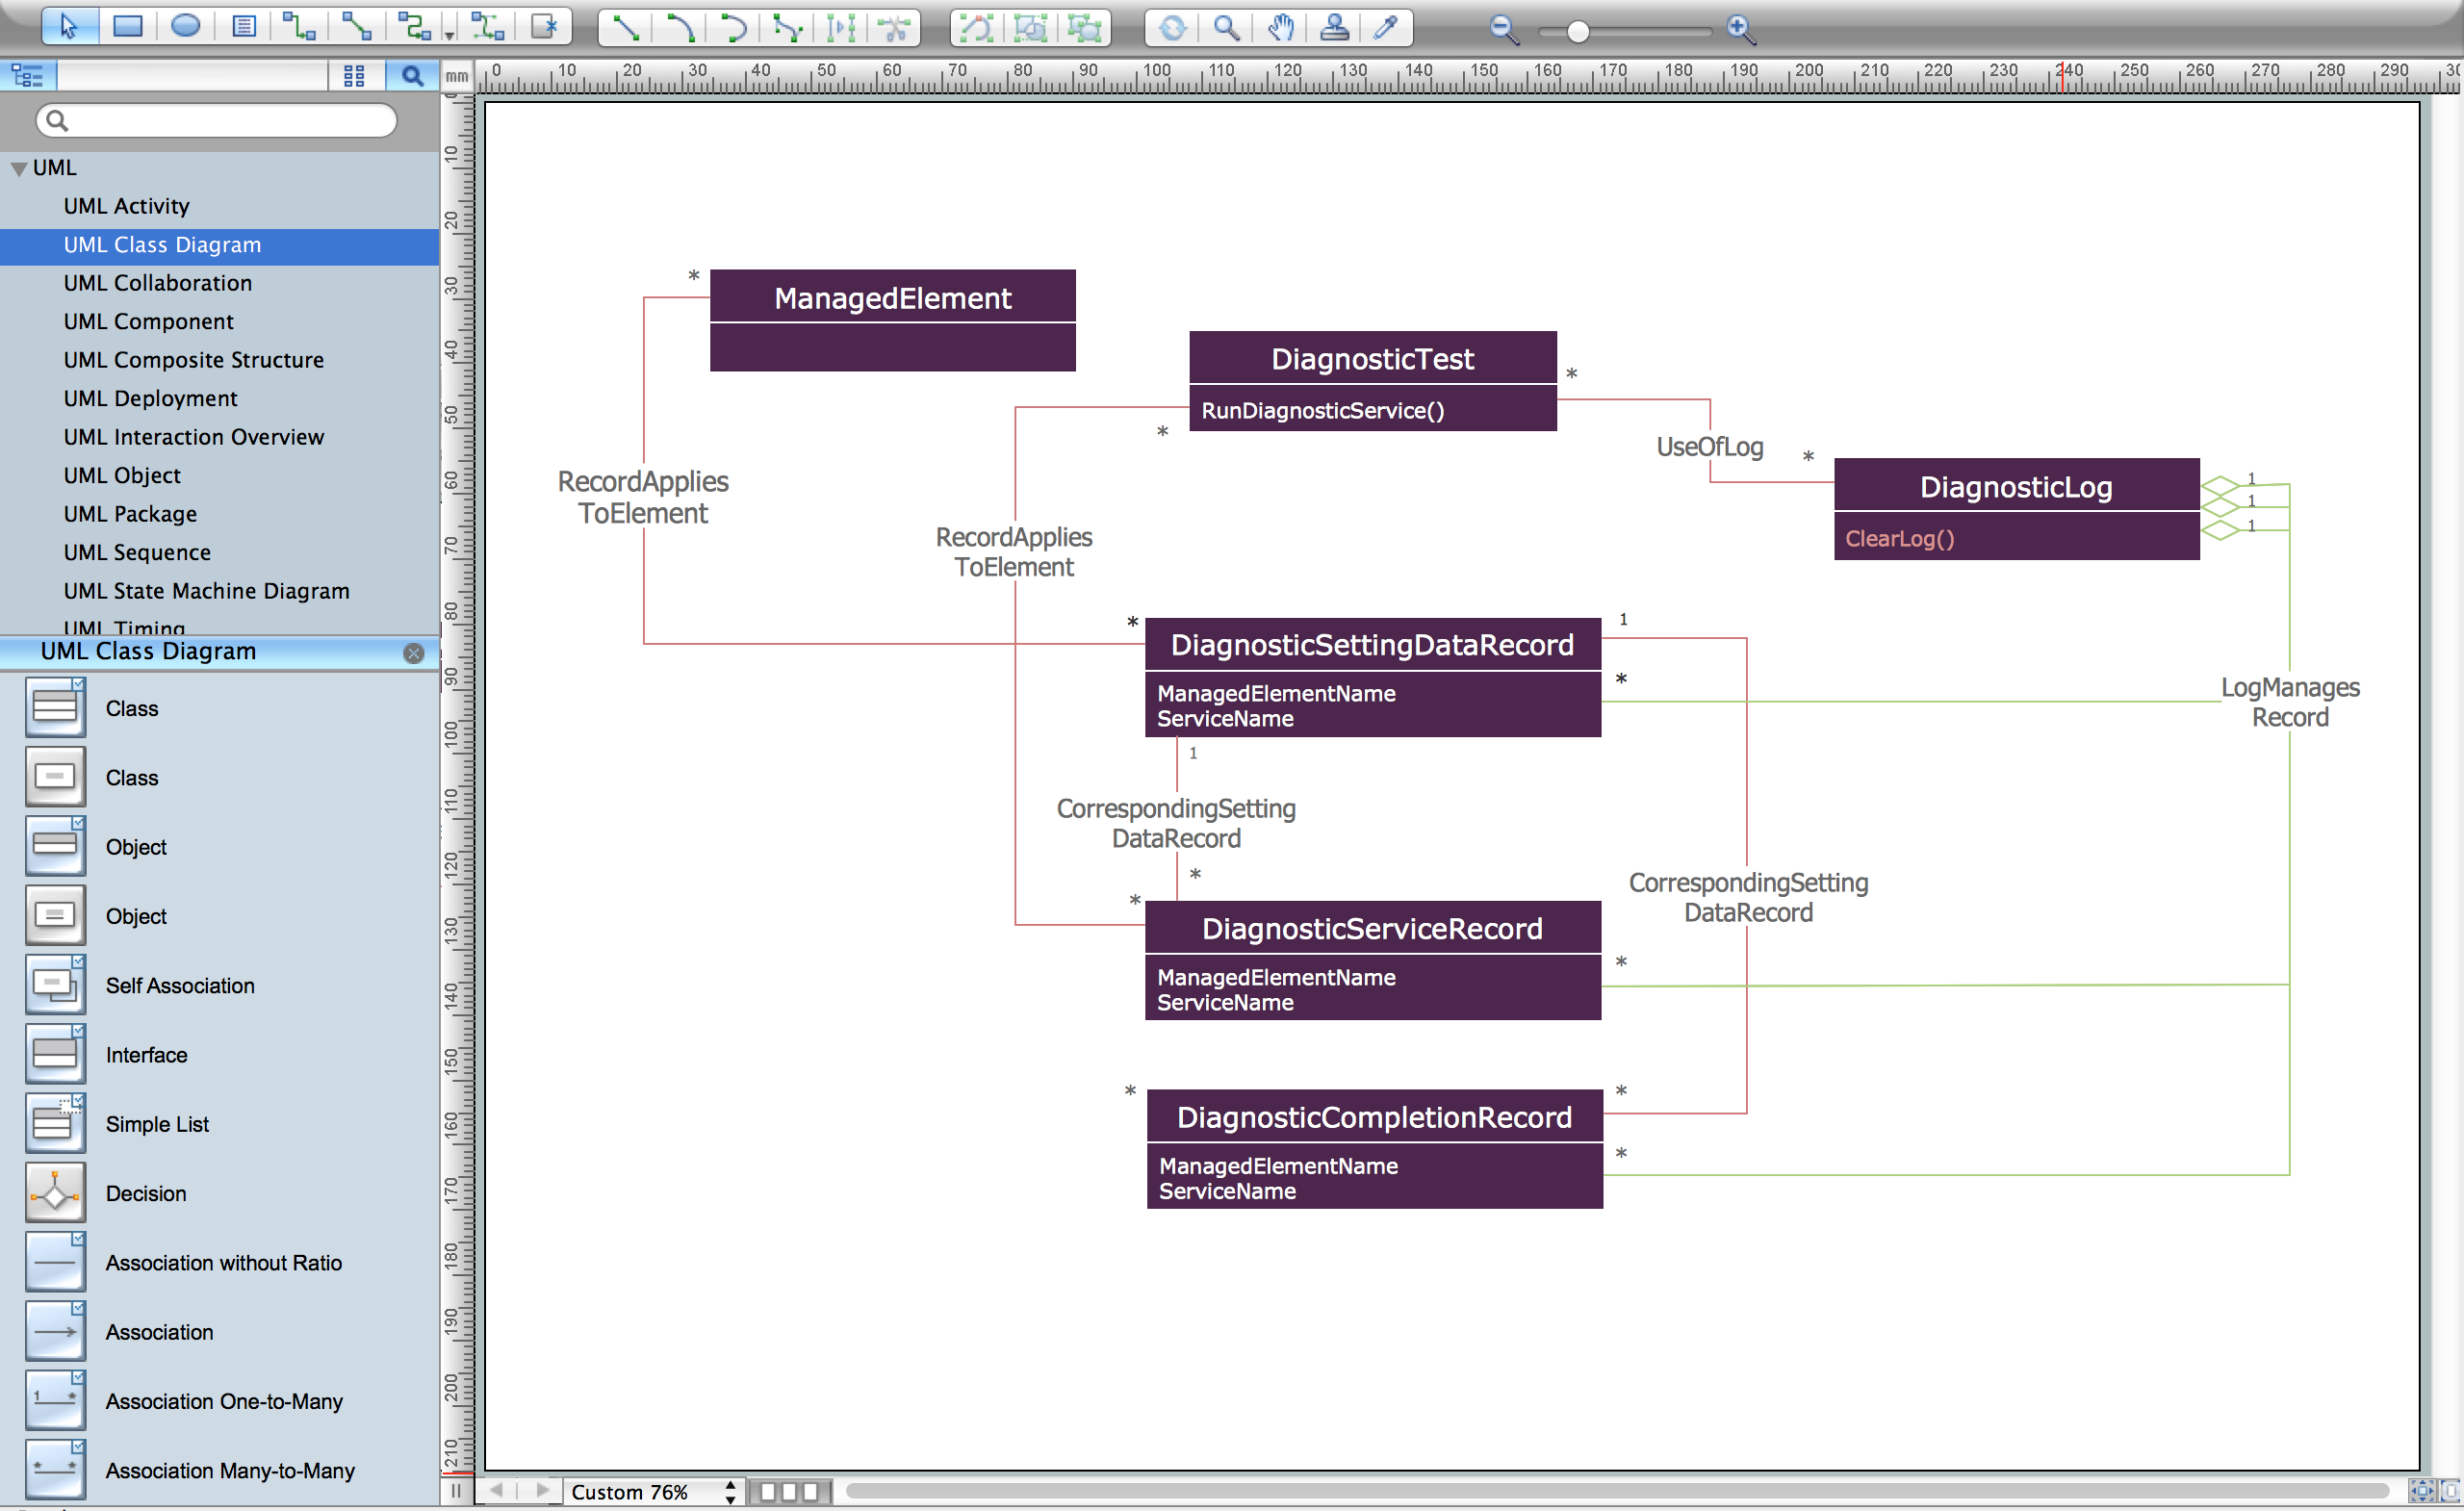
To design a Component Diagram use the UML Component Diagram library.

UML Component Diagram library contains 36 shapes:

  • Component
  • Subsystem
  • List of required and provided interfaces
  • Realization arrow
  • Dependency arrow
  • Delegation connector
  • Aggregation (shared association)
  • Provided interface
  • Required interface
  • Ball and socket notation
  • State divider
  • Symbol
  • Port
  • Fragment
  • Note
  • Interface
  • Instance specification
  • Association
  • Composite association
  • Generalization
  • Realization arrow
  • Link
  • Library component
  • Web-page component
  • Help file
  • Work product
  • Database
  • Required interface
  • UML connector
  • UML connector (Direct)
  • UML connector (opposite direction)
  • Provided interface port
  • Port (with connector)
  • Provided interface (reverse)
UML Component Diagram library

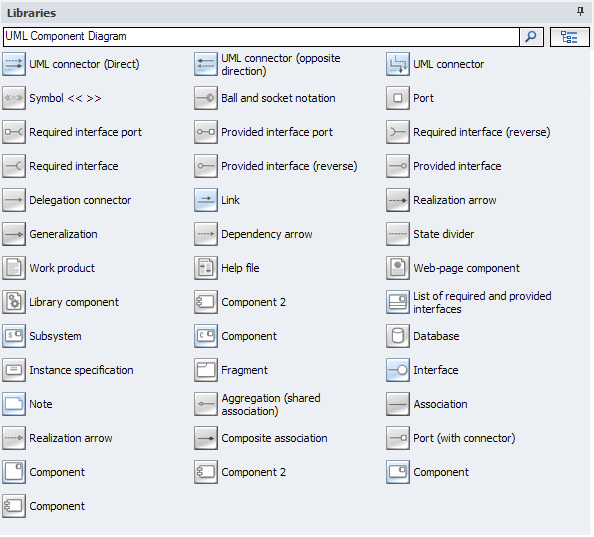
Pic.1. UML Component Diagram Library

UML Component Diagram. Design Elements *

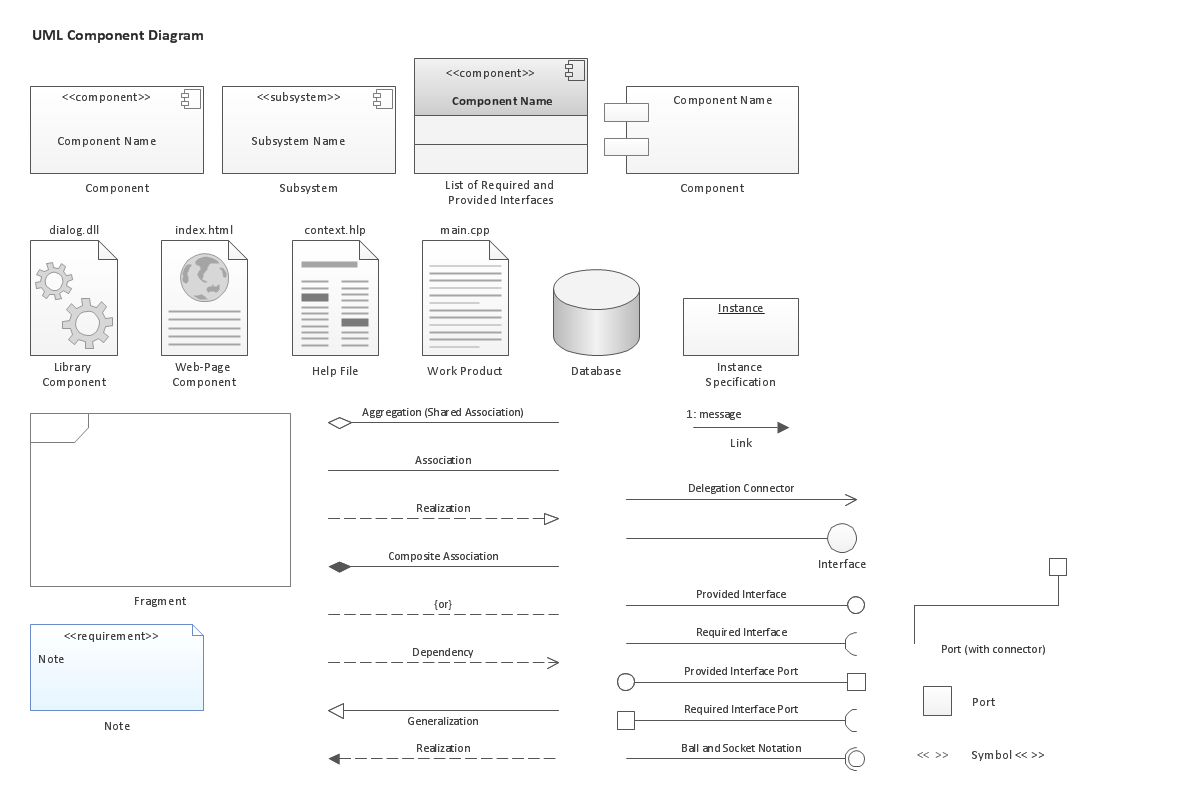
Pic.2. UML Component Diagram Library Elements

ConceptDraw Rapid UML solution provides UML Component Diagram library of vector stencils for drawing the component diagrams using component blocks and assembly connectors.

UML Component diagram solution

Pic.3. UML Component Diagram Solution

Use design element from the UML Component Diagram library to draw your own UML component diagrams of complex systems and software applications.


TEN RELATED HOW TO's:
ConceptDraw DIAGRAM compatible Mac OS X software extended with powerful Entity-Relationship Diagram (ERD) Solution from the Software Development Area for ConceptDraw Solution Park is one of the famous ER Diagram Programs for Mac. It gives the perfect ability to draw ER diagrams for visually describing databases with Chen's and Crow's Foot notation icons.ER Diagram Programs for Mac *
Picture: ER Diagram Programs for Mac
Related Solution:
It is an innovative combination of interactive flow charts and action mind maps to help you boost your social media success.Social Media Response Management Action Maps - software tool *
Picture: Social Media Response Management Action Maps - software tool
Related Solution:
The Stakeholder Onion Diagram is a popular and widely used way to view the relationships of stakeholders to a project goal. The Onion Diagram focuses on the project goal, most of other diagram styles focus on the project, stakeholders, and timeline. This difference favorably distinguishes and separates the Onion Diagram from other types of diagrams. Design fast and easy Stakeholder Onion Diagrams of any complexity in ConceptDraw DIAGRAM diagramming and vector drawing software using the powerful tools of Stakeholder Onion Diagrams Solution from the Management Area of ConceptDraw Solution Park.Stakeholder Onion Diagrams *
Picture: Stakeholder Onion Diagrams
Related Solution:
UML Class Diagrams is a type of static structure diagram that is used both for general conceptual modeling of the systematics of the application, and for detailed modeling translating the models into programming code. It describes the structure of a system by showing the: classes of a system, attributes, operations, and the relationships between them. The Rapid UML Solution for ConceptDraw DIAGRAM includes the UML Class Diagram library that helps you to design the UML Class Diagram quick and easy. You can simply and quickly drop the ready-to-use objects from the library into your document to create the UML Class Diagram.UML Class Diagram Constructor *
Picture: UML Class Diagram Constructor
Related Solution:
While designing a conceptual data model, you should use appropriate software. For instance, ConceptDraw DIAGRAM is a user-friendly ER diagram tool that has a lot of samples and templates to facilitate your work. A clear entity-relationship diagram helps to define the relations between system’s components. Software engineering is the section of a computer science engaged to design, realization, and support of complex software products. An ERD is a data modeling method that is widely applied in the software engineering practice. Commonly it is used for developing a structure of a a relational database. An entity relationship diagram is helpful for structuring and organizing databases that can be modeled using a relational structure. An entity relationship diagram is designed to depicts the interrelationships within the sets of entities which are accumulated in the database. Each entity represents a particular component of a data. Thus, ER diagrams depicts the logical structure of databases. ConceptDraw ER Diagrams solution provides software engineers with the professional tool for making entity-relationship diagrams.Entity Relationship Diagram Software Engineering *
Picture: Entity Relationship Diagram Software Engineering
Related Solution:
If you need to describe some process, diagramming is a perfect tool for almost any imaginable purpose. The set of the most commonly used flow charts symbols is quite wide and includes symbols for operations, processes, data inputs and outputs. You can see the full list of all the symbols used for flowcharting in Flowcharts solution from Diagrams area in ConceptDraw Solution Park. A flow chart is often used for visual representation of a sequential process flow. The flowchart approach to any process is to divide it into some sequential actions. What makes a flow chart so popular and clear to make out is the set of standard flowchart symbols that has the same reading independently from processes described with their applying. The current drawing represents the vector library containing the pack of standard flowchart symbols. This library is supplied with ConceptDraw Flowcharts solution.Flow Chart Symbols
Picture: Flow Chart Symbols
Related Solution:
Use the Basic Diagramming Solution from the Universal Diagramming area of ConceptDraw Solution Park to easy create simple forms, questionnaires, survey forms, registration and application forms, etc.Form Maker *
Picture: Form Maker
Related Solution:
The Audio and Video Connectors solution contains a set of video connectors, audio connectors and s video connection; you will also find pre-designed objects, libraries, templates, and samples, allowing quick and easy diagramming of various configurations of audio and video devices.Audio and Video Connections Explained *
Picture: Audio and Video Connections Explained
Related Solution:
Database design is an important part of any project, as databases become more and more complex nowadays. To make the model more representative, entity relationship diagrams are widely used in software engineering area. These diagrams show sets of entities as rectangles connected via lines labeled with their cardinalities. This an example of the ER-diagram developed to store information regarding some online role-playing game. It includes three main elements of ER diagram: entities, relationships and attributes. The entities, attributes and relationships on this ER-diagram is depicted according to the Chen's notation. Chen's notation for Entity Relationship diagrams admits using of rectangles to depict entities, ovals for attributes and ,at least, diamonds to show relationships. ConceptDraw Entity-Relationship Diagrams solution was applied as ERD software to create this diagram.ConceptDraw DIAGRAM ER Diagram Tool *
Picture: ConceptDraw DIAGRAM ER Diagram Tool
Related Solution:
What's the best ERD tool for the Mac? ConceptDraw DIAGRAM on Mac OS X supplied with Entity-Relationship Diagram (ERD) Solution from the Software Development Area for ConceptDraw Solution Park is the best ERD tool! This solution offers for ConceptDraw users so powerful drawing tools, libraries with numerous ERD objects, which will help design ER diagrams of any complexity and any design you want.What
Picture: What's the best ERD tool for the Mac?
Related Solution:
ConceptDraw
DIAGRAM 18