Technical Drawing Software
Technical Drawing SoftwareScience and technology rapidly develop in the modern world. Electronic devices, computers and various software are very popular now. The technical drawing software is already necessity today. ConceptDraw DIAGRAM is new software for business and technical drawing. It offers a powerful tools for all kinds of technical drawing with pre-drawn shapes, free samples of business drawings and flowcharts, support for many graphic formats enables users to visually develop their technical drawings charts, schematics and diagrams in any combination of drawings, diagrams and flow charts. Thanks to the Mechanical Engineering solution from the Engineering area of ConceptDraw Solution Park became possible to draw fast and easy:
|

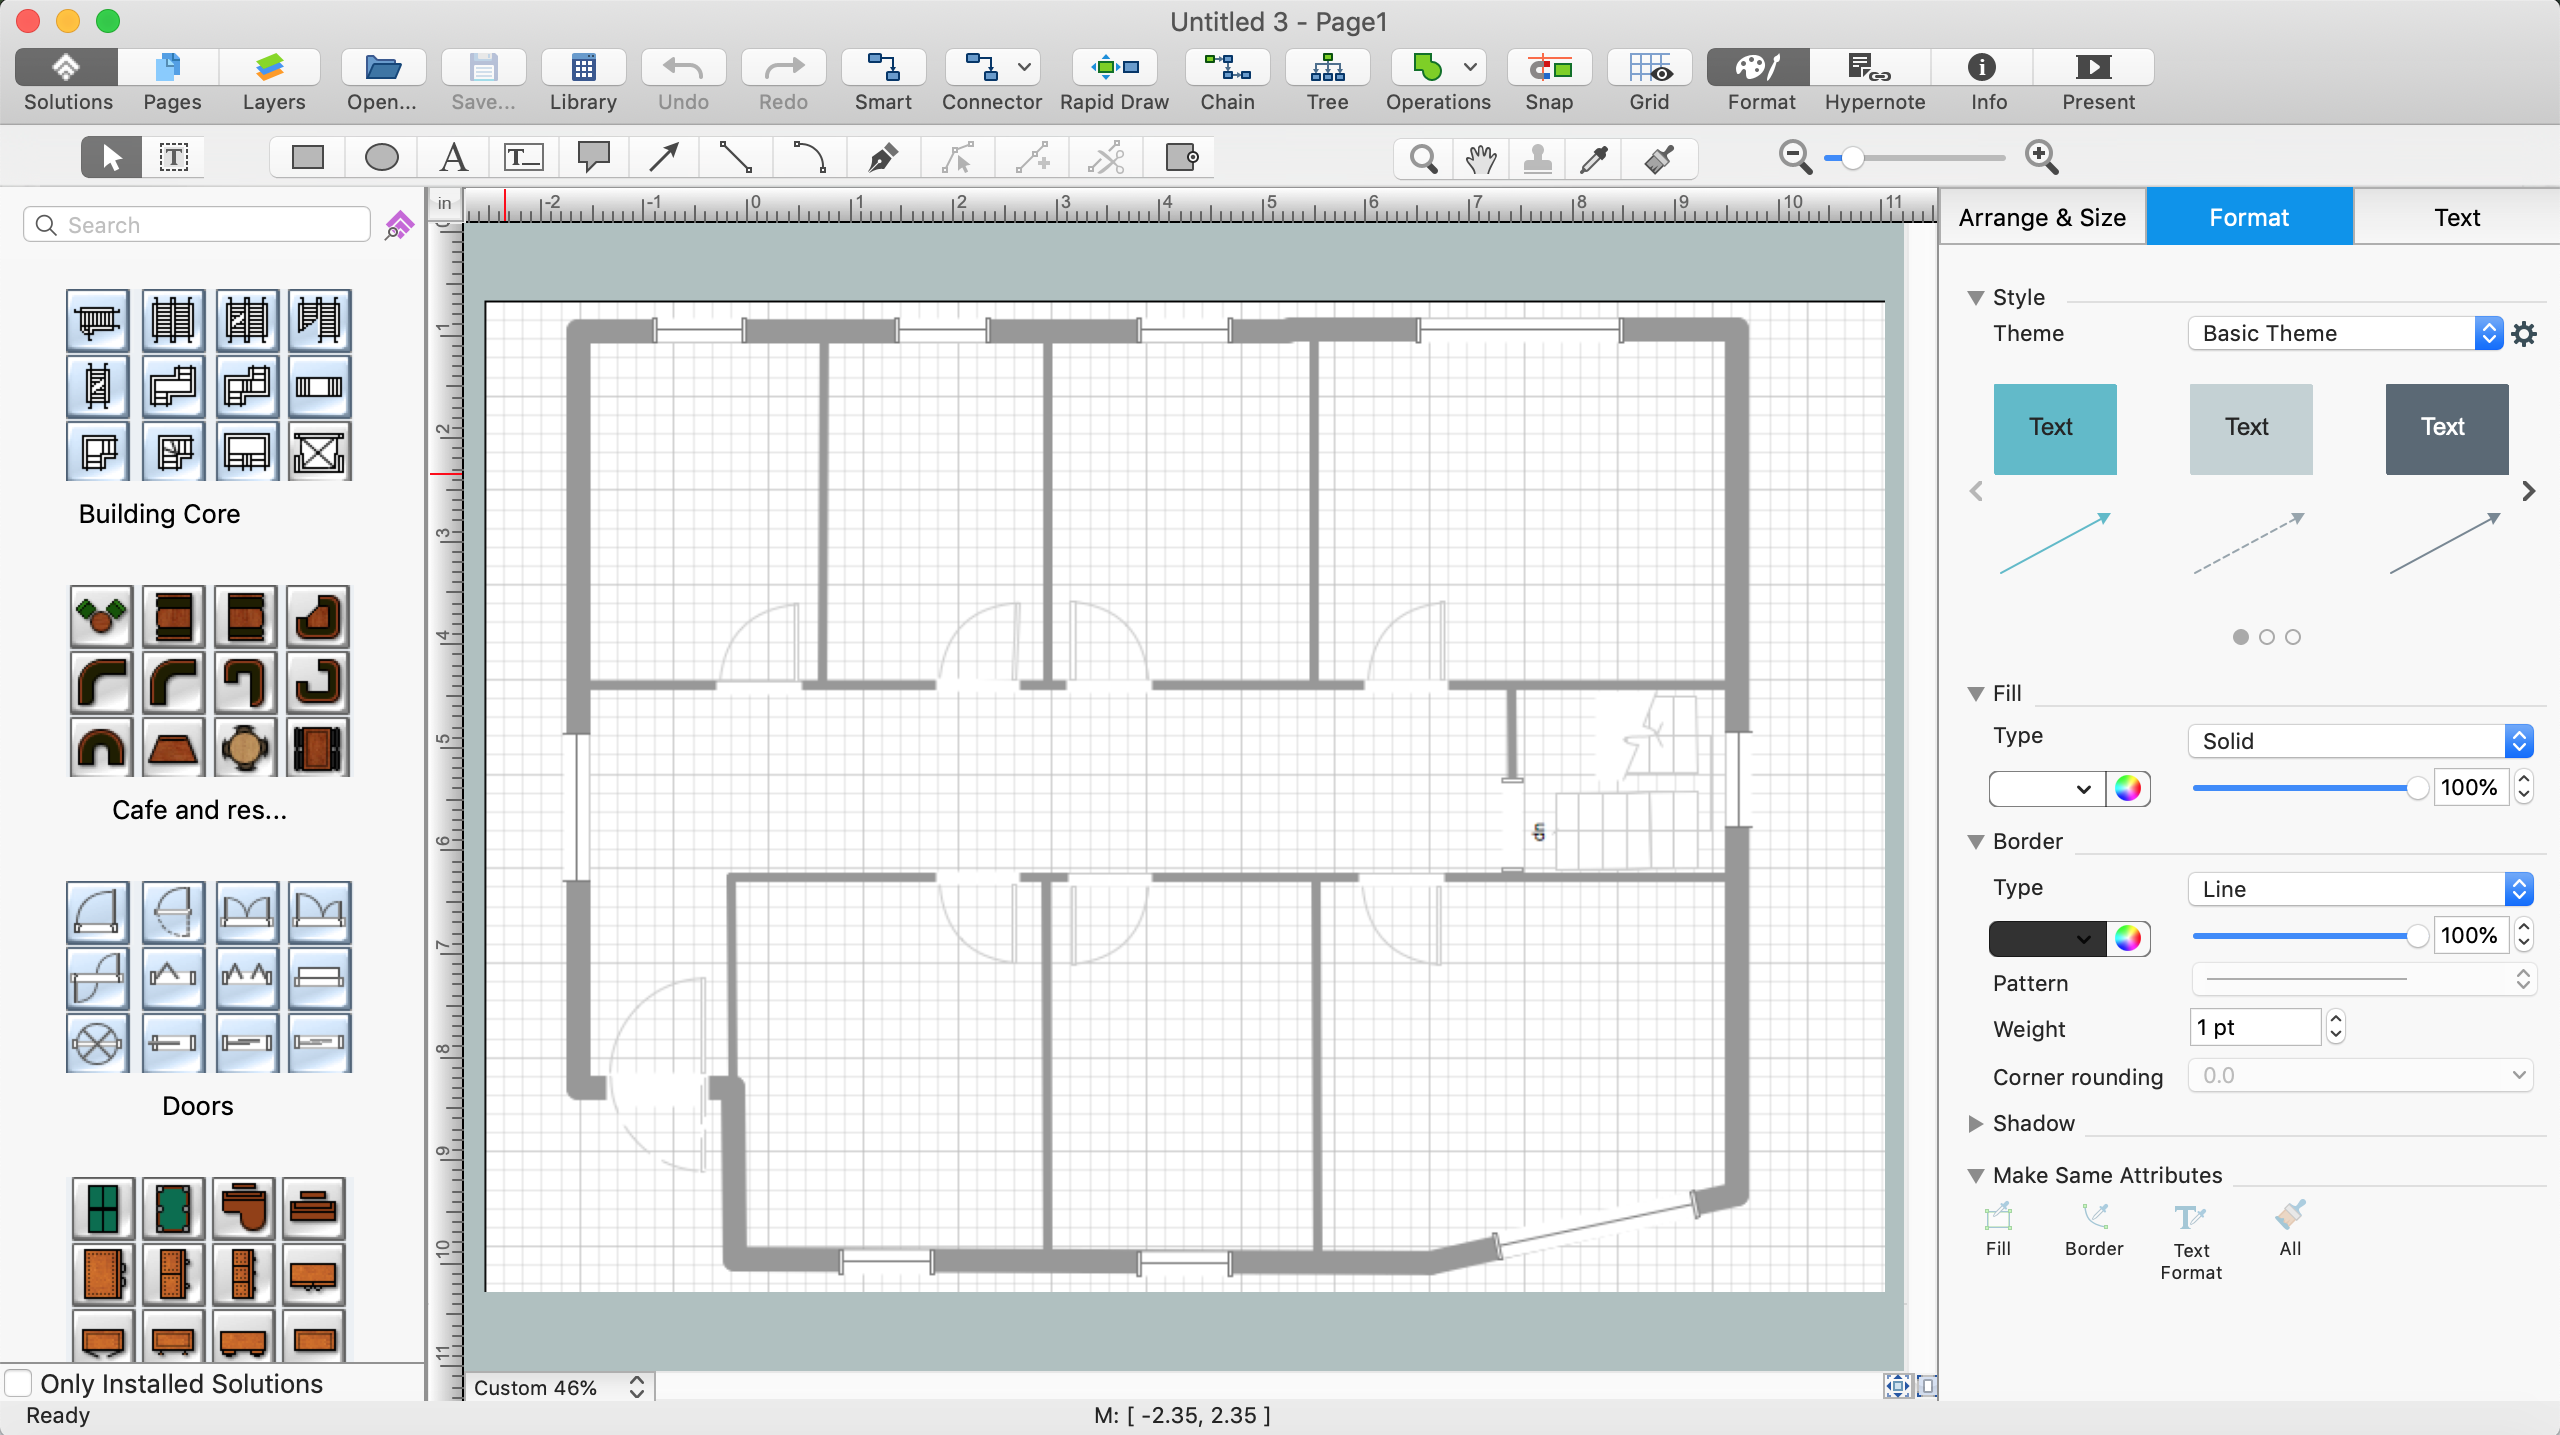
Pic. 1. Technical Drawing Software
Moreover ConceptDraw DIAGRAM is the only professional technical drawing and diagramming software of its kind designed to work on both Macintosh OS X and Windows.
Technical Drawing Symbols
Mechanical Engineering Solution provides 8 libraries with 602 predesigned vector objects from mechanical engineering:
- Bearings
- Dimensioning and Tolerancing
- Fluid Power - Equipment
- Fluid Power - Valves
- Hydraulic Pumps and Motors
- Pneumatic Pumps and Motors
- Valve Assembly
- Welding
These libraries contain all needed technical drawing symbols for creating any technical drawings in minutes.
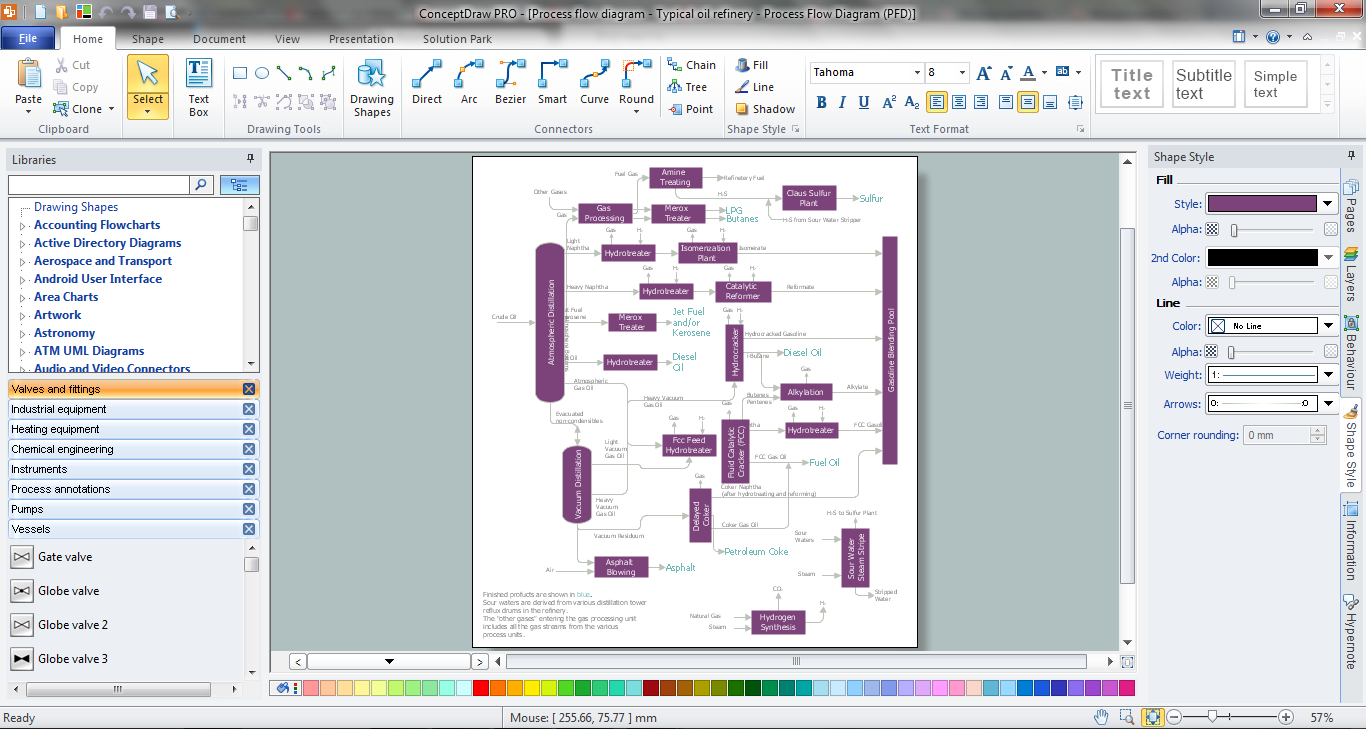
Pic. 2. Technical Drawing Symbols
Simply drag the needed technical drawing symbols and shapes from the libraries to the document, arrange them, add text, make some style and color changes, and your professional looking technical drawing will be ready.
Technical Drawing Sample
Another way of technical drawing in ConceptDraw DIAGRAM is to use as the base the predesigned template or sample from the ConceptDraw STORE. The whole collection of technical drawing templates and samples is available from ConceptDraw STORE.
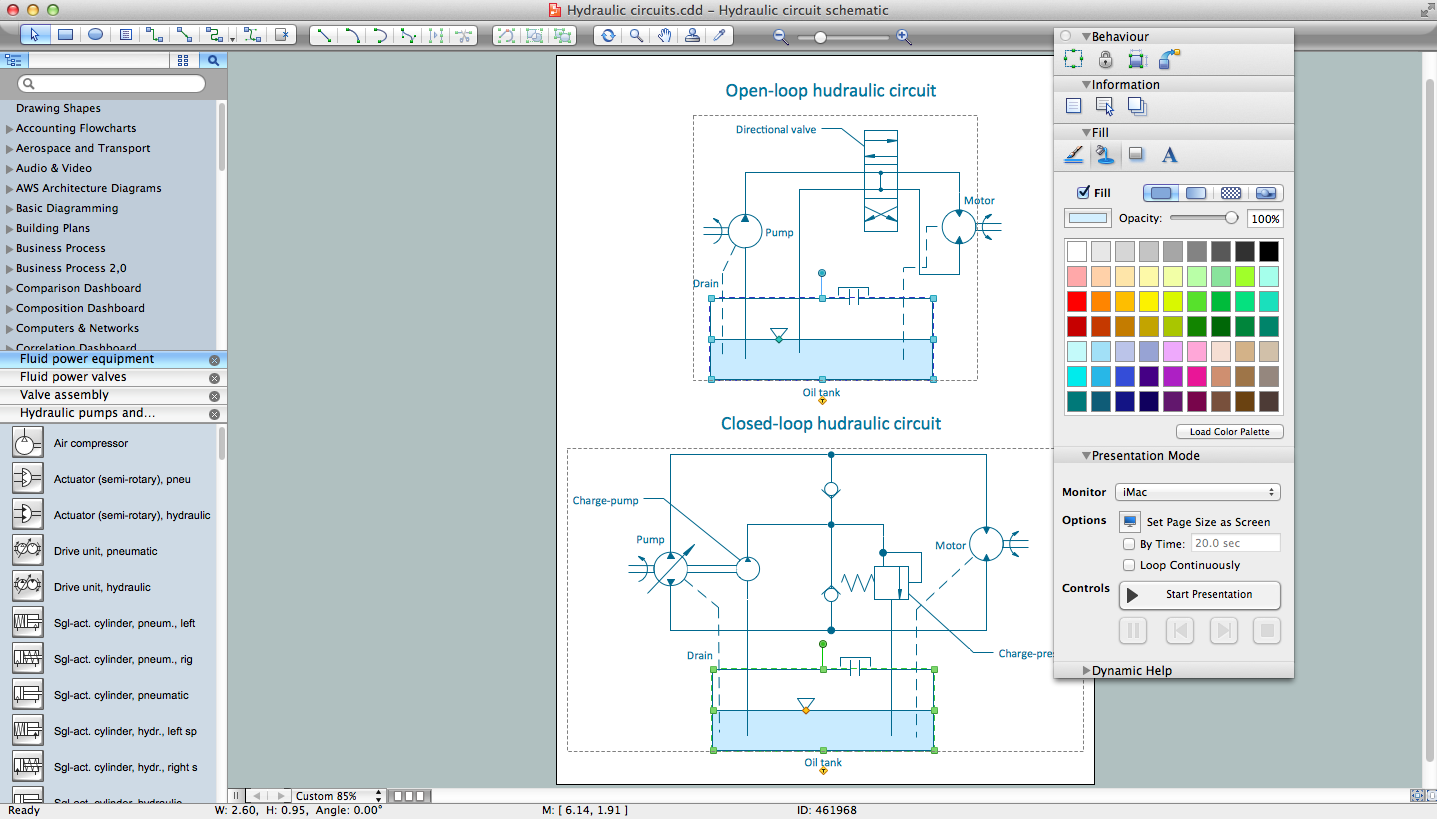
Pic. 3. Technical Drawing Sample
The following features make ConceptDraw DIAGRAM the best Technical Drawing software:
- You don't need to be an artist to draw professional looking diagrams in a few minutes.
- Large quantity of ready-to-use vector objects makes your drawing diagrams quick and easy.
- Great number of predesigned templates and samples give you the good start for your own diagrams.
- ConceptDraw DIAGRAM provides you the possibility to use the grid, rules and guides. You can easily rotate, group, align, arrange the objects, use different fonts and colors to make your diagram exceptionally looking.
- All ConceptDraw DIAGRAM documents are vector graphic files and are available for reviewing, modifying, and converting to a variety of formats: image, HTML, PDF file, MS PowerPoint Presentation, Adobe Flash, MS Visio.
- Using ConceptDraw STORE you can navigate through ConceptDraw Solution Park, managing downloads and updates. You can access libraries, templates and samples directly from the ConceptDraw STORE.
- If you have any questions, our free of charge support is always ready to come to your aid.
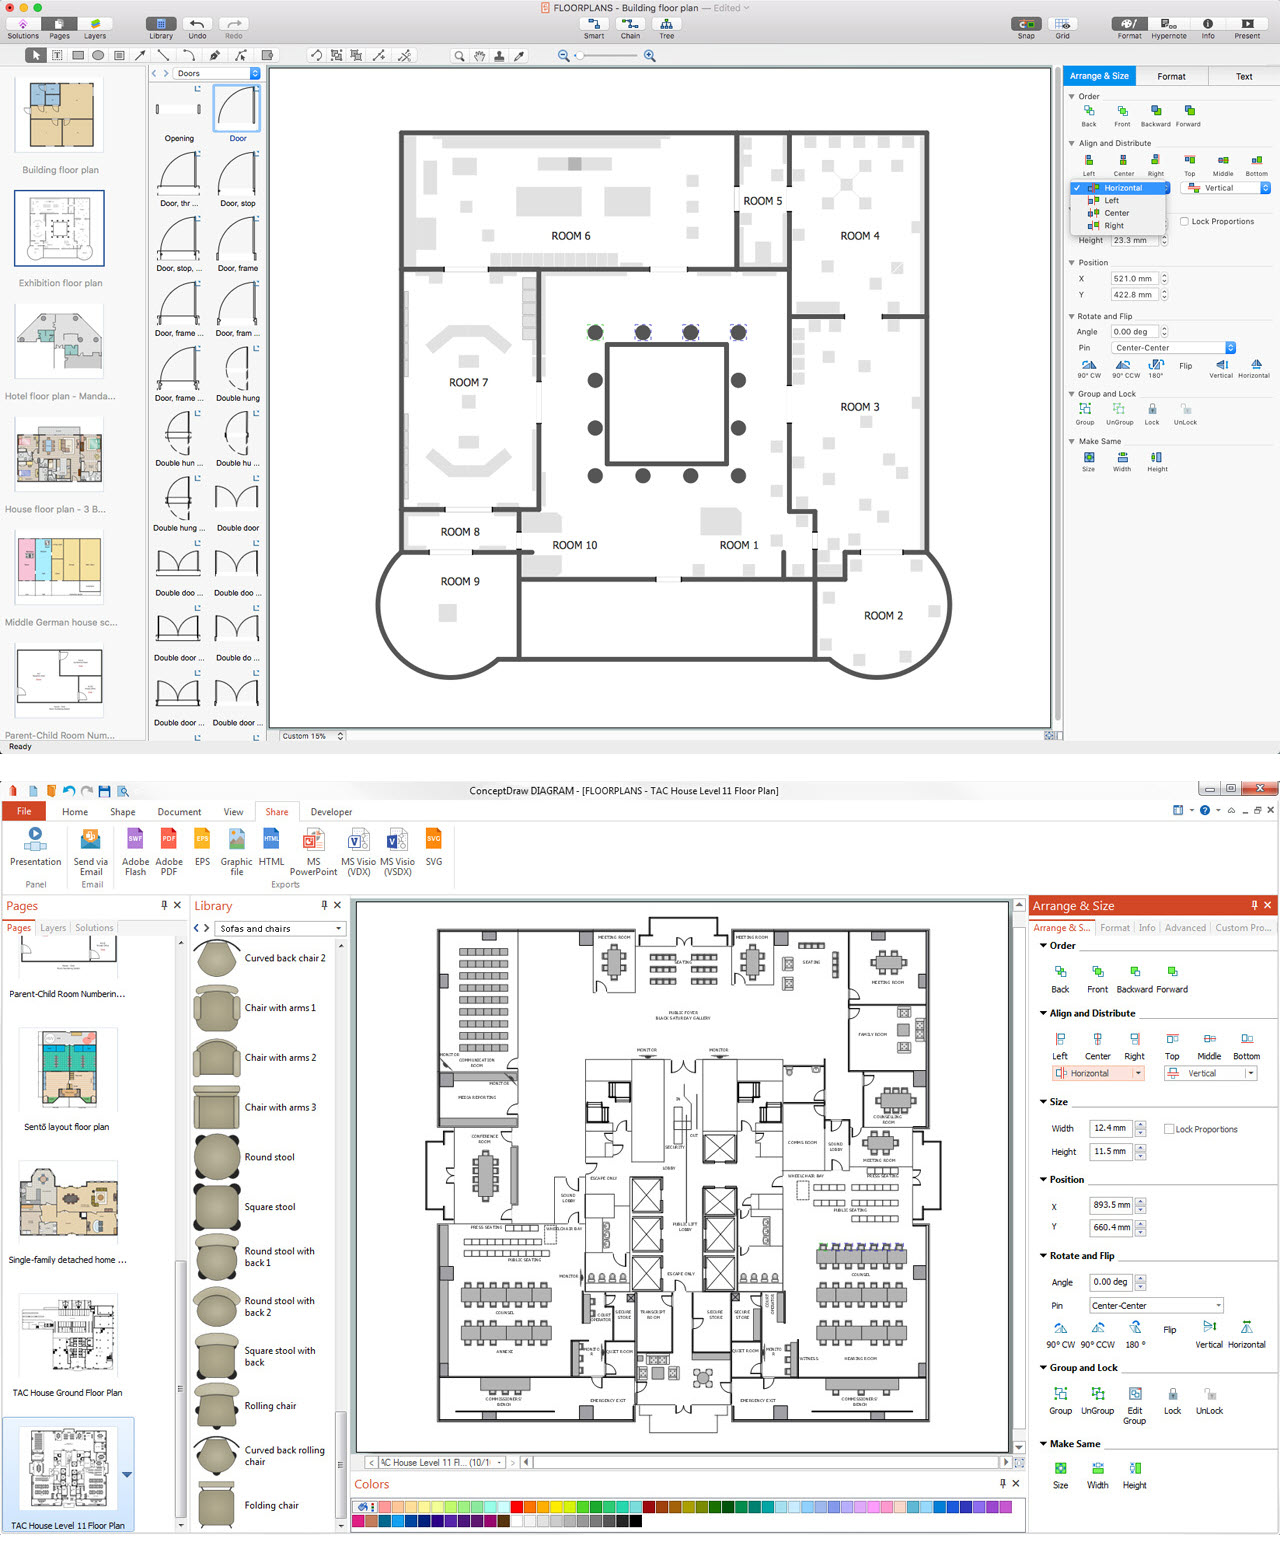
TEN RELATED HOW TO's:
Office Design Software →
The Office Layout Plans Solution contains a large quantity of vector objects that will make your creating of the office design plans easy, quick and effective. It also provides templates and samples that will help you create the office designs of any difficulty in one moment.
Pyramid Diagram and Pyramid Chart →
Any hierarchical structure of any company can be represented as a triangle or a pyramid. You can create a pyramid diagram and pyramid chart of any complexity using special libraries included in ConceptDraw DIAGRAM. Actually, any knowledge or chain of facts can also be depicted as a pyramid. A wide range of graph and chart are utilized in marketing to maintain documentation and various visual issues, that deal with marketing information and data. The marketing value pyramid can be created to illustrate how the value of company, or product is based on its competitiveness. To design this diagram we used ConceptDraw DIAGRAM drawing tools in conjunction with Pyramid solution for Solution Park.
Hotel Plan. Hotel Plan Examples →
In case you need to make a plan for your own future hotel or to do it for someone else, then you can always find the way to make such template very quickly and to have a very good looking result in the end. Whichever type of the hotels you want to illustrate in a way of a floor plan, you can always do it with ConceptDraw DIAGRAM drawing application.
Electrical Symbols — Terminals and Connectors →
An electrical connector, is an electro-mechanical device used to join electrical terminations and create an electrical circuit. Electrical connectors consist of plugs (male-ended) and jacks (female-ended). The connection may be temporary, as for portable equipment, require a tool for assembly and removal, or serve as a permanent electrical joint between two wires or devices. 26 libraries of the Electrical Engineering Solution of ConceptDraw DIAGRAM make your electrical diagramming simple, efficient, and effective. You can simply and quickly drop the ready-to-use objects from libraries into your document to create the electrical diagram.
Process Engineering →
ConceptDraw DIAGRAM diagramming and vector drawing software supplied with Chemical and Process Engineering Solution from the Industrial Engineering Area of ConceptDraw Solution Park is powerful and effective process engineering software.
Basic Diagramming →
Try ConceptDraw program, the perfect drawing tool for creating all kinds of great-looking drawings, charts, graphs, and illustrations.
Process Flow Chart Software Free →
How to draw a Process Flow Chart? It's very fast and easy to draw any Process Flow Chart using the tools of special Process Flow Chart software free. Flowcharts Solution offers wide set of useful drawing tools, collection of samples, ready-to-use template and 2 libraries with predesigned vector elements which will help facilitate drawing process and designing professional looking process flow chart, process flow scheme, process block diagram, etc.
UML State Machine Diagram.Design Elements →
UML state machine's goal is to overcome the main limitations of traditional finite-state machines while retaining their main benefits. ConceptDraw has 393 vector stencils in the 13 libraries that helps you to start using software for designing your own UML Diagrams. You can use the appropriate stencils of UML notation from UML State Machine library.
Symboles Organigramme →
Les organigrammes sont parfaits pour représenter visuellement des processus operationnels. Par exemple, si vous avez besoin d'afficher le flux d'un processus d'ordre personnalisé par l'entremise de divers opérateurs au sein de votre organisation, vous pouvez utiliser un organigramme. Voir aussi d'autres symboles organigramme: Symboles ordinogramme standard, symboles du flux de travail, Vérification Les symboles du schéma fonctionnel, sOrganigramme comptables des symboles, Organigramme de vente des symboles, Symboles pour organigramme des RH, Carte des symboles de processus, Diagramme de processus opérationnels, Symboles utilisés dans le schéma IDEF0.
Cross-Functional Flowchart →
There are many tools to manage a process or to illustrate an algorithm or a workflow. Flowcharting is one of those tools. However, it may be difficult to show complex processes that require multiple attributes or several people in a simple flowchart, so a cross-functional flowchart would be a solution for that situation. To create such flowchart, group processes and steps to labeled rows or columns, and divide those groups with horizontal or vertical parallel lines. It is worth mentioning that there are different types of cross-functional flowcharts, like opportunity or deployment flowchart. This diagram shows a cross-functional flowchart that was made for a trading process. It contains 14 processes, distributed through 5 lines depicting the participants who interact with the process. Also there are connectors that show the data flow of information between processes. The cross-functional flowchart displays a detailed model of the trading process, as well as all participants in the process and how they interact with each other. The lines in the flowchart indicates the position, department and role of the trading process participants.