UML Interaction Overview Diagram.
Design Elements
UML Interaction Overview Diagram is a type of Interaction Diagrams that describes an overview in which the nodes represent interaction diagrams.
Interaction Overview Diagrams look the same as Activity Diagrams. The difference is that: on the Interaction Overview Diagram every individual activity describes as a frame that can include the nested Interaction Diagrams. This feature makes the Interaction Overview Diagrams useful to deconstruct the complex scenarios.
The Rapid UML Solution for ConceptDraw DIAGRAM contains 13 vector stencils libraries with 393 interactive shapes that you can use to design your UML diagrams.
To design an Interaction Overview Diagram use the UML Interaction Overview Diagram library.
UML Interaction Overview Diagram library contains 13 shapes:
- Interaction
- Initial node
- Final node
- Decision/merge node
- Parallel control flow
- Control flow
- Note
- Constraint
- Fork/join node
- Lifeline
- Receive signal node
- Smart connector
- Message
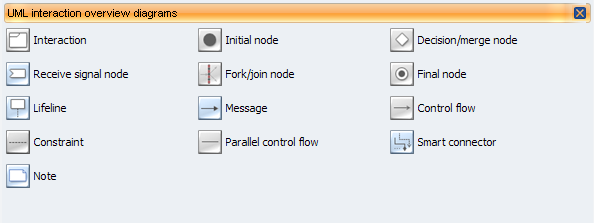
Pic.1. UML Interaction Overview Diagram Library
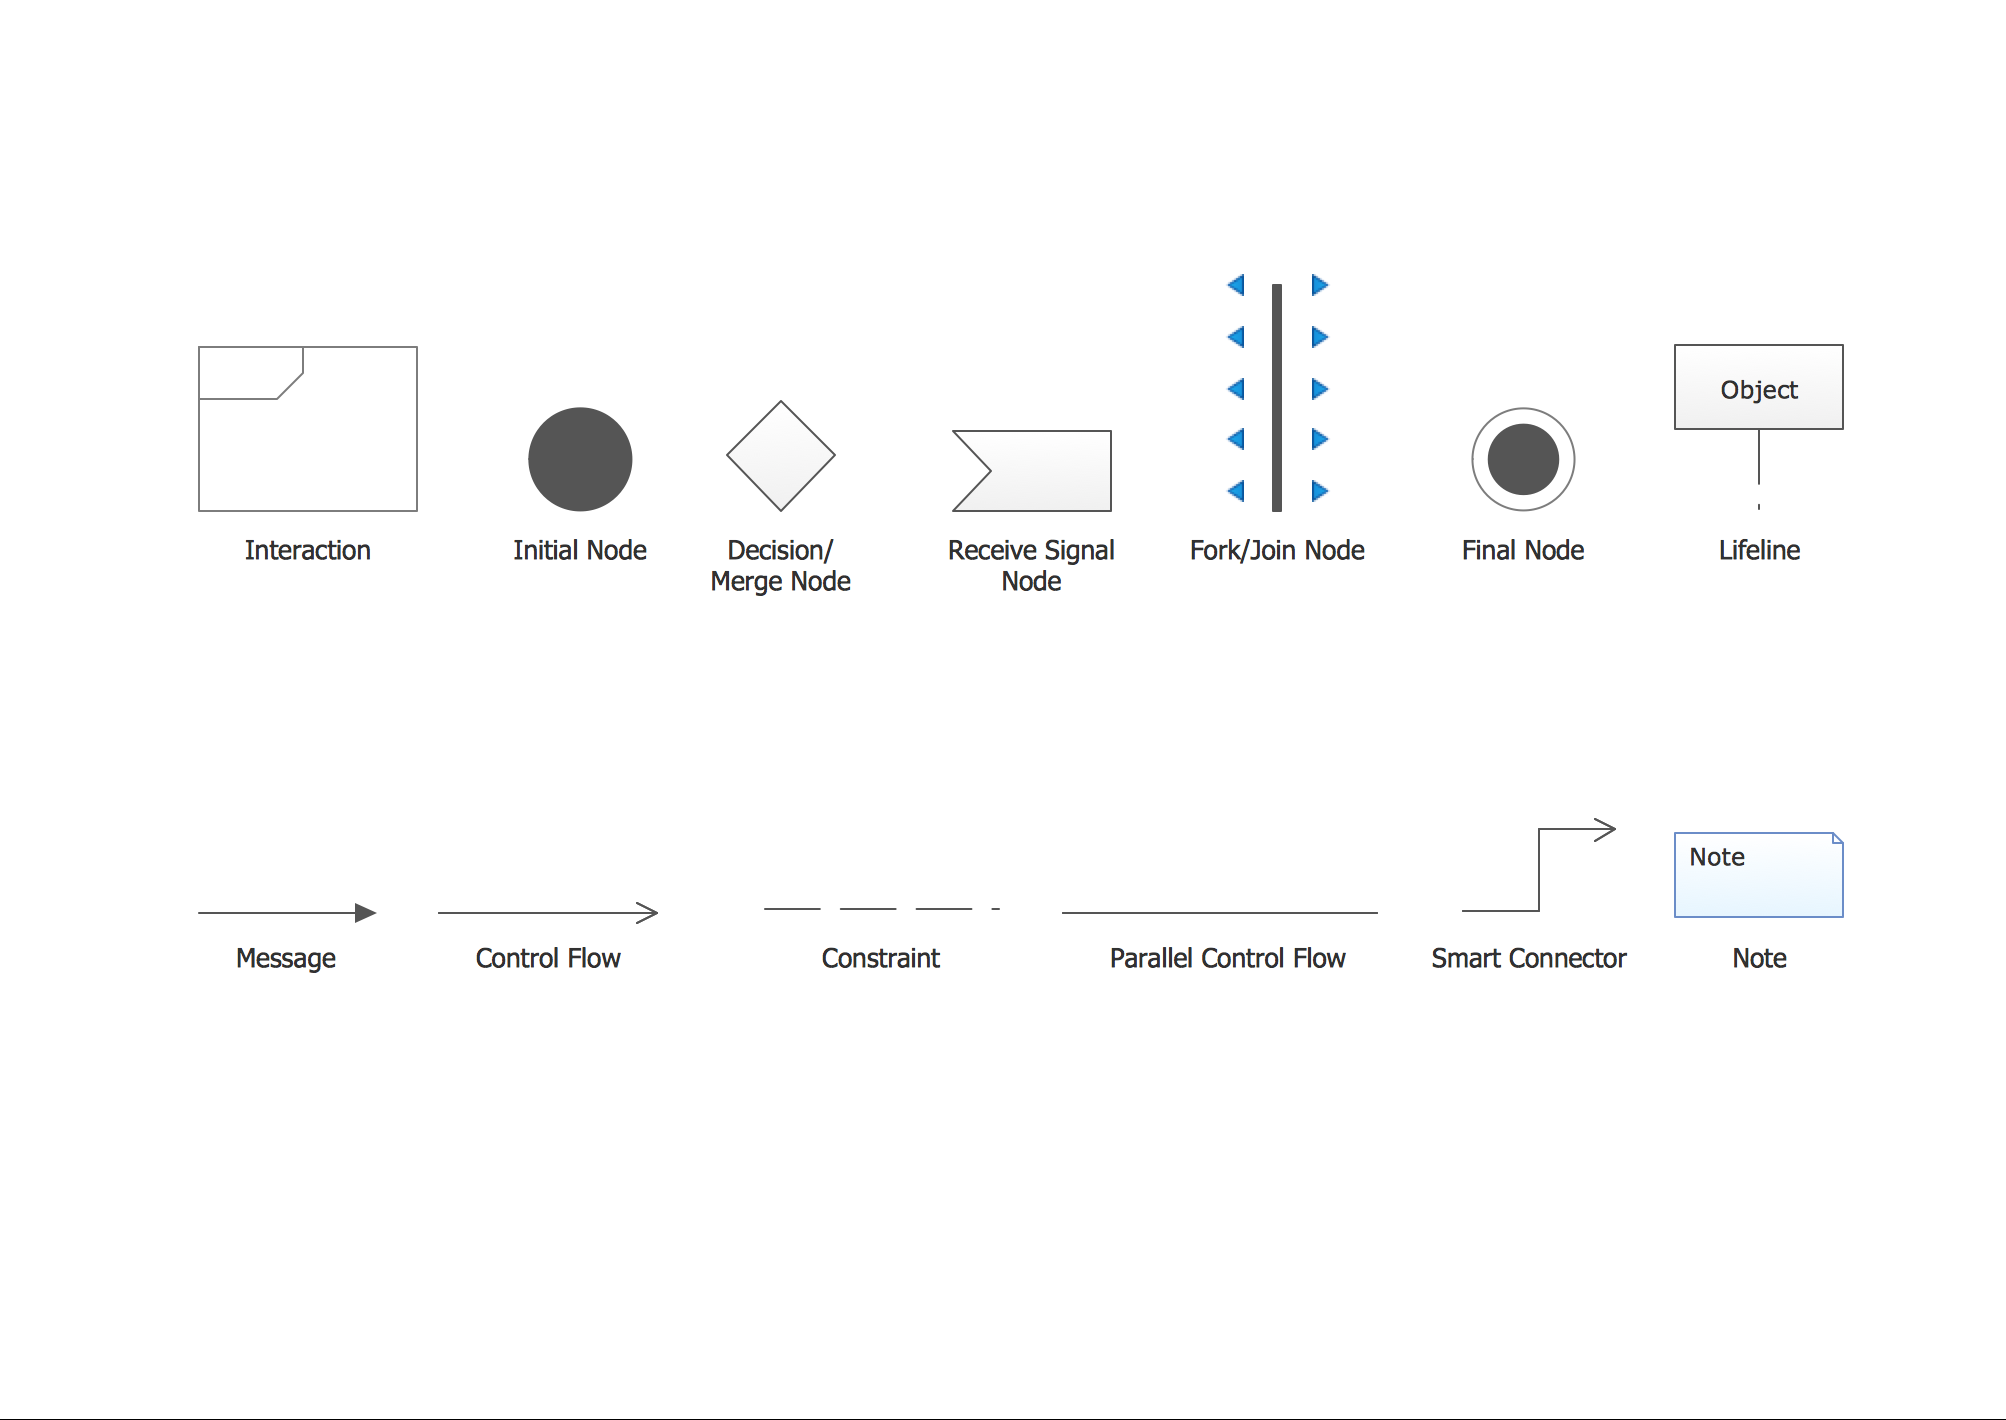
Pic.2. UML Interaction Overview Diagram Library Elements
ConceptDraw Rapid UML solution provides UML Interaction Overview Diagram library of vector stencils for drawing the interaction overview diagrams using interaction overview blocks and assembly connectors.
All libraries for creating UML diagrams are available inside the ConceptDraw DIAGRAM Templates and samples are located in the Rapid UML section of ConceptDraw STORE.

Pic.3. UML Diagrams solution
Use design element from the UML Interaction Overview Diagram library to draw your own UML interaction overview diagrams of complex systems and software applications.


TEN RELATED HOW TO's:
Remote Networking - We explain the method most people use to connect to the Internet.
Picture: Using Remote Networking Diagrams
The UML diagram is a powerful tool which lets visually represent all system's components, the interactions between them and relationships with external user interface.
The Rapid UML solution for ConceptDraw DIAGRAM software offers diversity of UML flowchart symbols for drawing all types of UML diagrams.
Picture: UML Flowchart Symbols
Related Solution:
Tips on how to make an accounting flowchart. Describing methods and symbols that are used to represent the accounting system.
Picture: How to Make an Accounting Process Flowchart
Related Solution:
The fundamental concepts of electrical engineering in our detailed guide. ✔️ Discover essential electrical engineering software tools. 🔸 The main types of electrical engineering you need to know in this article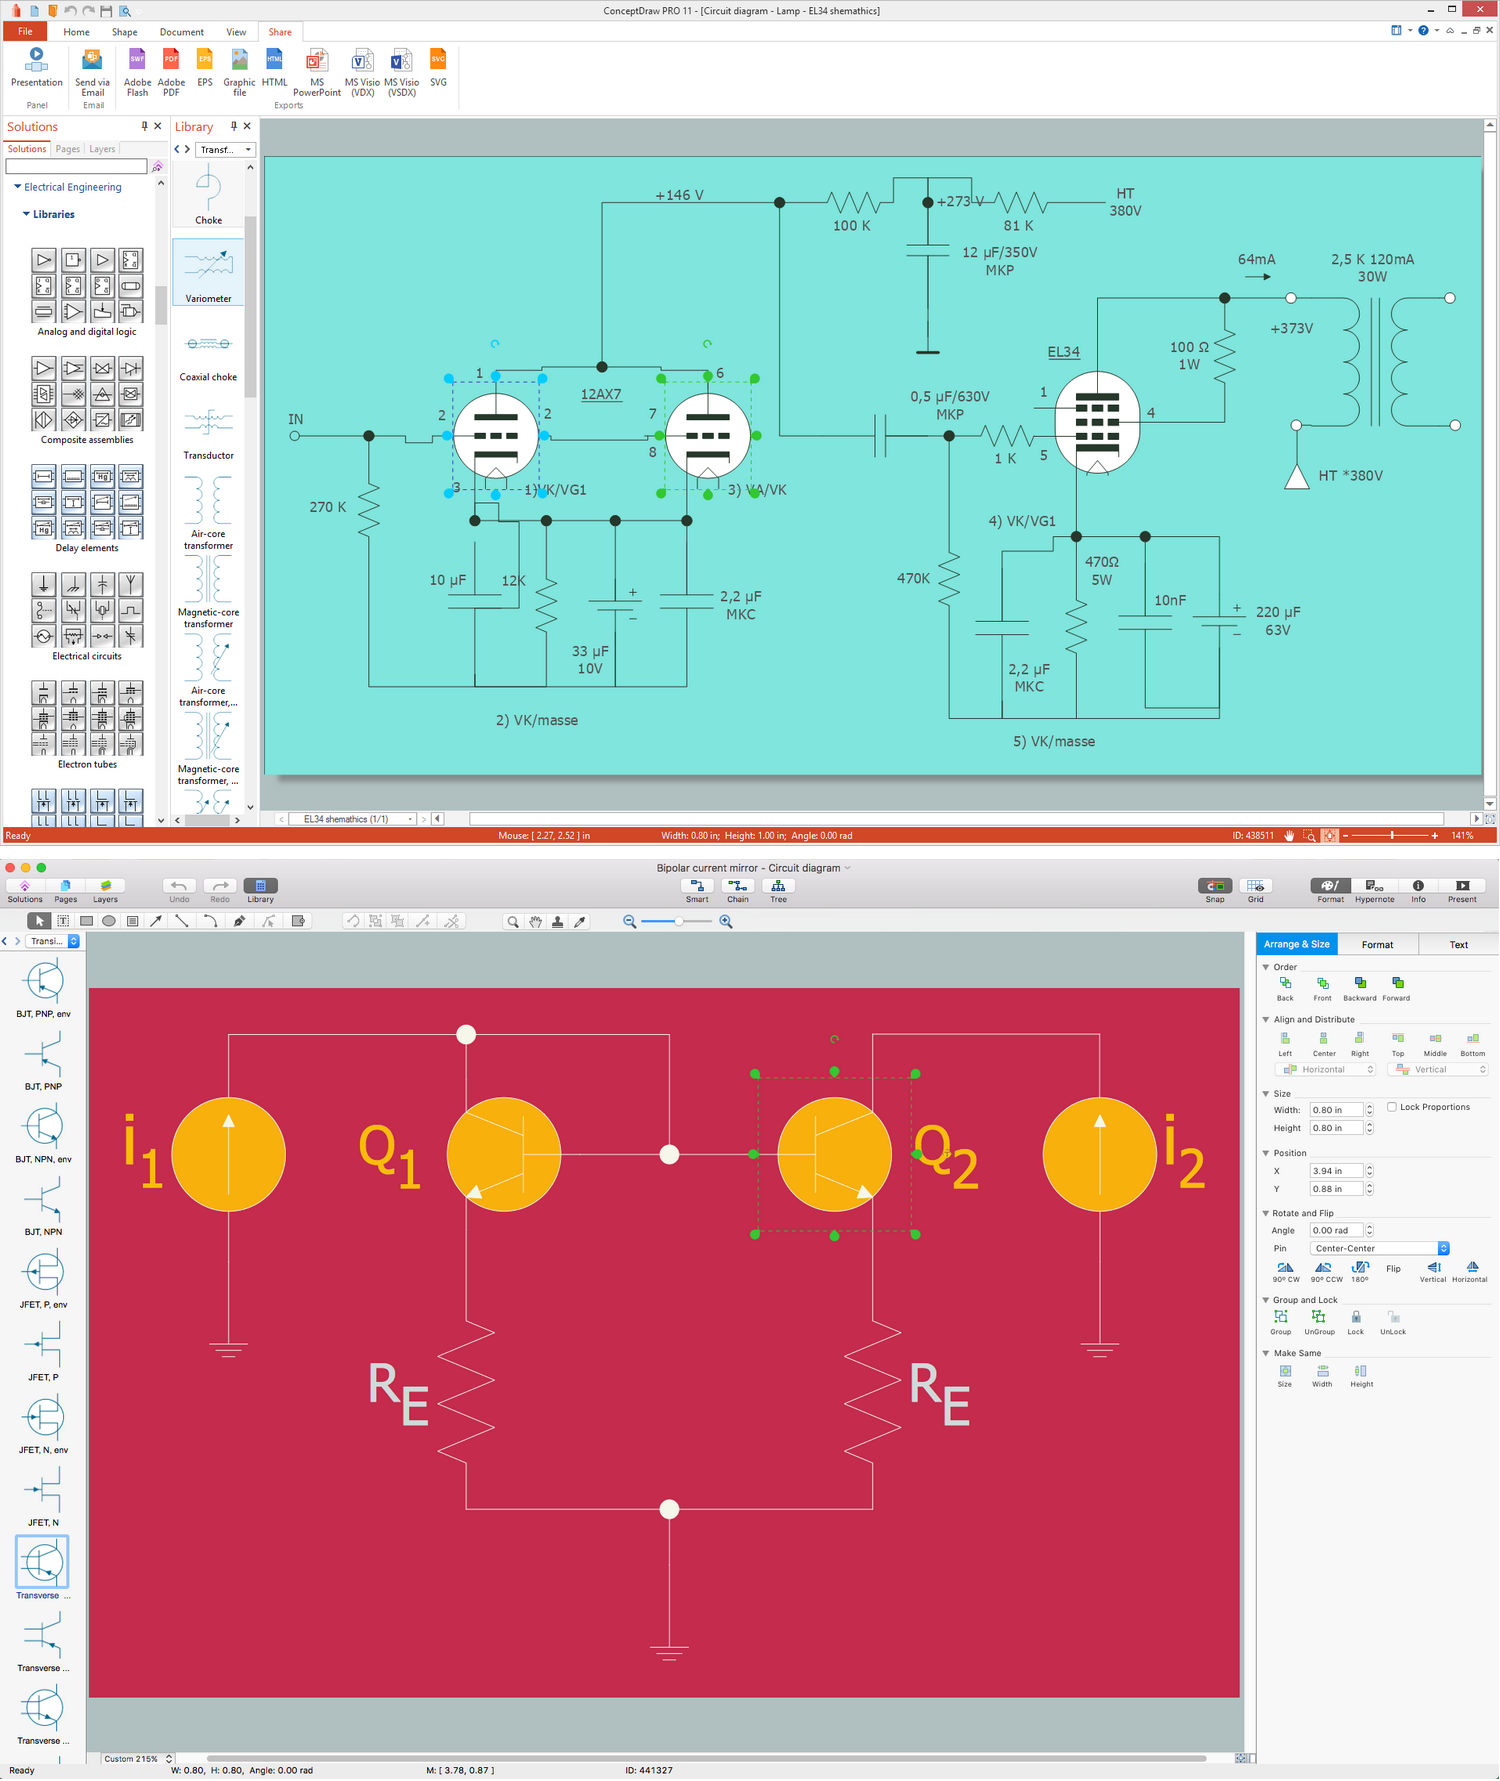
Picture:
What is Electrical Engineering?
Basic Electrical Engineering Software
Related Solution:
This sample was created in ConceptDraw DIAGRAM diagramming and vector drawing software using the Flowcharts solution from the Diagrams area of ConceptDraw Solution Park.
This sample shows the Flowchart of the Subprime Mortgage Crisis. This Flowchart describes the decline in housing prices when the housing bubble burst and what it caused on the housing and financial markets. You can also see the Government and Industry responses in this crisis situation.
Picture: Flowchart on Bank. Flowchart Examples
Related Solution:
This sample was created in ConceptDraw DIAGRAM diagramming and vector drawing software using the UML Sequence Diagram library of the Rapid UML Solution from the Software Development area of ConceptDraw Solution Park.
This sample shows the interactions of the customer with the system and is used at the registration on the sites.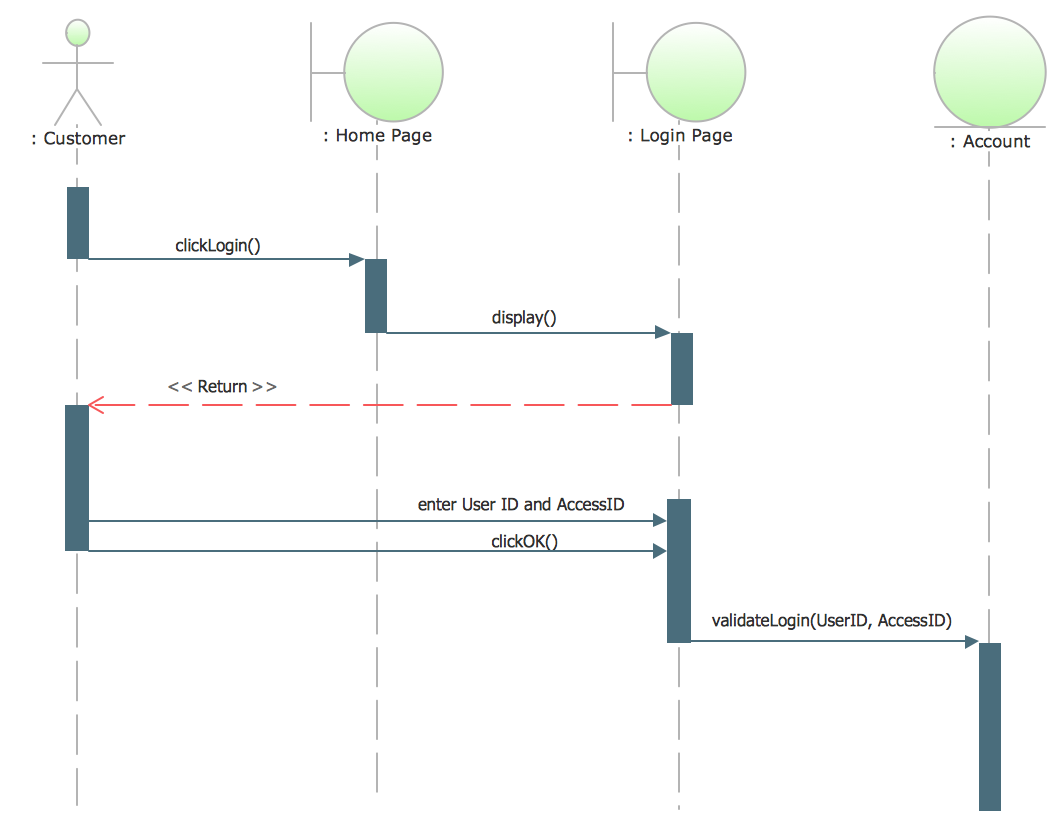
Picture: UML Sequence Diagram Example. SVG Vectored UML Diagrams Tools
Related Solution:
You can use many tools to create a representation of a system behavior or a scheme of objects relationships. Some of them are quite abstract and useless, and some, like UML tools help clarifying both the structure and the behavior of a system. There are various types of uml diagrams and tons of examples explaining the difference between them.
UML 2.2 specification has many kinds of diagrams. They are divided into two groups( structure and behavior diagrams). This class diagram shows the hierarchical structure of UML 2.2 specification. Class diagram - the most suitable tool for this task because it is designed to describe basic structure of a system. This diagram can be use as a visual aid for learning UML.
Picture: UML Tool & UML Diagram Examples
Related Solution:
The UML Diagrams are widely used by software developers and software engineers. They can draw the UML Diagrams manually on the paper, but it is incredibly convenient to use the special UML diagramming software. The UML diagramming software allows you to draw the UML Diagrams in a few minutes.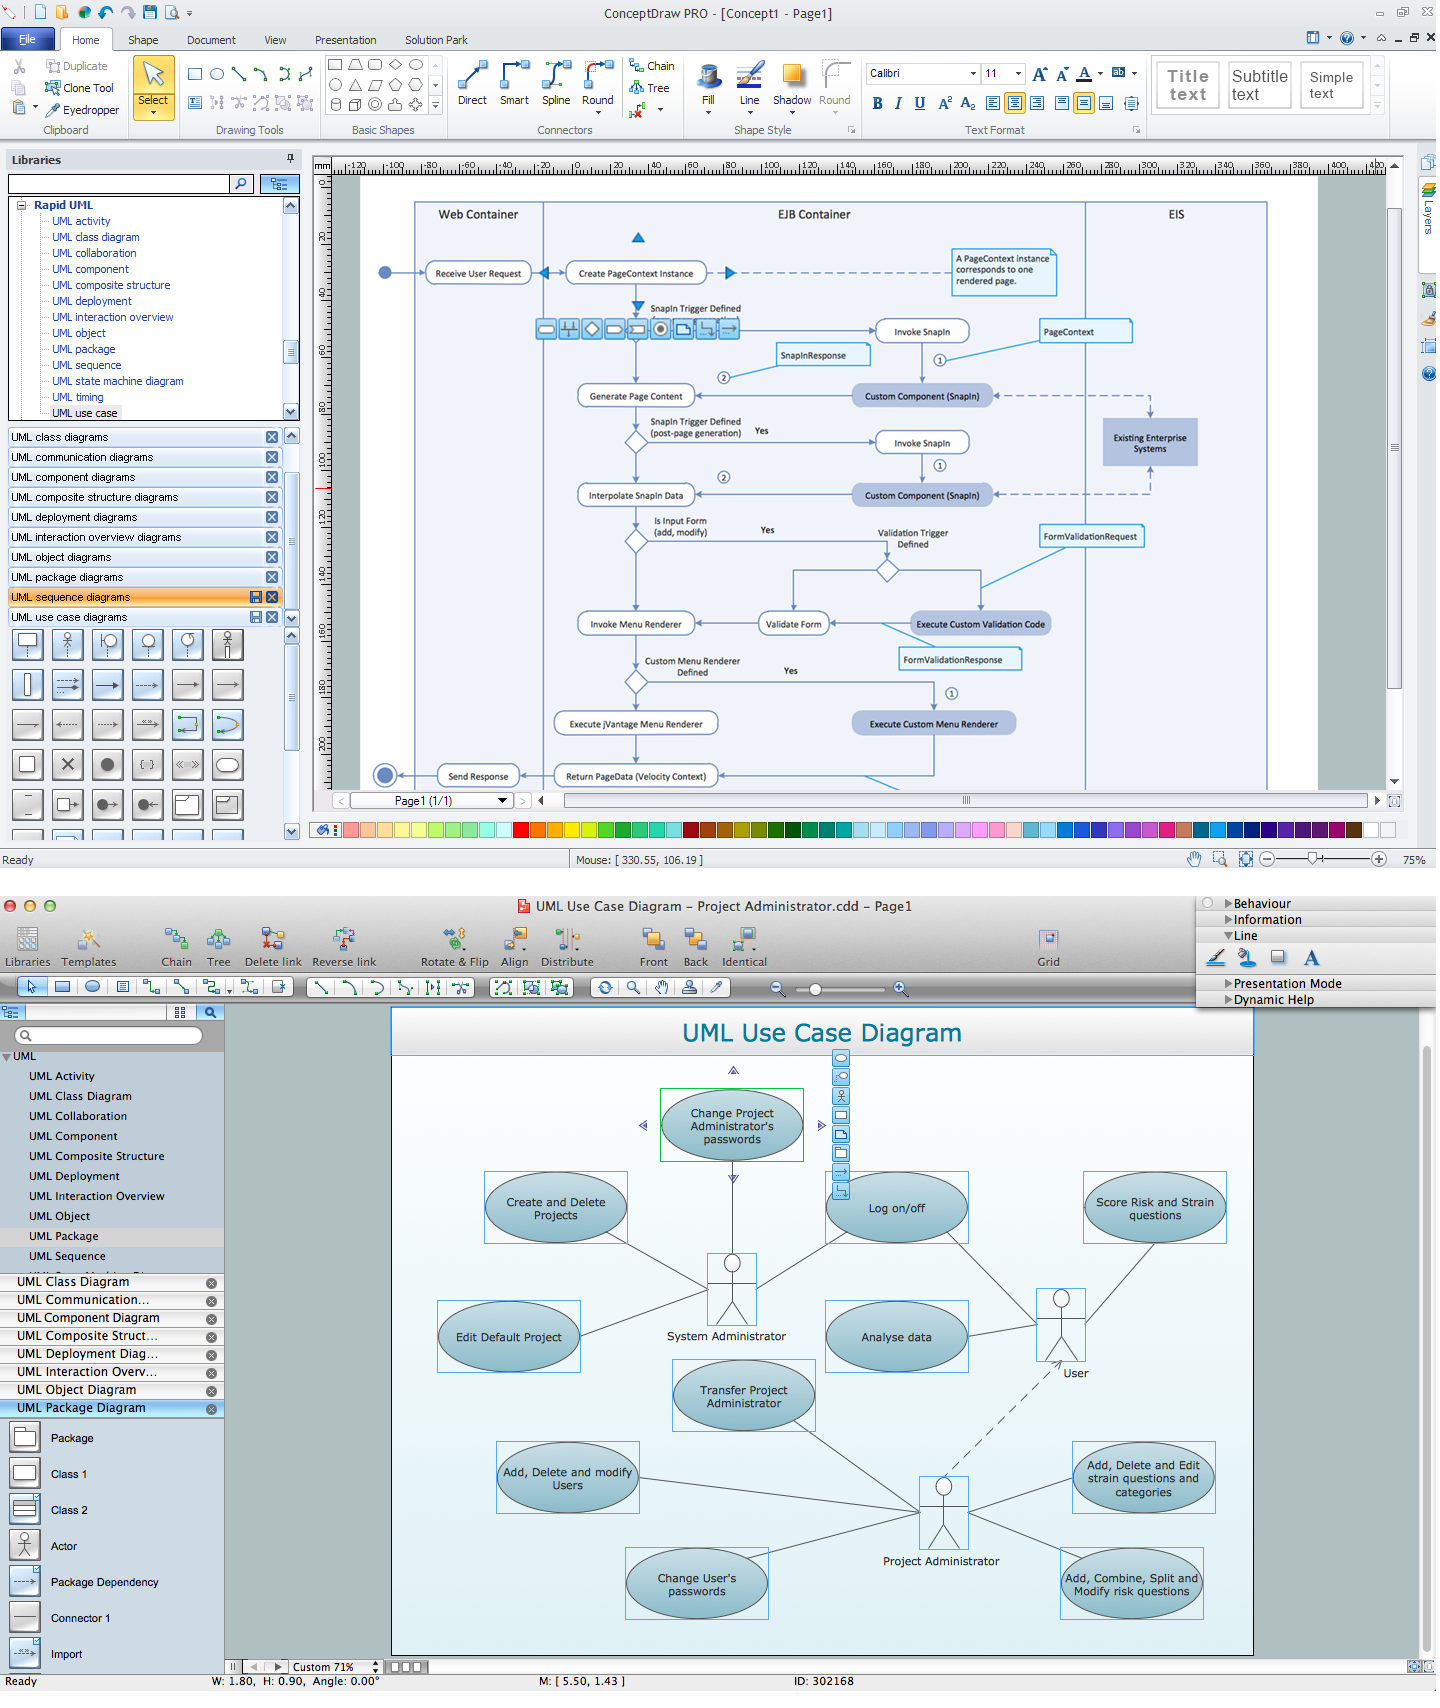
Picture: UML Diagramming Software
Related Solution:
UML Object Diagram shows the structure of a modeled system at a specific time.
ConceptDraw Rapid UML solution delivers libraries contain pre-designed objects fit UML notation, and ready to draw professional UML Object Diagram.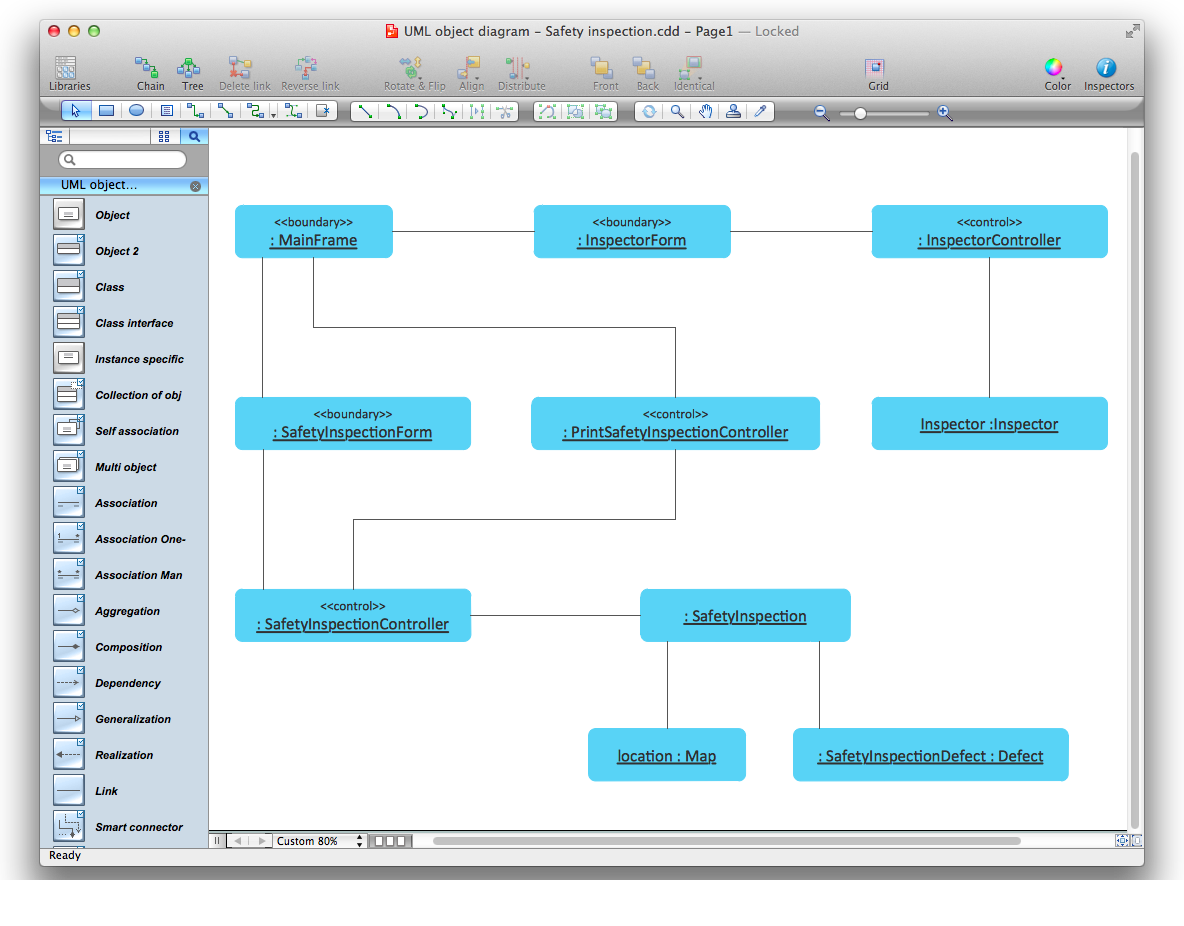
Picture: Diagramming Software for Design UML Object Diagrams
Related Solution:
Use Case Diagrams describes the functionality provided by a system in terms of actors, their goals represented as use cases, and any dependencies among those use cases.
Picture: Diagramming Software for Design UML Use Case Diagrams


