Design Pictorial Infographics.
Design Infographics
In the course of recent decades data visualization went through significant development and has become an indispensable tool of journalism, business intelligence and science. The way visual information may be conveyed is not limited simply to static or dynamic representation, it can also be interactive. Infographics can be conditionally divided into several general levels. Primarily, this is level of visualization of information, its interpretation and association on any ground. Second level can be defined as a visualization of knowledge, depiction of thoughts and ideas in the form of images or diagrams. Finally, the level of data visualization, which processes data arrays in charts, enabling the information to be more clearly perceived. You can also identify the main approaches to the creation of infographics: exploratory and narrative. Exploratory method insists on minimalist design in favor of data precision without unnecessary details and is common for scientific researches and analytics. The narrative approach focuses on the entertainment component and vibrant visual images. Its usual field of application is marketing and journalism. It is important to remember that the goal of data visualization is to pass on the information and not to overload the image.
Pictorial chart is based on pictograms - symbols that are common and the most typical features of a recognizable object or phenomenon. To construct such a diagram you should place a number of such symbols in a row.
Design Pictorial Infographics
ConceptDraw DIAGRAM extended with unique Pictorial Infographics Solution from the “What is Infographics” Area is a best choice for designing pictorial infographics illustrations in minutes.
Pictorial Infographics solution provides easy-to-use design infographics drawing tools and a wide variety of libraries with large collection of predesigned pictograms:
- Business People Pictograms
- Computer Pictograms
- Ecology Pictograms
- Medicine and Health Pictograms
- Office Pictograms
- People Pictograms
- Shopping Pictogram
- Time and Clock Pictograms
- Transport Pictograms
- Travel and Tourism Pictograms
Not less important question - how to use infograms? They are applied in various fields:
- geography
- journalism
- education
- statistics, etc.

Sample 1. Design Infographics — Business People Pictograms
The Business People Pictograms library from the Pictorial Infographics solution contains 14 vector pictograms of business people that allow you design pictorial business illustrations.

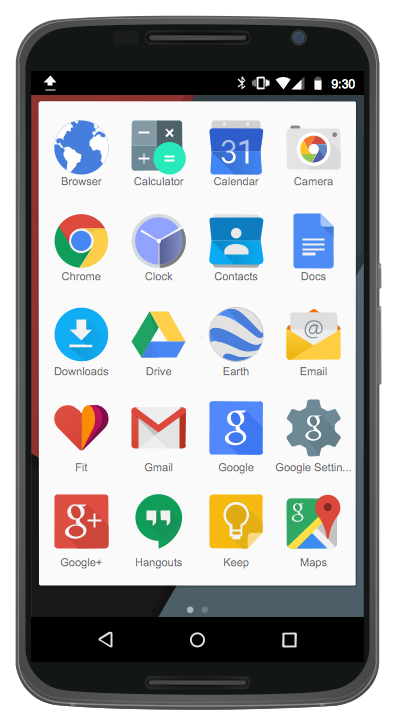
Sample 2. Design Infographics — Computer Pictograms
Using the Computer Pictograms library from the Pictorial Infographics solution with 20 computer-related vector pictograms you can quick and easy draw the computer diagrams, illustrations for presentations and reports.

Sample 3. Design Infographics — Ecology Pictograms
The Ecology Pictograms library from the Pictorial Infographics solution contains 20 vector pictograms from the ecology field for illustrating the appearances on the ecology conferences, symposiums.

Sample 4. Design Infographics — Medicine and Health Pictograms
Use the Medicine and Health Pictograms library from the Pictorial Infographics solution that contains 20 well-known vector medical pictograms to create the attractive illustrations for medical articles, publications, reports.

Sample 5. Design Pictorial Infographics — Office Pictograms
The Office Pictograms library from the Pictorial Infographics solution contains 20 vector office pictograms that allow you design pictorial infographics charts for the announcements, letters and messages.

Sample 6. Design Pictorial Infographics — People Pictograms
The People Pictograms library from the Pictorial Infographics solution contains 20 vector pictograms of people easily recognizable and understandable for all that can be useful to design infographics illustrations and charts in any sphere of life.

Sample 7. Design Pictorial Infographics — Shopping Pictogram
Use the Shopping Pictogram library from the Pictorial Infographics solution with 20 shopping-related vector pictograms for your shopping and commerce activities.

Sample 8. Design Infographics — Time and Clock Pictograms
The Time and Clock Pictograms library from the Pictorial Infographics solution contains 20 vector clock pictograms that can be applied literally everywhere.

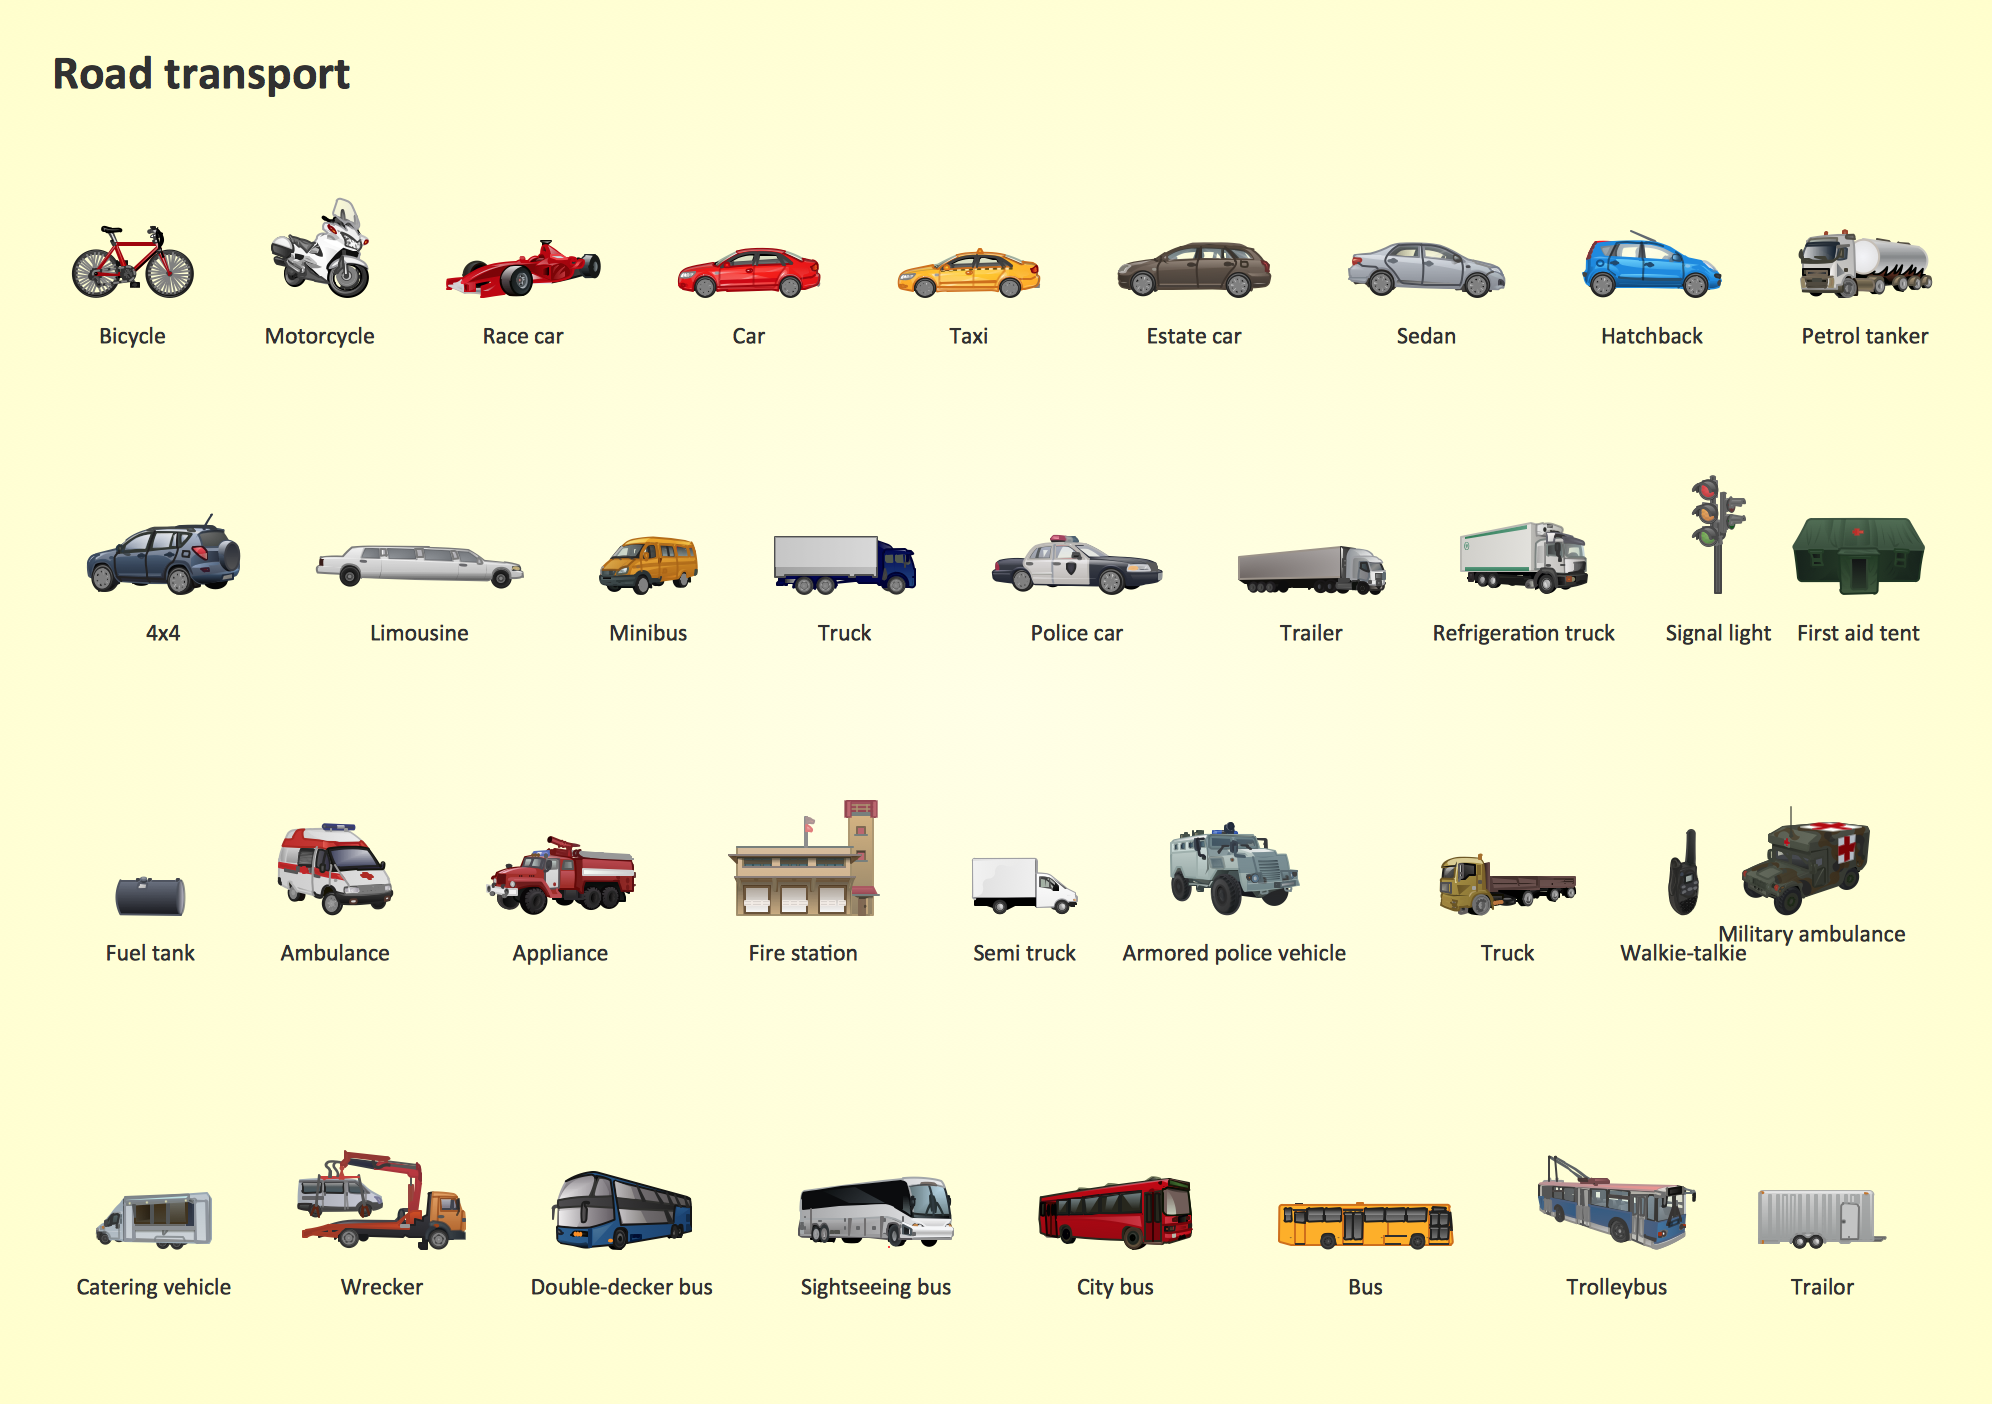
Sample 9. Design Pictorial Infographics — Transport Pictograms
Using the Transport Pictograms library from the Pictorial Infographics solution with 23 vector pictograms of various transport you can create the illustrated thoroughfare schemes, maps, etc.

Sample 10. Design Infographics — Travel and Tourism Pictograms
The Travel and Tourism Pictograms library from the Pictorial Infographics solution that contains 20 travel-related vector pictograms is simply irreplaceable for tourist companies and agencies.

Sample 11. Design Pictorial Infographics — Tourism in the World
This sample was created in ConceptDraw DIAGRAM using the Ecology Pictograms, Travel and Tourism Pictograms, Shopping Pictograms, Business People Pictograms, and People Pictograms Libraries from the Pictorial Infographics Solution and illustrates the sample pictorial chart of tourism around the world.
Pictorial Infographics solution also provides large collection of sample infographics and templates to be filled in. When you design pictorial infographics illustrations, you can use the offered templates and samples as the base for your own pictorial infographics documents, or create them de novo simply dragging the pictograms from the libraries and adding the text. You are free to use the predesigned pictograms as you like - separately, combine them, impose one pictogram on top of another, rotate, copy, etc.
All source documents are vector graphic documents. They are available for reviewing, modifying, or converting to a variety of formats (PDF file, MS PowerPoint, MS Visio, and many other graphic formats) from the ConceptDraw STORE. The Pictorial Infographics Solution is available for all ConceptDraw DIAGRAM or later users.