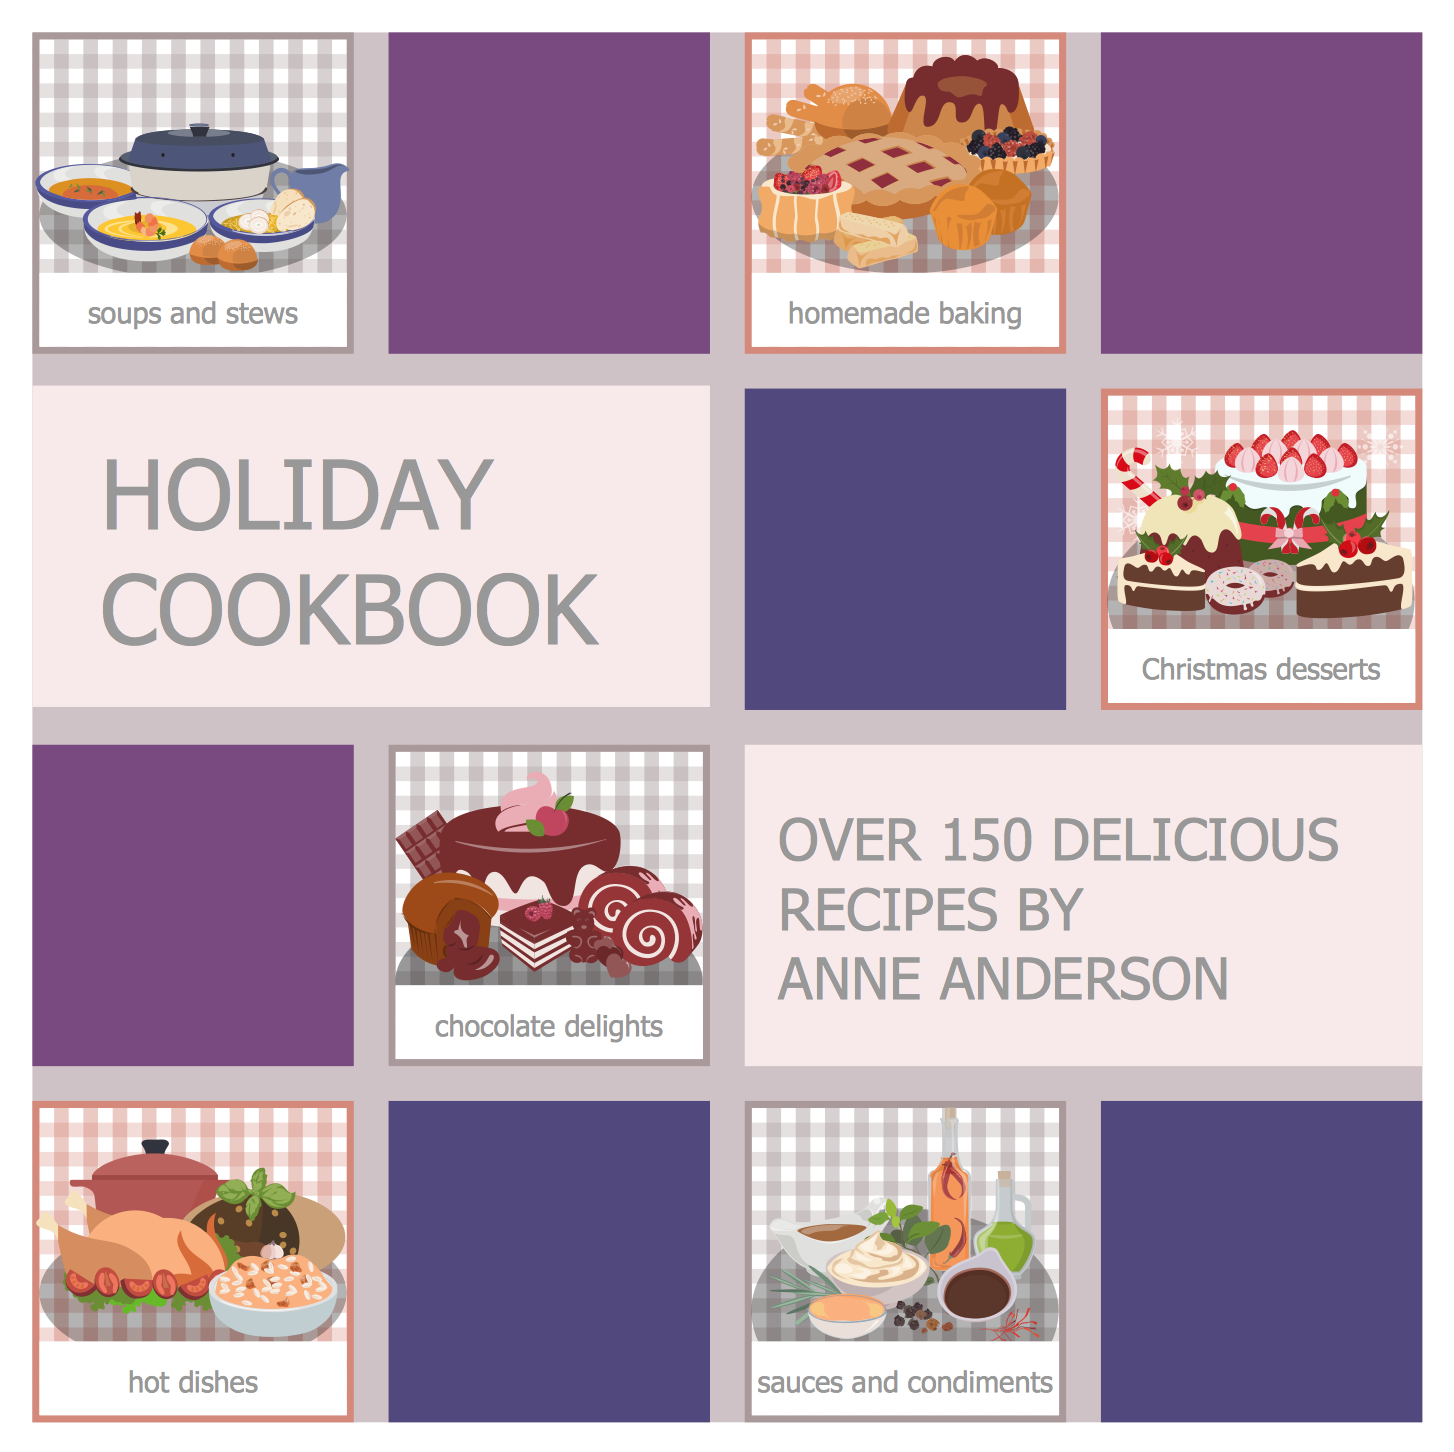
Example 1. Cookbook of Holiday Recipes
Cooking Recipes Solution offers for ConceptDraw DIAGRAM users powerful drawing tools, numerous libraries with predesigned vector objects, the set of ready samples on cooking thematic. All these tools make ConceptDraw DIAGRAM software the best for easy designing illustrations with holiday recipes and about cooking and decoration the tasty dishes.

Example 2. Holiday Table Setting
The following 14 libraries with 565 vector objects are included in Cooking Recipes Solution and available from ConceptDraw STORE:
- Bread and Baking
- Breakfast
- Cooking Appliances
- Cookware and Bakeware
- Desserts
- Drinks
- Fish, Seafood, Sushi
- Kitchen Knifes, Spoons and Forks
- Kitchen Utensils
- Meats
- Salads, Side Dishes and Vegetables
- Soups, Stocks, Stews, and Sauces
- Spices, Herbs, Condiments
- Tableware
All that you need to design your own holiday recipe is create new ConceptDraw document, add text of your recipe, and decorate your illustration by simply dragging desired objects from these libraries to your document.

Example 3. Holiday Recipes - Chocolate Cake
The samples you see on this page were created in ConceptDraw DIAGRAM software using the Cooking Recipes Solution and demonstrate the images with various holiday recipes. An experienced user spent 10-15 minutes creating each of these samples.
Use the tools of the Cooking Recipes Solution for quick, easy and effective illustration daily and holiday recipes of any detailing.
All source documents are vector graphic documents. They are available for reviewing, modifying, or converting to a variety of formats (PDF file, MS PowerPoint, MS Visio, and many other graphic formats) from the ConceptDraw STORE. The Cooking Recipes Solution is available for all ConceptDraw DIAGRAM users.
TEN RELATED HOW TO's:
Working with personnel might be difficult if you are not prepared enough. To explain your workers all the details of communication with customers, you can draw an order process flowchart which will describe every step of the process and answer all the questions that might appear. You can view a lot of business process mapping diagram examples here, in ConceptDraw Solution Park.
This business process flow chart is created to illustrate the sample work order process. Before an organization can make some work for a person, the customer work order request must be completed. It is needed for tracking and accountability objectives. We used this business process flowchart to show a certain tasks and actions assumed by an organization. This flowchart depicts the outside inputs that are needed to launch a process, and ways the organization delivers its outputs. This business process flowchart was created with a help of ConceptDraw Business Process Mapping solution.
Picture: Work Order Process Flowchart. Business Process Mapping Examples
Related Solution:
Pictures of Food represented on the food court signboards, show-cases, at the menus form the cafe style and attract clients. Bright, colorful and effective advertising increases the chance of visiting exactly this cafe among many in the food court. When visiting fast food at the food court, a potential client is enough to throw just a glance at the menu-board. ConceptDraw DIAGRAM software offers the Food Court solution from the Food and Beverage area of ConceptDraw Solution Park for easy designing unique pictures of food.
Picture: Pictures of Food
Related Solution:
Infrastructure is very important part of any district, and educational buildings presence is one of the factors. Another not less important thing is the school design, because it influences the children's’ sense of aesthetics. To develop a harmonic school layout, use a proper software.
This image represents the School layout library that is supplied with ConceptDraw School and Training Plans solution. The library contains a set of vector graphic objects that will be in help while drawing a layout of classroom. Any lecturer desires to organize the layout of the classroom for the best student advantage. Students must be focused and be engaged in the learning process. The classroom places organization is an important element of a students learning. It is significant for a lecturer to set up a classroom layout and change it time to time to support lectures, to invoke disputes or solve any organizational issues. By using ConceptDraw DIAGRAM you can easily plan how to re-arrange the desks in the class room to maintain visual control of your class and build a friendly environment in the classroom.
Picture: Building Drawing Software for Design School Layout
Related Solution:
But it never matters which hotel plan you want to illustrate in a way of a floor plan, you can always do it with ConceptDraw DIAGRAM especially it can be simple to do having the “Floor Plans” solution, which can be downloaded from the Building Plans area of ConceptDraw Solution Park.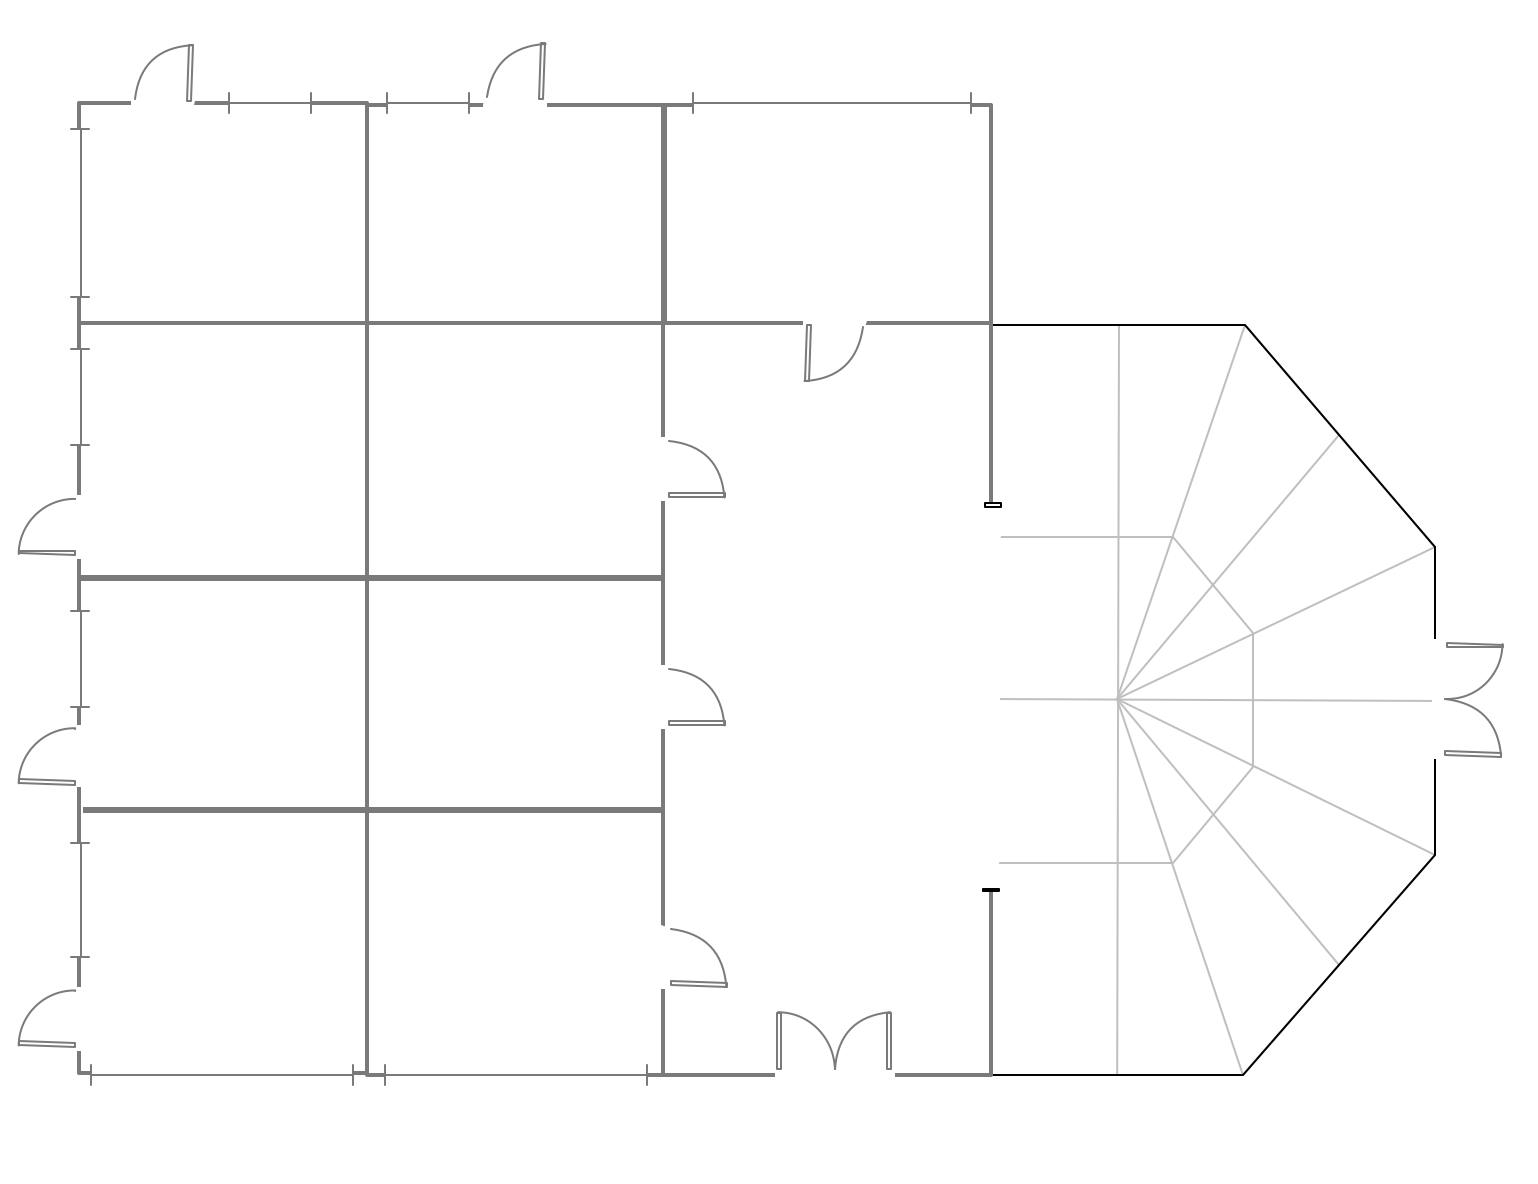
Picture: Mini Hotel Floor Plan. Floor Plan Examples
Related Solution:
Restaurant business is one of the most popular and actively developing business in the world. Advertising and marketing are an integral part of its development.
Use the ConceptDraw DIAGRAM software extended with Food Court solution from the Food and Beverage area of ConceptDraw Solution Park for easy drawing professional looking, colorful and attractive food and beverage illustrations!
Picture: Food and Beverage
Related Solution:
The Onion Diagram is a type of circular diagram which consists of the core circle and concentric circles that look like the cross sections of onion. The key value of the Onion Diagram is to visually demonstrate the relationships that lead to a successful final product or deliverable.
Design of Onion Diagrams and Stakeholder Onions Diagrams is a complex process, but ConceptDraw DIAGRAM diagramming and vector drawing software makes it easier thanks to the Stakeholder Onion Diagrams Solution from the Management Area of ConceptDraw Solution Park, and the set of included libraries and Onion Diagram templates.
Picture: Onion Diagram Templates
Related Solution:
Create value stream maps - for value stream analysis and value stream management, material and information flow mapping, using our quick start templates included with ConceptDraw.
Picture: Best Value Stream Mapping mac Software
Related Solution:
Creation of various types of Integration DEFinition (IDEF) diagrams - IDEF0, IDEF1X, IDEF2, IDEF3 and many other is a sufficiently complex process that requires powerful automated tools. ConceptDraw DIAGRAM diagramming and vector drawing software offers you such tool - IDEF Business Process Diagrams solution from the Business Processes area of ConceptDraw Solution Park.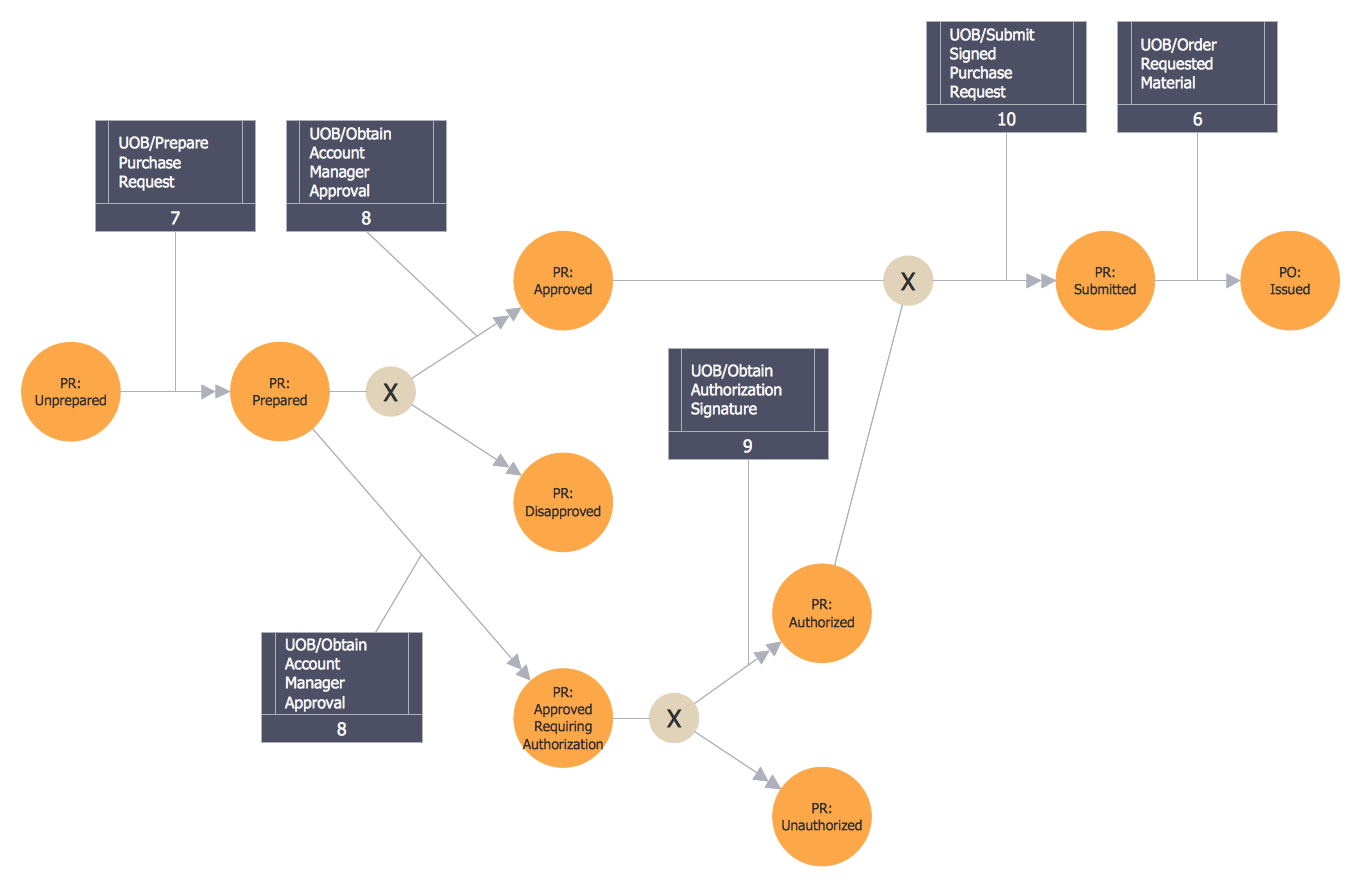
Picture: Integration Definition
Related Solution:
ConceptDraw DIAGRAM is a drawings software for creating Nature scenes. Nature solution from ConceptDraw Solution Park expands this software with a new library that contains 17 vector objects and samples illustration files.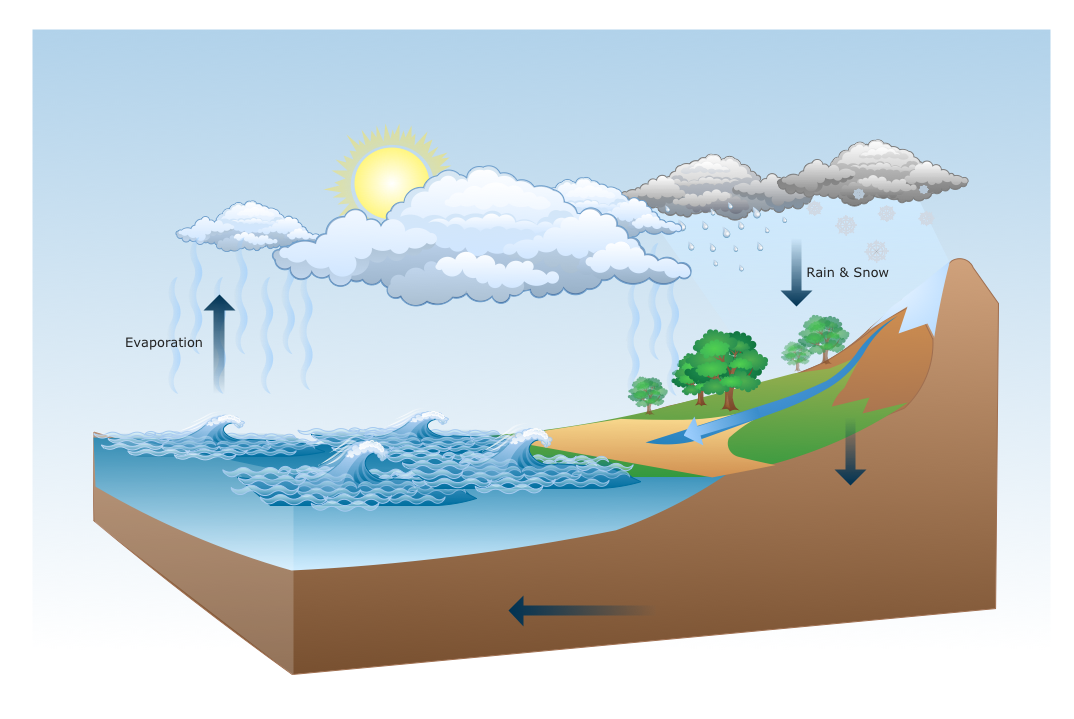
Picture: Drawing a Nature Scene
ConceptDraw DIAGRAM is the best program to make workflow diagrams. With the new Arrows10 technology it brings features allow you make workflow diagrams faster then ever before. These features allow you to focus on thinking, not drawing, that makes ConceptDraw DIAGRAM the best program to make workflow diagrams.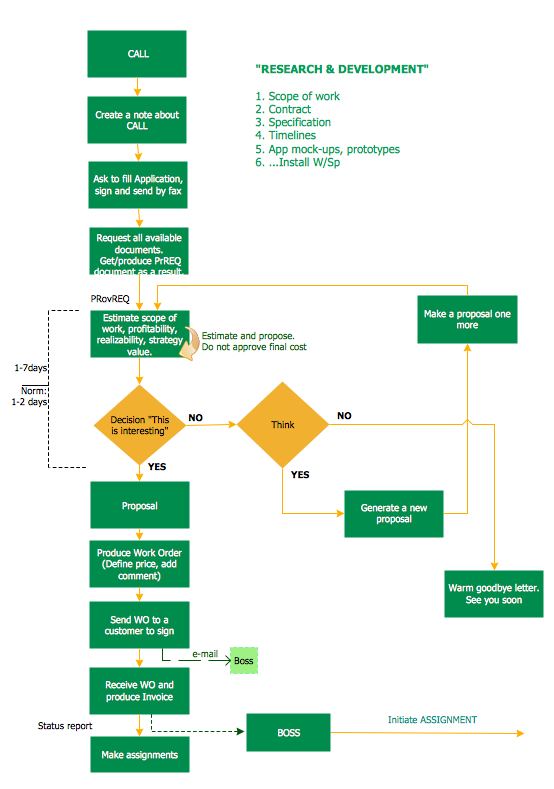
Picture: Best Program to Make Workflow Diagrams
Related Solution:

