
Example 1. Healthy Meal Recipes - Low Sodium School Meals
Health Food Solution was specially designed to give you the opportunity to illustrate your healthy meal recipes in minutes. This solution contains 8 libraries with 238 vector objects. All what you need is simply create new document and drag desired objects from the libraries to make your own professional looking and appetizing meal illustration.

Example 2. Health Food Solution in ConceptDraw STORE
Thanks to the Health Food solution, you have also another way to create your illustrations with healthy meal recipes - to make them on the base of predesigned samples. The set of professionally designed samples and examples is also included in Health Food solution and available from ConceptDraw STORE.

Example 3. Healthy Meal Recipes - Marshmallow Dietary Preferences
The samples you see on this page were created in ConceptDraw DIAGRAM software using the predesigned objects from the libraries of Health Food Solution. An experienced user spent 10-15 minutes creating each of these samples in ConceptDraw DIAGRAM
Use the predesigned objects from the libraries of Health Food Solution for drawing your own illustrations for healthy meal recipes quick, easy and effective.
All source documents are vector graphic documents. They are available for reviewing, modifying, or converting to a variety of formats (PDF file, MS PowerPoint, MS Visio, and many other graphic formats) from the ConceptDraw STORE. The Health Food Solution is available for all ConceptDraw DIAGRAM users.
NINE RELATED HOW TO's:
There are many tools to manage a process or to illustrate an algorithm or a workflow. Flowcharting is one of those tools. However, it may be difficult to show complex processes that require multiple attributes or several people in a simple flowchart, so a cross-functional flowchart would be a solution for that situation. To create such flowchart, group processes and steps to labeled rows or columns, and divide those groups with horizontal or vertical parallel lines. It is worth mentioning that there are different types of cross-functional flowcharts, like opportunity or deployment flowchart.
This diagram shows a cross-functional flowchart that was made for a trading process. It contains 14 processes, distributed through 5 lines depicting the participants who interact with the process. Also there are connectors that show the data flow of information between processes. The cross-functional flowchart displays a detailed model of the trading process, as well as all participants in the process and how they interact with each other. The lines in the flowchart indicates the position, department and role of the trading process participants.
Picture: Cross-Functional Flowchart
Related Solution:
While creating flowcharts and process flow diagrams, you should use special objects to define different statements, so anyone aware of flowcharts can get your scheme right. There is a short and an extended list of basic flowchart symbols and their meaning. Basic flowchart symbols include terminator objects, rectangles for describing steps of a process, diamonds representing appearing conditions and questions and parallelograms to show incoming data.
This diagram gives a general review of the standard symbols that are used when creating flowcharts and process flow diagrams. The practice of using a set of standard flowchart symbols was admitted in order to make flowcharts and other process flow diagrams created by any person properly understandable by other people. The flowchart symbols depict different kinds of actions and phases in a process. The sequence of the actions, and the relationships between them are shown by special lines and arrows. There are a large number of flowchart symbols. Which of them can be used in the particular diagram depends on its type. For instance, some symbols used in data flow diagrams usually are not used in the process flowcharts. Business process system use exactly these flowchart symbols.
Picture: Flowchart Symbols: Meaning and Examples
Related Solution:
How to draw Metro Map style infographics of New York subway.
New York Subway has a long history starting on October 27, 1904. Since the opening many agencies have provided schemes of the subway system. At present time are 34 lines in use. This page present New York City subway map construct with Metro Map Solution in Conceptdraw DIAGRAM software. This is a one-click tool to add stations to the map. It lets you control the direction in which you create new stations, change lengths, and add text labels and icons. It contains Lines, Stations, and Landmarks objects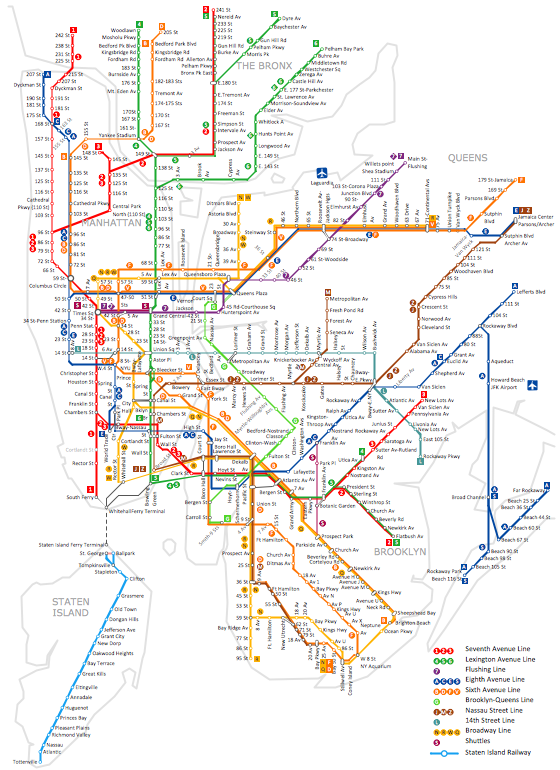
Picture: How to draw Metro Map style infographics? (New York)
Related Solution:
This sample shows the Spider Chart that represents the budget and spending for one organization and allows to compare them. The multivariate data are represented on the Spider Chart as a two-dimensional chart with four or more variables displayed on the axes that start in one point. The Spider Charts are used in the management, business and sport.
Picture: Spider Chart Template
This sample was created in ConceptDraw DIAGRAM diagramming and vector drawing software using the UML Deployment Diagram library of the Rapid UML Solution from the Software Development area of ConceptDraw Solution Park.
This sample shows the work of the ATM (Automated Teller Machine) banking system that is used for service and performing of the banking transactions using ATMs. System engineers can use comprehensive UML diagrams solution.
Picture: UML Deployment Diagram Example - ATM SystemUML diagrams
Related Solution:
ConceptDraw MindMap benefits comparing to Mindjet Mindmanager:
Economical. (Lower license price, support is no charge maintenance is an optional one-time fee that delivers to you the next major release) ConceptDraw products are structured to save you money from the date of purchase for the life of the product. When you compare ConceptDraw MINDMAP to Mindjet Mindmanager the cost savings will be obvious.
Flexible Licensing. ConceptDraw is licensed per-named-user. Want ConceptDraw on 2 PCs, 2 Macs, or a PC and a Mac? Straightforward licensing makes this easy.
Picture: Looking at ConceptDraw MINDMAP as a Replacement for Mindjet Mindmanager
Related Solutions:
ConceptDraw DIAGRAM is a business flowchart software includes the wide flowchart examples package.
Picture: Basic Flowchart Examples
Related Solution:
Create flowcharts, org charts, shipping flowcharts, floor plans, business diagrams and more with ConceptDraw. Includes 1000s of professional-looking business templates that you can modify and make your own.
Picture: Basic Diagramming
Related Solution:
ConceptDraw DIAGRAM diagramming and vector drawing software offers a Cooking Recipes solution from the Food and Beverage area with wide capabilities for fast and easy design pictorial, bright and inspiring illustrations for various recipes - daily, holiday and party recipes, for pictorial representation dishes in menus of restaurants and cafes, for designing cookbooks, menu sets, food posters and promo materials.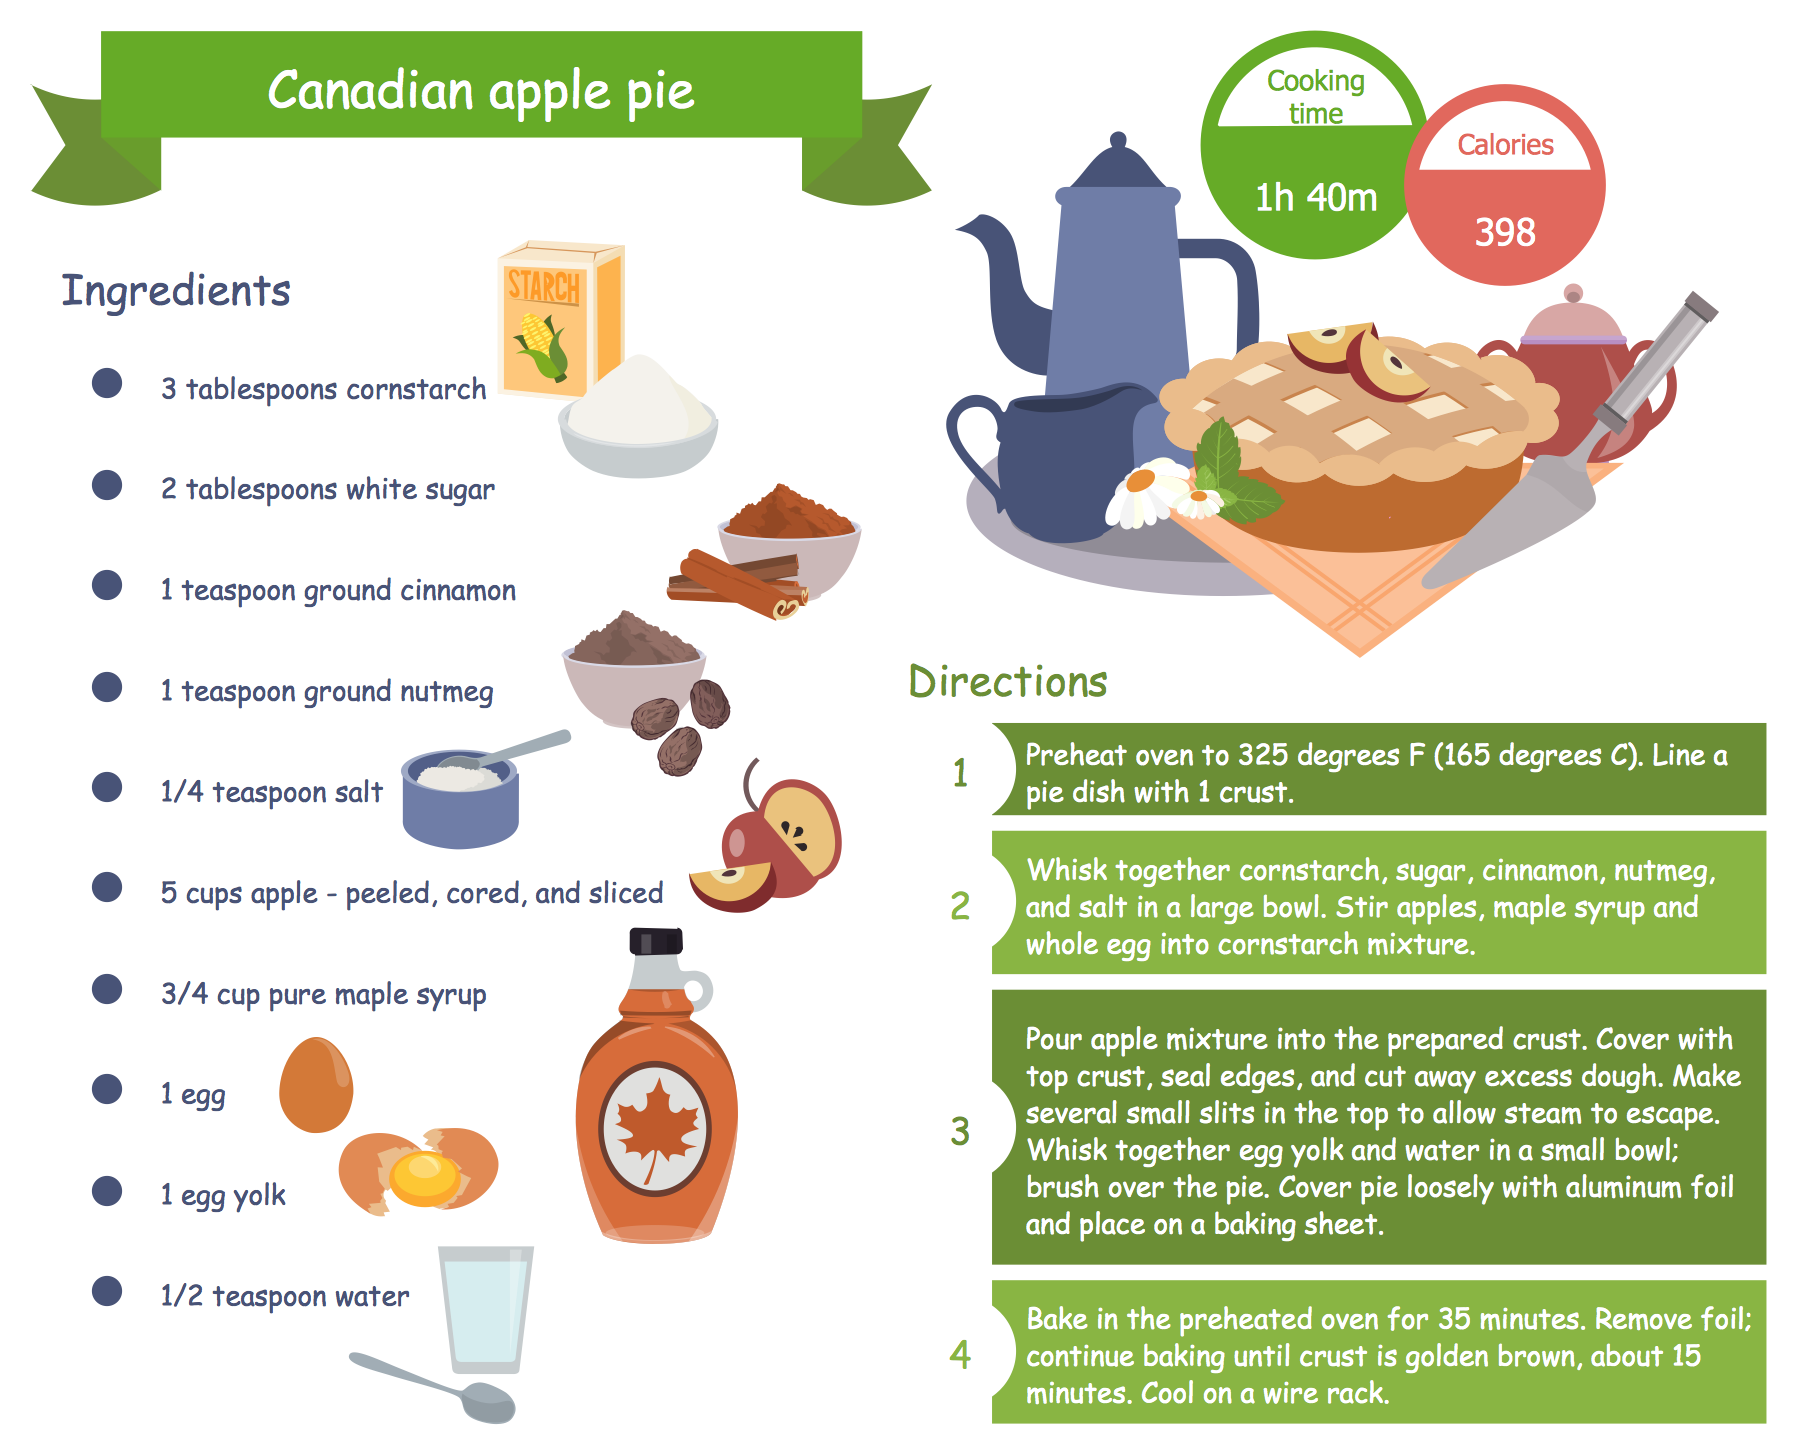
Picture: Party Recipes
Related Solution:

