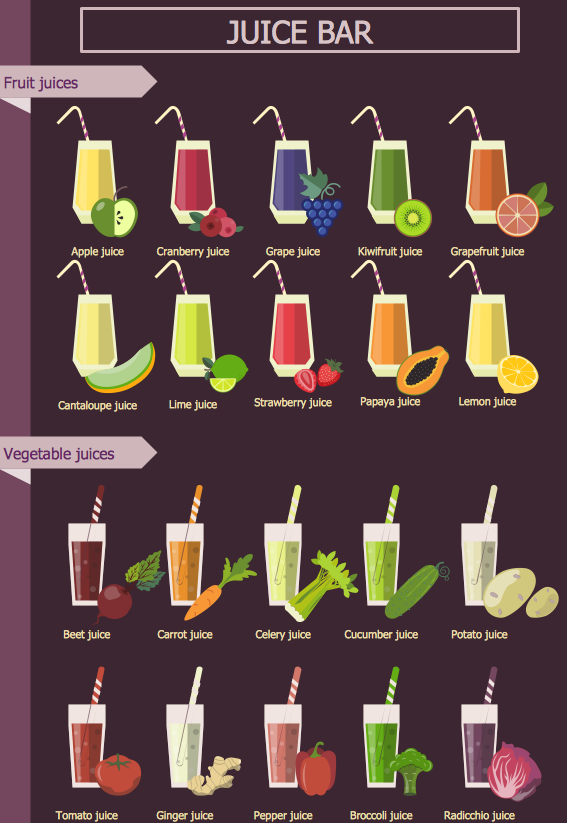
Example 1. Pictures of Vegetables
Food Court Solution is rich for the powerful tools which will easier drawing attractive and successful food and beverage images. It provides 7 libraries containing 201 predesigned clipart and pictures of vegetables, fruits, drinks, desserts, meat, fast foods, and other dishes and beverages.

Example 2. Vegetables Library Design Elements
On this image you can see a Vegetables library of Food Court solution which contains 36 ready-to-use vector objects of vegetables. Each of them can be easy dragged from the library to your document. These pictures of vegetables are beautiful and bright, the objects from the other libraries of Food Court solution are equally attractive and colorful.
Food Court solution includes also large collection of stunningly beautiful and carefully thought-out examples and samples. All they are available for viewing and editing from ConceptDraw STORE. Each of them can become the good base for your own food illustration.

Example 3. Fruit and Vegetables Consumption Infogram
The samples you see on this page were created in ConceptDraw DIAGRAM software using the Food Court Solution. An experienced user spent 10-15 minutes creating each of these food images and pictures of vegetables.
Use the tools of unique Food Court Solution for ConceptDraw Solution Park to design your own attractive F&B illustrations fast, easy and effective.
All source documents are vector graphic documents. They are available for reviewing, modifying, or converting to a variety of formats (PDF file, MS PowerPoint, MS Visio, and many other graphic formats) from the ConceptDraw STORE. The Food Court Solution is available for all ConceptDraw DIAGRAM users.
TEN RELATED HOW TO's:
This sample shows the Pie Donut Chart. It was created in ConceptDraw DIAGRAM diagramming and vector drawing software using the ready-to-use object from the Pie Charts Solution from Graphs and Charts area of ConceptDraw Solution Park.
The Pie Donut Chart visualizes the percentage of parts of the whole and looks like as a ring divided into sectors. Pie Donut Charts are widely used in the business, statistics, analytics, mass media.
Picture: Pie Donut Chart. Pie Chart Examples
Related Solution:
As restaurant industry is growing rapidly nowadays, researches show that almost half of the adults have worked in a restaurant or a cafe. Moreover, many of them dream to start their own someday. Unfortunately, it takes a lot of time to write a business plan and to find a great location, although some know how to create a restaurant floor plan in minutes or how to plan budget effortlessly. Hiring employees can also cause a lot of headache, but this is crucial for further success, because every guest comes to restaurant for a good service and delicious food. It is also worth noting that restaurant concept is also important, because it defines target audience and influences the menu.
This diagram represents the floor plan of an ongoing sports-theme establishment - restaurant, cafe, or other food service. A number of widescreen monitors installed along the perimeter provide visitors the opportunity to follow the course of a match from anywhere in the dining room of restaurant or cafe. The most of sports fans believe that food and alcohol is a big part of any sports show. That is why the dining room takes the most space - almost 60% of the total establishment space. Nearly all sports fans consume beverages while watching sports - beer, soda or water at least. Thus, the restaurant floor plan designers added a large lavatory there. Moreover, project developers considered unnecessary the gender division of such delicate place - perhaps they guess that only men are watching football, or believe that alcohol will eliminate the most of gender differences.
Picture: How To Create Restaurant Floor Plan in Minutes
Related Solution:
When studying a business process or system involving the transfer of data, it is common to use a Data Flow Diagram (DFD) to visualize how data are processed. Being initially used exclusively in regards to the flow of data through a computer system, now DFDs are employed as the business modeling tools. They are applied to describe the business events and interactions, or physical systems involving data storage and transfer. ConceptDraw DIAGRAM is a powerful Data Flow Diagram software thanks to the Data Flow Diagrams solution from the Software Development area of ConceptDraw Solution Park.
Picture: Data Flow Diagram Software
Related Solution:
This sample shows the Business Report Pie Chart. The Pie Chart visualizes the data as the proportional parts of a whole, illustrates the numerical proportion. Pie Charts are very useful in the business, statistics, analytics, mass media.
Picture: Business Report Pie. Pie Chart Examples
Related Solution:
No building project can exist without an electrical circuit map. It’s more convenient to develop electrical drawing with a proper software which would contain vector shapes and electrical symbols. This will help in the future if any problems appear.
This circuit diagram shows the scheme of a location of components and connections of the electrical circuit using a set of standard symbols. It can be use for graphical documentation of an electrical circuit components. There are many of different electric circuit symbols that can be used in a circuit diagram. Knowing how to read circuit diagrams is a useful skill not only for professionals, but for any person who can start creating his own small home electronic projects.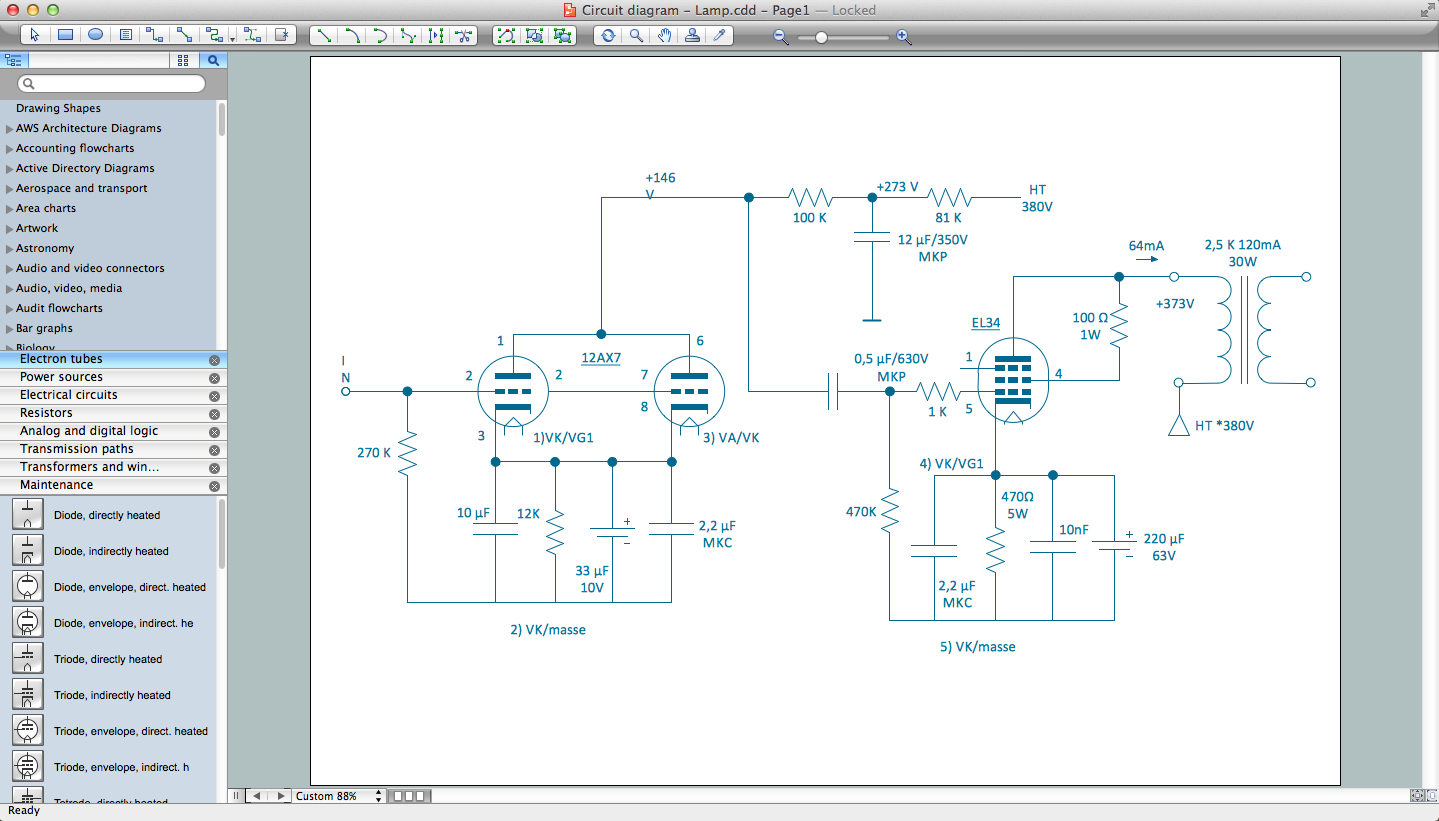
Picture: Electrical Drawing Software and Electrical Symbols
Related Solution:
Electrical Diagram is a visual graphical representation of an electrical circuit. ConceptDraw DIAGRAM diagramming and vector drawing software supplied with unique Electrical Engineering Solution from the Industrial Engineering Area will help you design Electrical Diagram of any complexity without efforts.
Picture: Electrical Diagram
Related Solution:
Visio Files and ConceptDraw. ConceptDraw DIAGRAM is compatible with MS Visio.VDX formatted files.VDX is Visio’s open XML file format, and it can be easily imported and exported by ConceptDraw DIAGRAM.
Picture: Visio Files and ConceptDraw
If you ever wanted to try any diagramming tools except of Visio, but were afraid to lose existing documents, there’s good news for you. One of the most striking features of ConceptDraw DIAGRAM is it’s perfect compatibility with MS Visio, which guarantees that you won’t depend on operating system anymore, because another ConceptDraw DIAGRAM feature is that it’s cross-platform tool. Don’t waste your time looking for other options, you’ve found the solution already!
Business professionals often utilize the MS Visio as a common tool for making various issues on business visualization. MS Visio is a strong software with good capacity to maintain complex business solutions. But there is no MS Visio for Apple OS X. This is a large invocation, and one would be pleased to recognize that ConceptDraw DIAGRAM is the ideal alternative to MS Visio. Primarily, because this software works natively on both Windows and Apple OS X platforms. if you have migrated from Windows to Mac, or need to communicate in a cross-platform conditions, you’ll search for MS Visio replacer. ConceptDraw DIAGRAM is the exclusive professional business diagramming application that runs on both Windows and Apple OS X. The opportunity exchange files between PC and Mac, as well as between ConceptDraw DIAGRAM and Visio is the significant advantage that permits you to display and to collaborate business information in effortless and cost-effective way.
Picture: ConceptDraw DIAGRAM Compatibility with MS Visio
ConceptDraw DIAGRAM diagramming and vector drawing software extended with unique SCRUM Workflow solution from the Project Management area of ConceptDraw Solution Park allows fast and easy design professional-looking Scrum Workflow Diagrams and Scrum workflow scheme for projects required when working on projects and managing them, when developing software with cutting-edge Agile methodologies.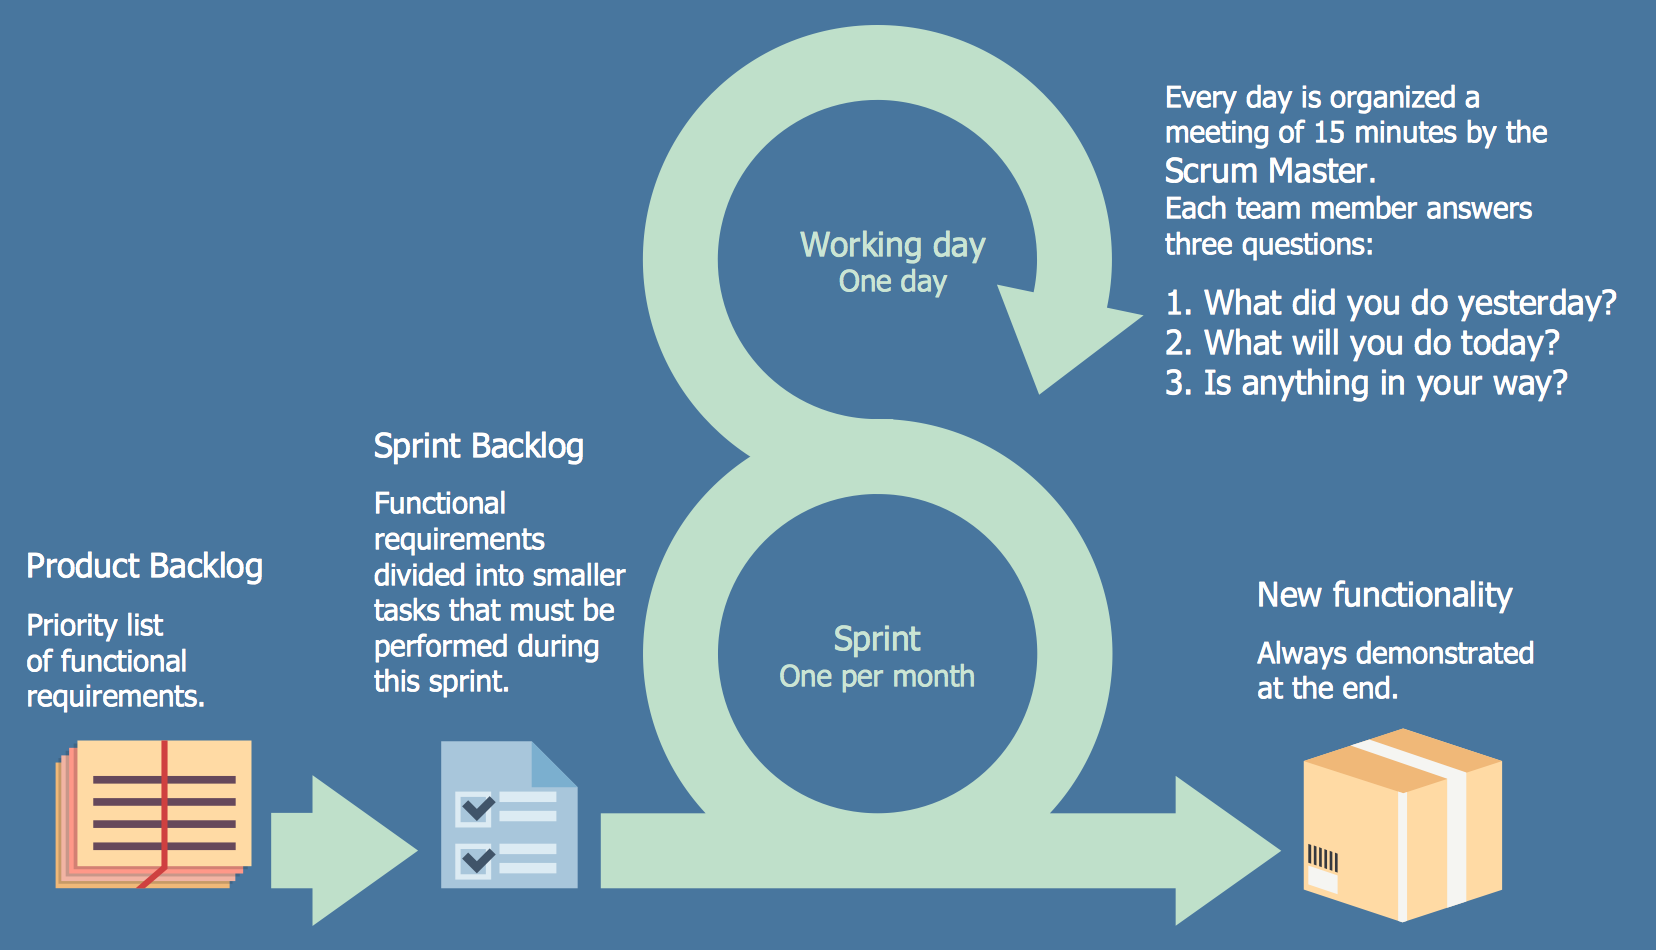
Picture: Scrum workflow
Related Solution:
Nature solution expands this software possibilities to create beautiful illustrations diagrams with the new library which contains 17 vector objects.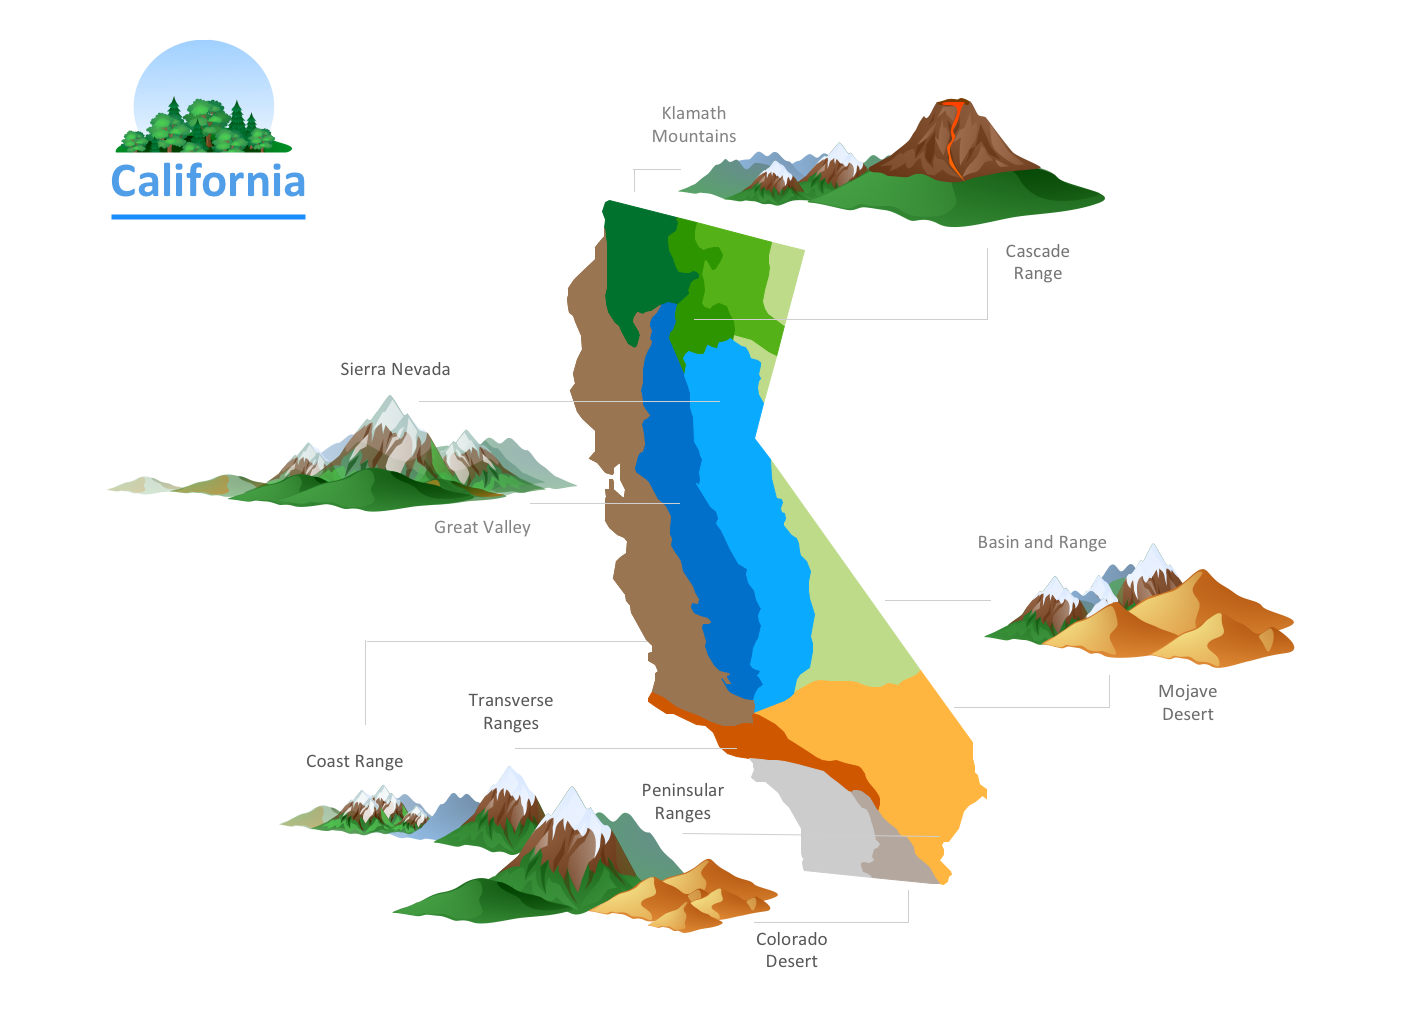
Picture: Nature Drawings - How to Draw

