Entity Relationship Diagram Examples
Crow’s Foot and Chen's notation examples
Creating the entity-relationship (ER) model by visually representing the structure of some database, mainly the business one, which data equates to its entities (or objects) that are connected by relationships showing requirements and dependencies, you need proper software to provide you with the symbols necessary in this case.
ConceptDraw DIAGRAM мector drawing and diagramming software allows you to make any of needed models, plans, charts, diagrams with help of our application STORE where lots of layouts can be found as well as samples and templates of the flowcharts depending on the business sphere you work in and requirements you have. You can also find examples of ERD in Solutions here on this site in order to make it look really smart. Making entity-relationship diagram based on the Chen ERD notation is simple now having ConceptDraw DIAGRAM and you can check it yourself once you download and use it. Advice your colleagues and your friends, business partners, in order to simplify their lives as well as yours making the charts looking professional and simply sophisticated. Because we guarantee the quality of our great software developed to please everyone who needs this product in their work.

Example 1. ERD Example — Chen Diagram
This sample diagram is one of ER Diagram examples included to Entity-Relationship Diagram (ERD) solution. It shows the type of icons and graphics you can use to develop a model of a database of arbitrary complexity according to Chen's notation.

Example 2. ERD Example — Crows's Foot diagram
This sample diagram was created using the drawing tools of Entity-Relationship Diagram (ERD) solution and shows the type of icons and graphics you can use to develop a model of a database of arbitrary complexity using Crow's Foot notation.

Example 3. Entity Relationship Model Diagram — Crows's Foot notation
This sample demonstrates an Entity-relationship model diagram. Highlight the boxes in the ERD diagram with bright colors to make it attractive and easy to remember.

Example 4. Crows's Foot ERD notation — Students and Teachers
This Entity-Relationship Diagram shows the relationships between the Students and Teachers entities. Drawing all entities of ER-diagram in one color spectrum, highlighting the headers, you will make your diagram look stylish and then successfully use it in different conferences, discussions, publications.

Example 5. Chen ERD notation — WordPress File reference
This ERD example shows an Entity-Relationship Diagram of a WordPress file reference using Chen’s Notation, which represents the entities as rectangles and attributes as ovals. Creating similar Entity Relationship Diagram examples and diagrams in ConceptDraw DIAGRAM will take just minutes.

Example 6. Chen ERD Template
This template from Entity Relationship Diagram (ERD) solution contains special objects and settings for creating entity relationship diagrams based on the Chen ERD notation.
How to Create an ERD Diagram
The ability to describe a database using the Entity-Relationship model is delivered by the Entity-Relationship Diagram (ERD) solution.
Open ConceptDraw STORE, check the ERD solution and click “Install”.
This solution extends ConceptDraw DIAGRAM with 2 libraries that contains 45 objects advocated by Chen's and Crow’s Foot notations that can be used when describing a database.

Pic. 1. ERD symbols - Chen's notation

Pic. 2. ERD symbols - Crow's Foot notation
- From the ConceptDraw STORE open the Chen's ERD, or the Crow's Foot ERD template from the ERD section.
- Add objects to the diagram by dragging them from the Chen's ERD, or the Crow's Fot ERD library to the document page.
- Use Clone tool
 (Mac),
 (Win) to quickly add copies of the selected object.
- Select the Smart Connector tool
 . To connect elements using this tool, drag the connector from one connect dot to another.
- Use Line, Fill, Shadow and Text tools to format diagram objects.

Example 6. Entity Relationship Diagram Examples
The ERD solution from ConceptDraw Solution Park extends ConceptDraw DIAGRAM ector graphics and diagramming software with the ability to describe a database using the Entity-Relationship model.
The ERD solution provides entity relationship diagram examples, templates and library of vector stencils.

Example 7. Entity Relationship Diagram solution
Entity Relationship Diagram examples from ERD solution for ConceptDraw DIAGRAM can be used as a start point for professional ERD drawing. Entity Relationship Diagram examples can be simply modified to illustrate the logical structure of exact database.
TEN RELATED HOW TO's:
Samples, templates and libraries contain vector clip art for drawing the Road Transport Illustrations.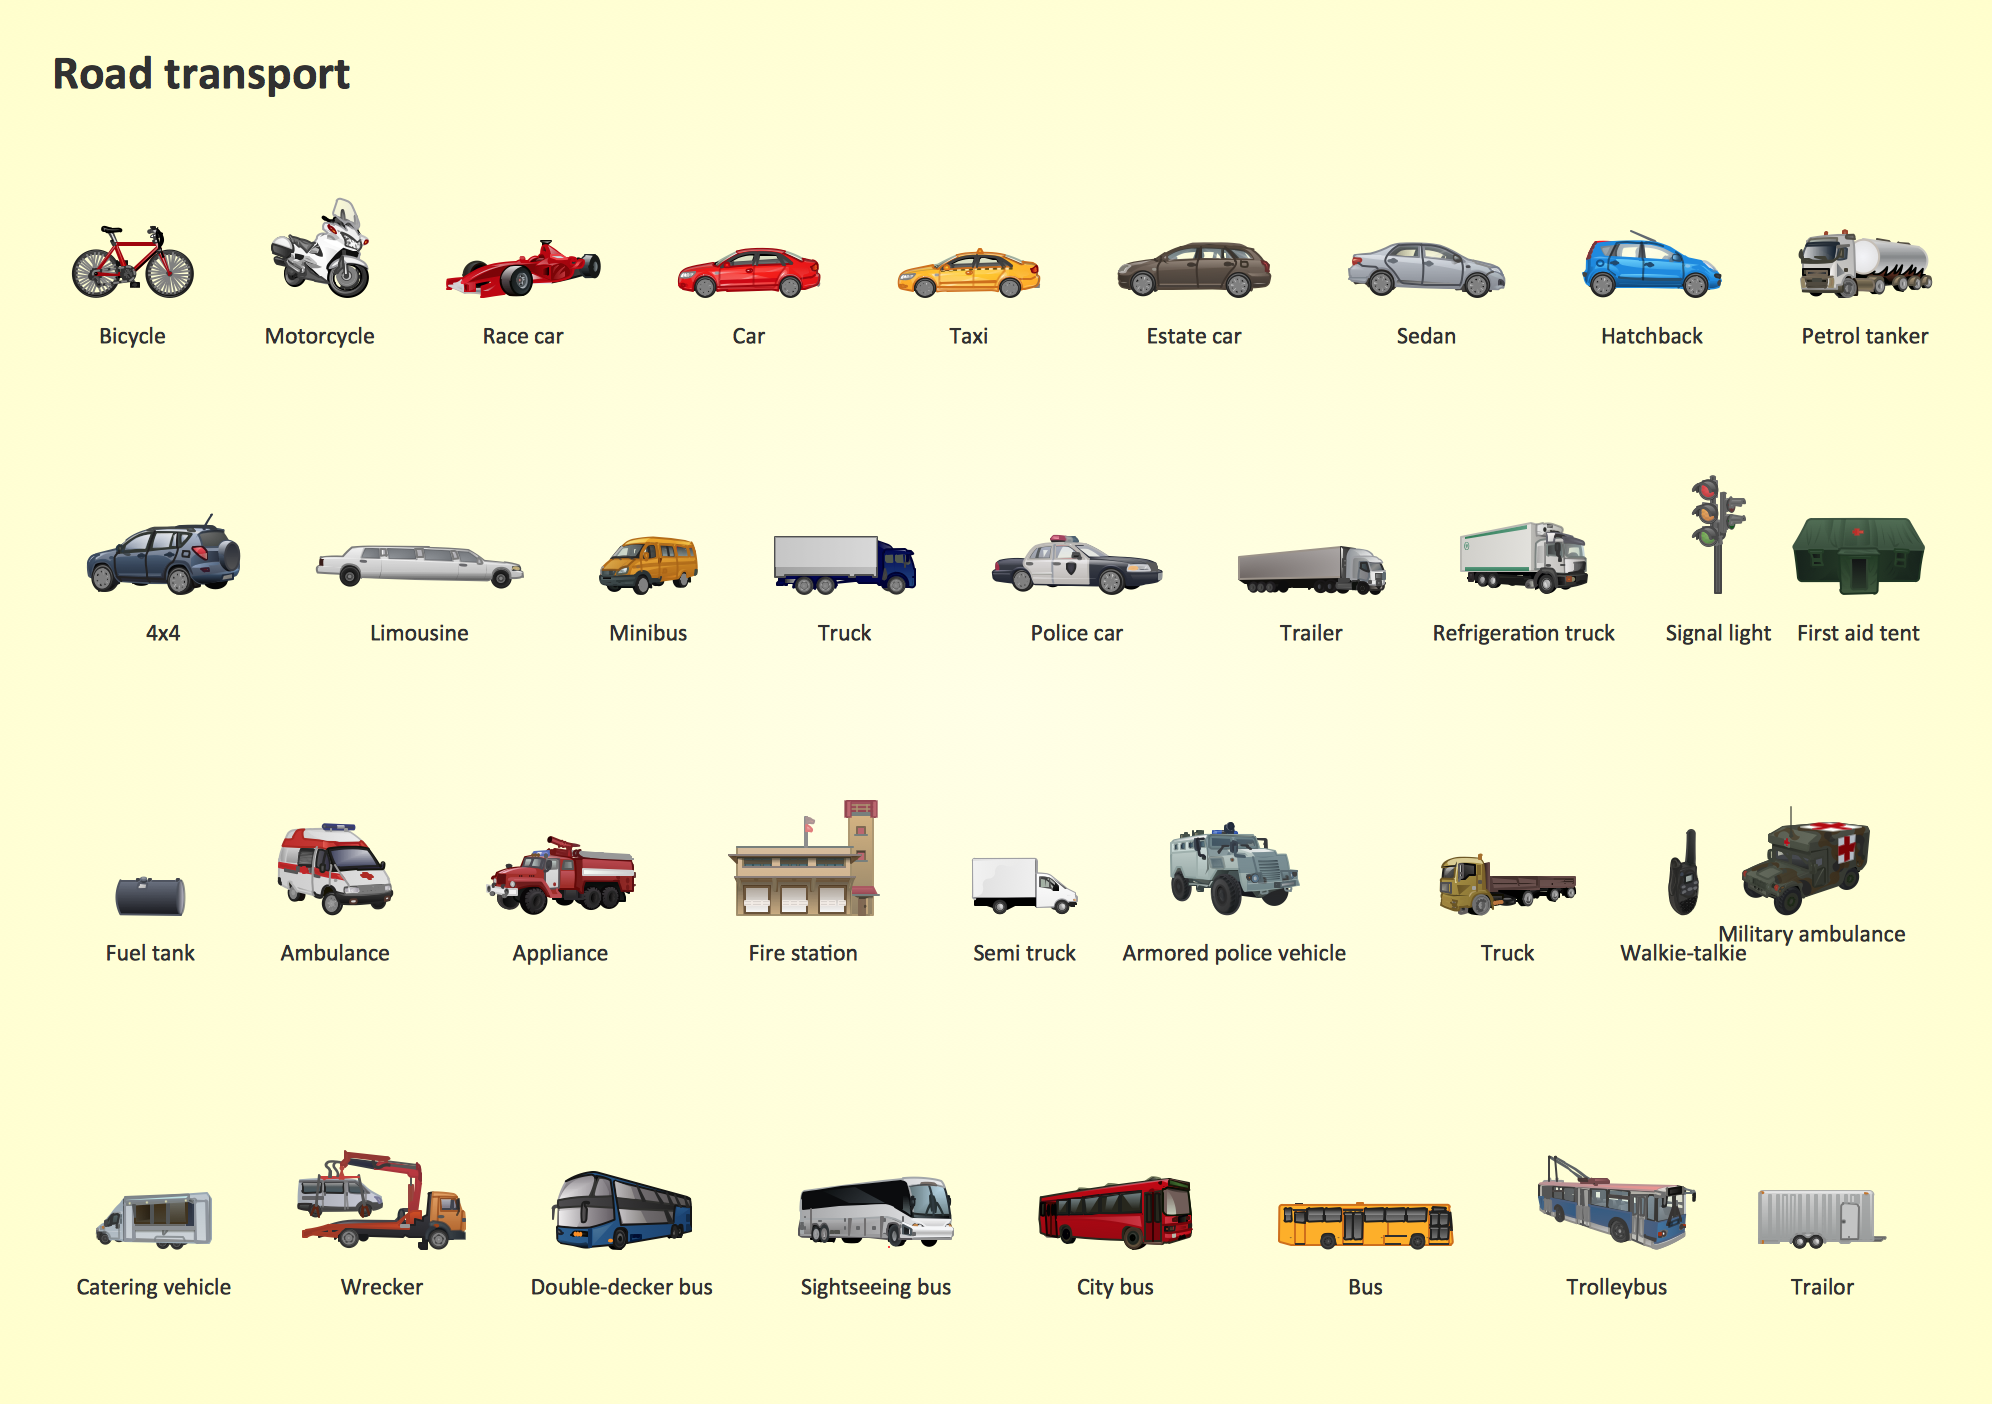
Picture: Road Transport - Design Elements
Related Solution:
This sample shows the concept of working of the transport company and is used by transport companies, carriers at the transportation of various goods.
Picture: UML Class Diagram Example for GoodsTransportation System
Related Solution:
You need design a Bank UML Diagram? Now, thanks to the ConceptDraw DIAGRAM diagramming and vector drawing software extended with ATM UML Diagrams Solution from the Software Development Area, you can design without efforts any type of Bank UML Diagram you want - Class, Activity, Communication, Component, Composite structure, Deployment, Interaction overview, Object, Package, Profile, Sequence, State machine, Timing, Use case.
Picture: Bank UML Diagram
Related Solution:
The vector stencils library Activity diagrams from the solution Rapid UML contains specific data modeling symbols for ConceptDraw DIAGRAM software.
Picture: Data Modeling Diagram
The ER diagram is constructed from the specific ERD graphic elements. There are used 2 types of ERD notations: Chen and Crow's Foot.
A complete set of work flow shapes, notation & symbols for ERD, entity relationship stencils, included in Entity-Relationship Diagram (ERD) solution for ConceptDraw DIAGRAM software, makes drawing diagrams based on ERD notation as smooth as possible.
Picture: Notation & Symbols for ERD
Related Solution:
AWS platform is great to develop reliable applications. If you are already aware of all the benefits that Amazon Web Services diagrams bring, then you'll need also a diagramming tool for architecture to share your vision. Luckily, ConceptDraw DIAGRAM has a special AWS Diagrams solution with vector icons and templates that are easy to edit.
The AWS architecture diagram, you see on this drawing, was designed using ConceptDraw Amazon Web Services Architecture Diagrams (AWS) solution. The 14 libraries, delivered with this solution introduces near 250 vector graphic images used to draw AWS Diagrams. The AWS Architecture Diagrams solution is a valuable tool for programmers, software architects and other IT professionals. It enables them to develop reliable applications with a high stage of interaction with AWS cloud.
Picture: Amazon Web Services Diagrams diagramming tool for architecture
A requisition form is one of the documents used for accounting in different manufacturing processes. There are two main types of requisition: a purchasing requisition and material requisition and difference between them is significant. Creating a flowchart might help you in understanding all the details of accounting process.
Flowcharts are a best visual method for dividing a large and complicated procedure into a several little clear pieces. The main value-ability of an effective flowchart is its simpleness. Material requisition flowcharts are used to document the process of relationships between the different departments and the purchasing department within an organization. The flow chart gives the step-by-step guide on how is carried out the procurement process of the materials necessary for the functioning of the organization. This type of flowchart along with many other business flowcharts, one can easy create using ConceptDraw Flowcharts solution.
Picture: Material Requisition Flowchart. Flowchart Examples
Related Solution:
It doesn’t matter what kind of business you have, a bar or a gym, there are common concepts for any of them. One of those concepts is accounting, and to facilitate the work with the figures, you can use accounting flowchart symbols and create a clear and representative scheme. You can create flowchart for auditing, tax accounting and even for planning your own budget.
A graphical tool for displaying successive processes is flowchart. This method is mostly suited to represent an accounting process. The sequence of steps in the accounting process usually consists of standard accounting procedures, that can be depicted by using a minimal number of symbols, applied for the basic flowcharting. The advanced opportunity to create professional Accounting Flow charts is provided by ConceptDraw Accounting Flowcharts solution. It includes contains a library of accounting flowchart symbols used when drawing the accounting process flow.
Picture: Accounting Flowchart Symbols
Related Solution:
UML Deployment Diagram depicts the physical deployment of artifacts on nodes (nodes are the existing hardware components, artifacts are the software components running on each node); and how the different pieces are connected.
Use ConceptDraw DIAGRAM with UML deployment diagram templates, samples and stencil library from Rapid UML solution to model the physical deployment of artifacts on nodes of your software system.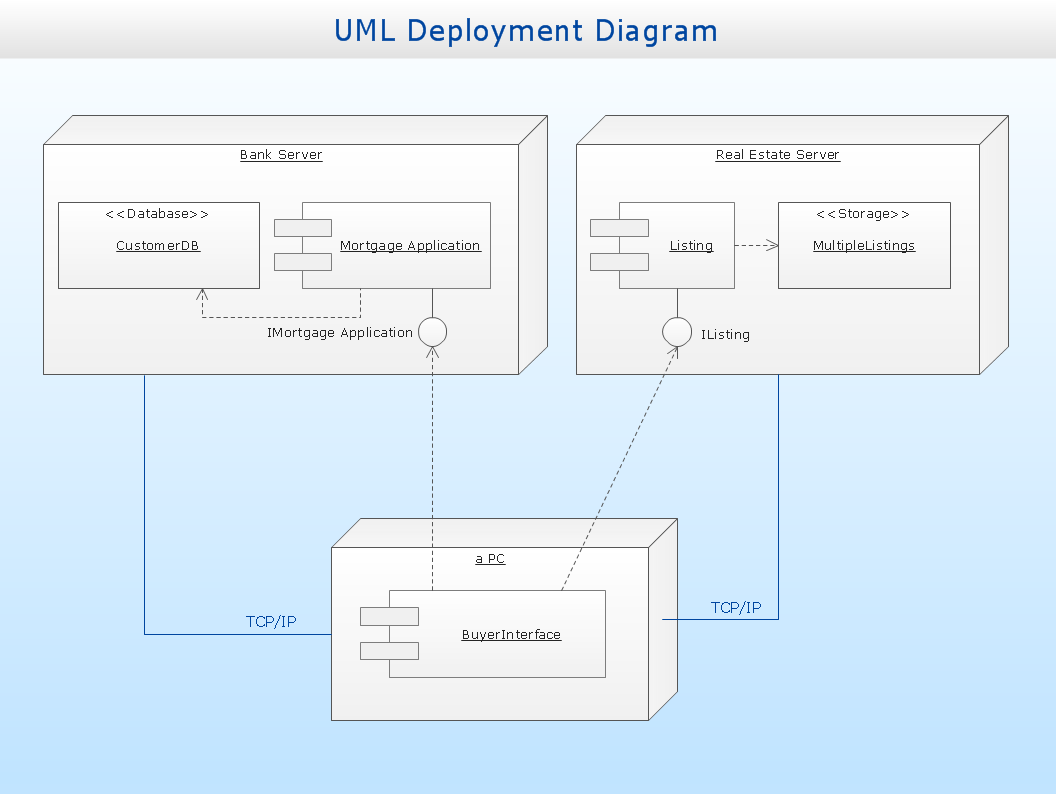
Picture: UML Deployment Diagram
Related Solution:
ConceptDraw DIAGRAM extended with IDEF0 Diagrams solution from the Software Development area of ConceptDraw Solution Park is a powerful diagramming and vector drawing IDEF0 software. All IDEF0 diagrams created in ConceptDraw DIAGRAM are vector graphic documents and can be reviewed, modified and converted to MS Visio XML format. To obtain the IDEF0 Visio documents from ConceptDraw DIAGRAM documents use the wide export possibilities of ConceptDraw DIAGRAM.
Picture: IDEF0 Visio
Related Solution:


