UML Class Diagram Example for GoodsTransportation System
This sample was created in ConceptDraw DIAGRAM vector drawing software using the UML Class Diagram library of the Rapid UML Solution from the Software Development area of ConceptDraw Solution Park.
This sample shows the concept of working of the transport company and is used by transport companies, carriers at the transportation of various goods.

Example 1. Class Diagram for GoodsTranspotr System in UML
Using the libraries of the Rapid UML Solution for ConceptDraw DIAGRAM you can create your own visual vector UML diagrams quick and easy.
UML Resource:
- UML Software
- How to create a UML Diagram
- UML Diagram Examples
- Class Diagram
- Use Case Diagram
- Timing Diagram
- Interaction Overview Diagram
- Communication Diagram
- State Machine Diagram
- Activity Diagram
- Deployment Diagram
- Package Diagram
- Collaboration Diagram
- Object Diagram
- Sequence Diagram
- Composite Structure
- Component Diagram
TEN RELATED HOW TO's:
Use building drawing software to develop the annotated diagrams or schematics of waste water disposal systems, hot and cold water supply systems, water lines and waste water engineering.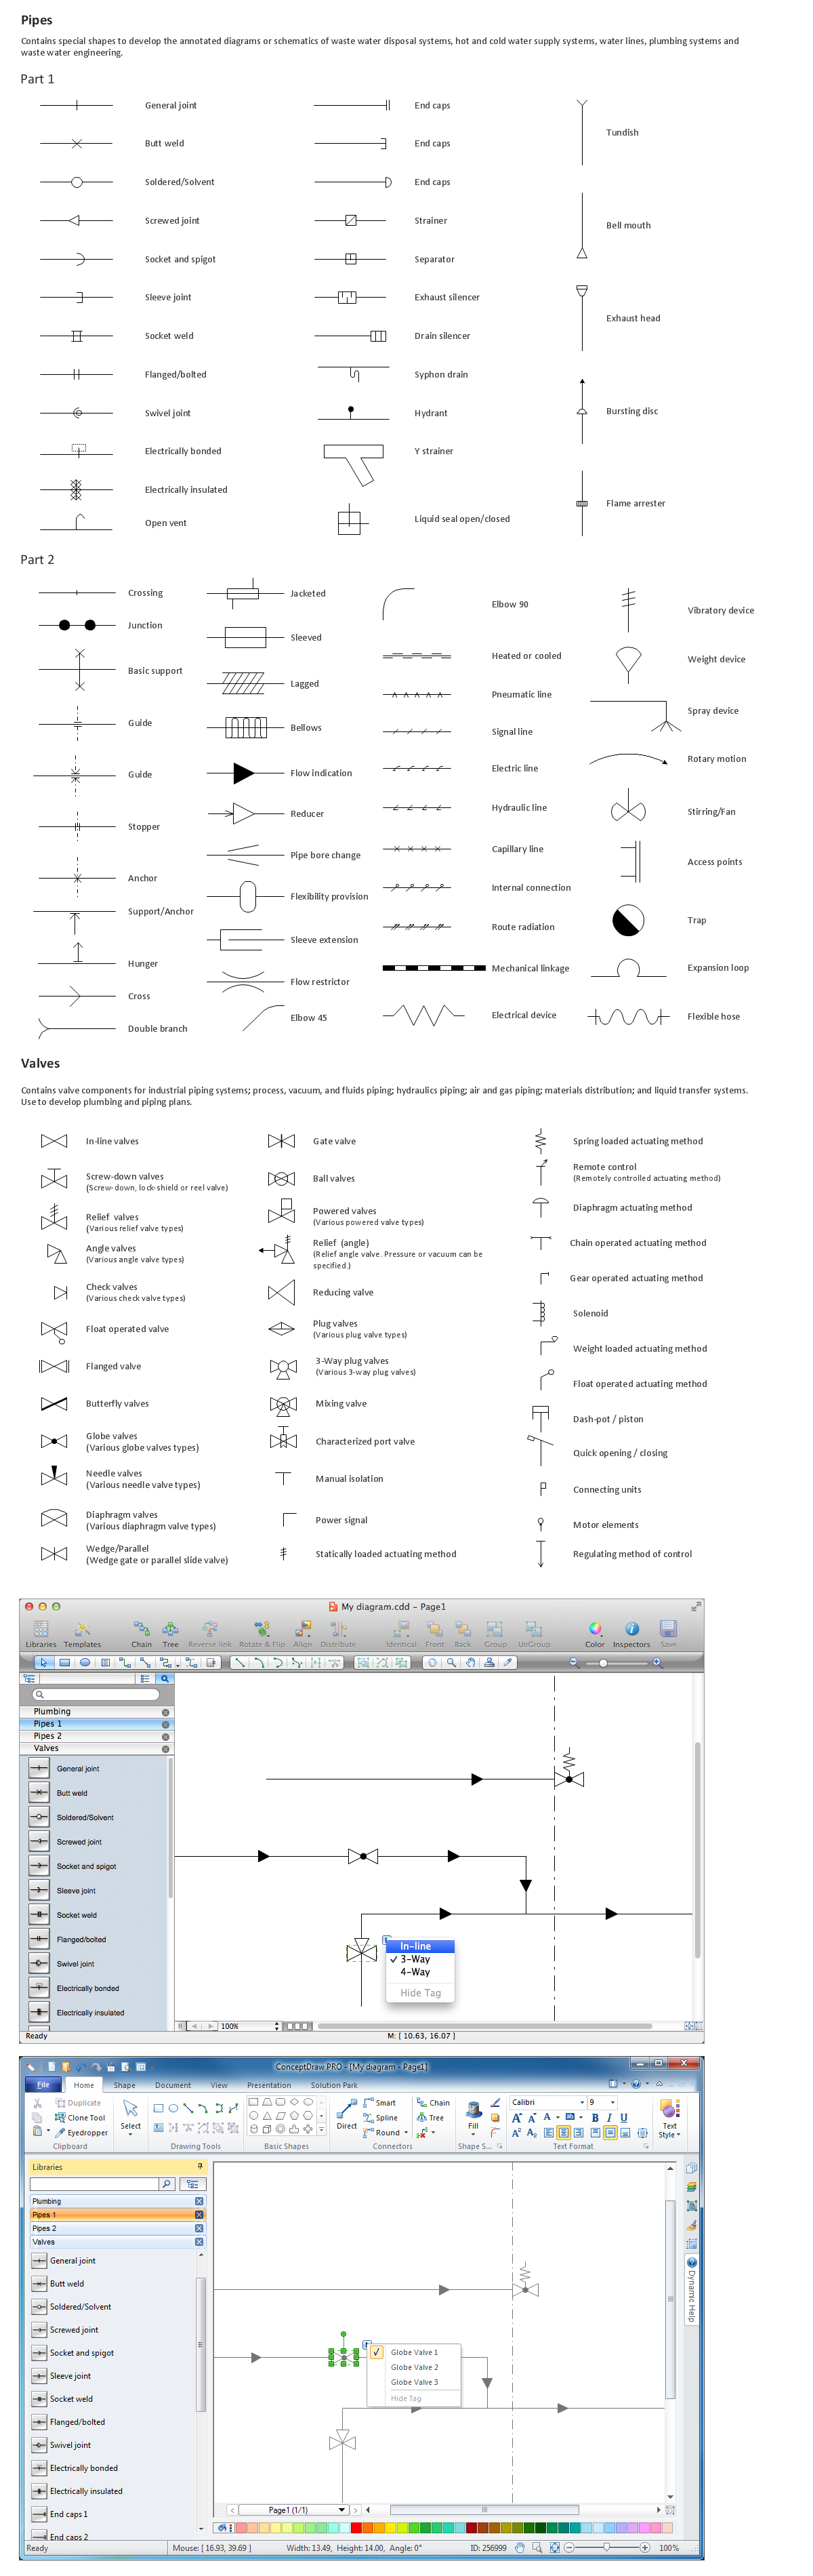
Picture: Building Drawing Software for Design Piping Plan
Related Solution:
ConceptDraw DIAGRAM extended with Matrices solution from the Marketing area of ConceptDraw Solution Park is the best Deployment Chart Software.
The Matrices solution offers you the useful tools for creating Deployment Charts in just minutes.
The Deployment Charts designed with ConceptDraw DIAGRAM are vector graphic documents and are available for reviewing, modifying, converting to a variety of formats (image, HTML, PDF file, MS PowerPoint Presentation, Adobe Flash or MS Visio XML), printing and send via e-mail in one moment.
Picture: Deployment Chart Software
Related Solution:
How do Fishbone diagrams solve manufacturing problems? Fishbone diagrams are successfully used in various fields of industries and manufacturing to analyze the set of possible causes and their effects. Fishbone diagram provides a process to clearly define the “Effect” and then puts you to thinking about the possible causes, based on the categories of common problems in manufacturing.
ConceptDraw DIAGRAM application extended with Fishbone Diagrams solution lets you construct Fishbone diagrams and represent globally recognized standards for manufacturing 6 Ms and 8 Ms.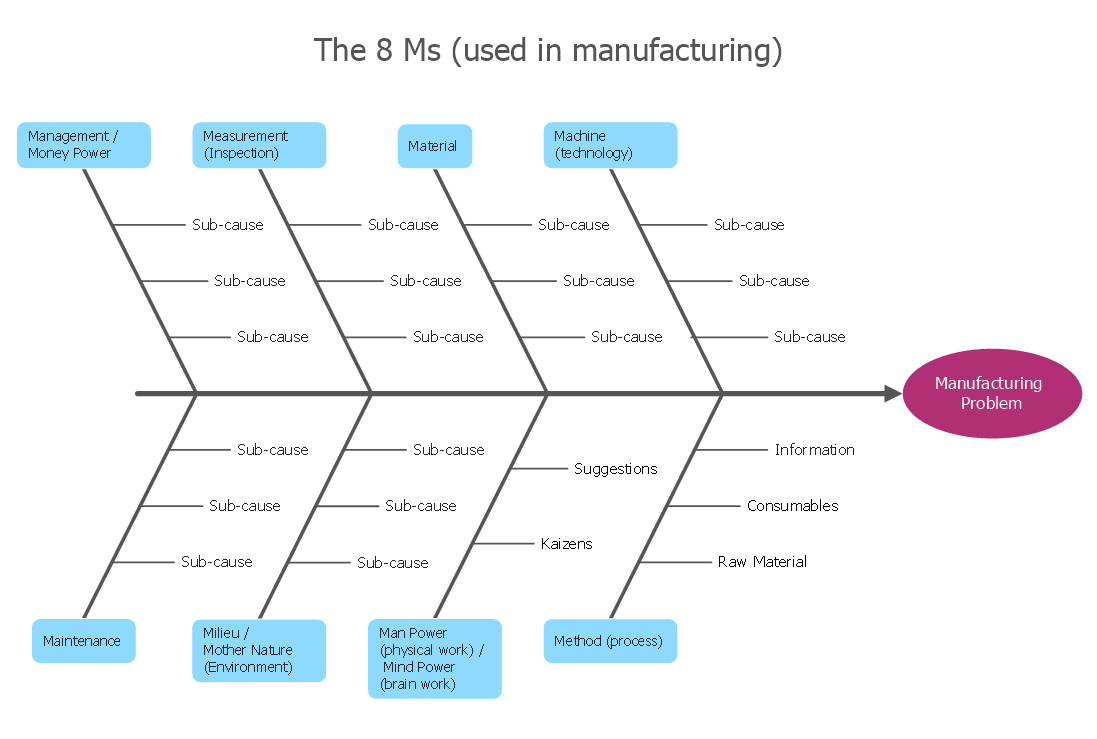
Picture: How Do Fishbone Diagrams Solve Manufacturing Problems
Related Solution:
ER-modeling nowadays is a very popular approach for database design. If you are tired of looking for a good entity relationship diagram Software for Mac, then your search is almost over. ConceptDraw DIAGRAM is a great tool for creating diagrams of any complexity with tons of editable samples and templates.
This diagram represents the vector library of the Chen’s and Crow’s Foot notation icons for drawing ERD (entity-relationships diagram). ConceptDraw Entity Relationship Diagram solution delivers the ability to visualize databases structure on both Mac and PC. The "bricks" entity-relationships models are the entity, and the relation. An entity is represented by a rectangle comprising the entity name. It means an object, information about which should be available and stored. A relation is intended to show a relations between two entities. There are several types of relations between entities. To show there are a number of different symbols for the types of relationships.
Picture: Entity Relationship Diagram Software for Mac
Related Solution:
UML Package Diagram illustrates the functionality of a software system.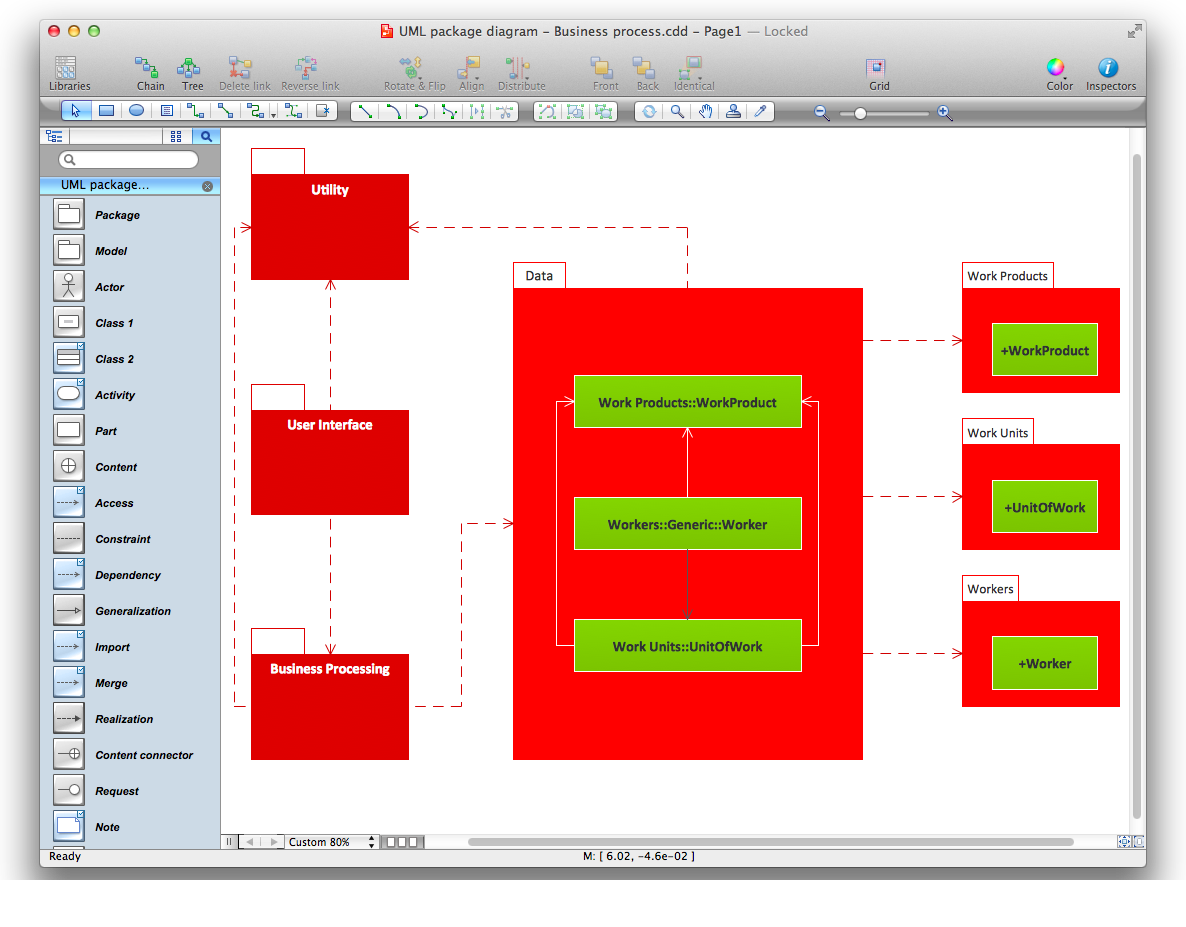
Picture: Diagramming Software for Design UML Package Diagrams
Social Media UML - This sample shows the structure of the popular social networking site Linkedin. This is a Class Diagram on that classes are represented as boxes and are connected with aggregation, composition associations. This sample can be used in the business field, in IT, at the projection and creating of the social networking sites.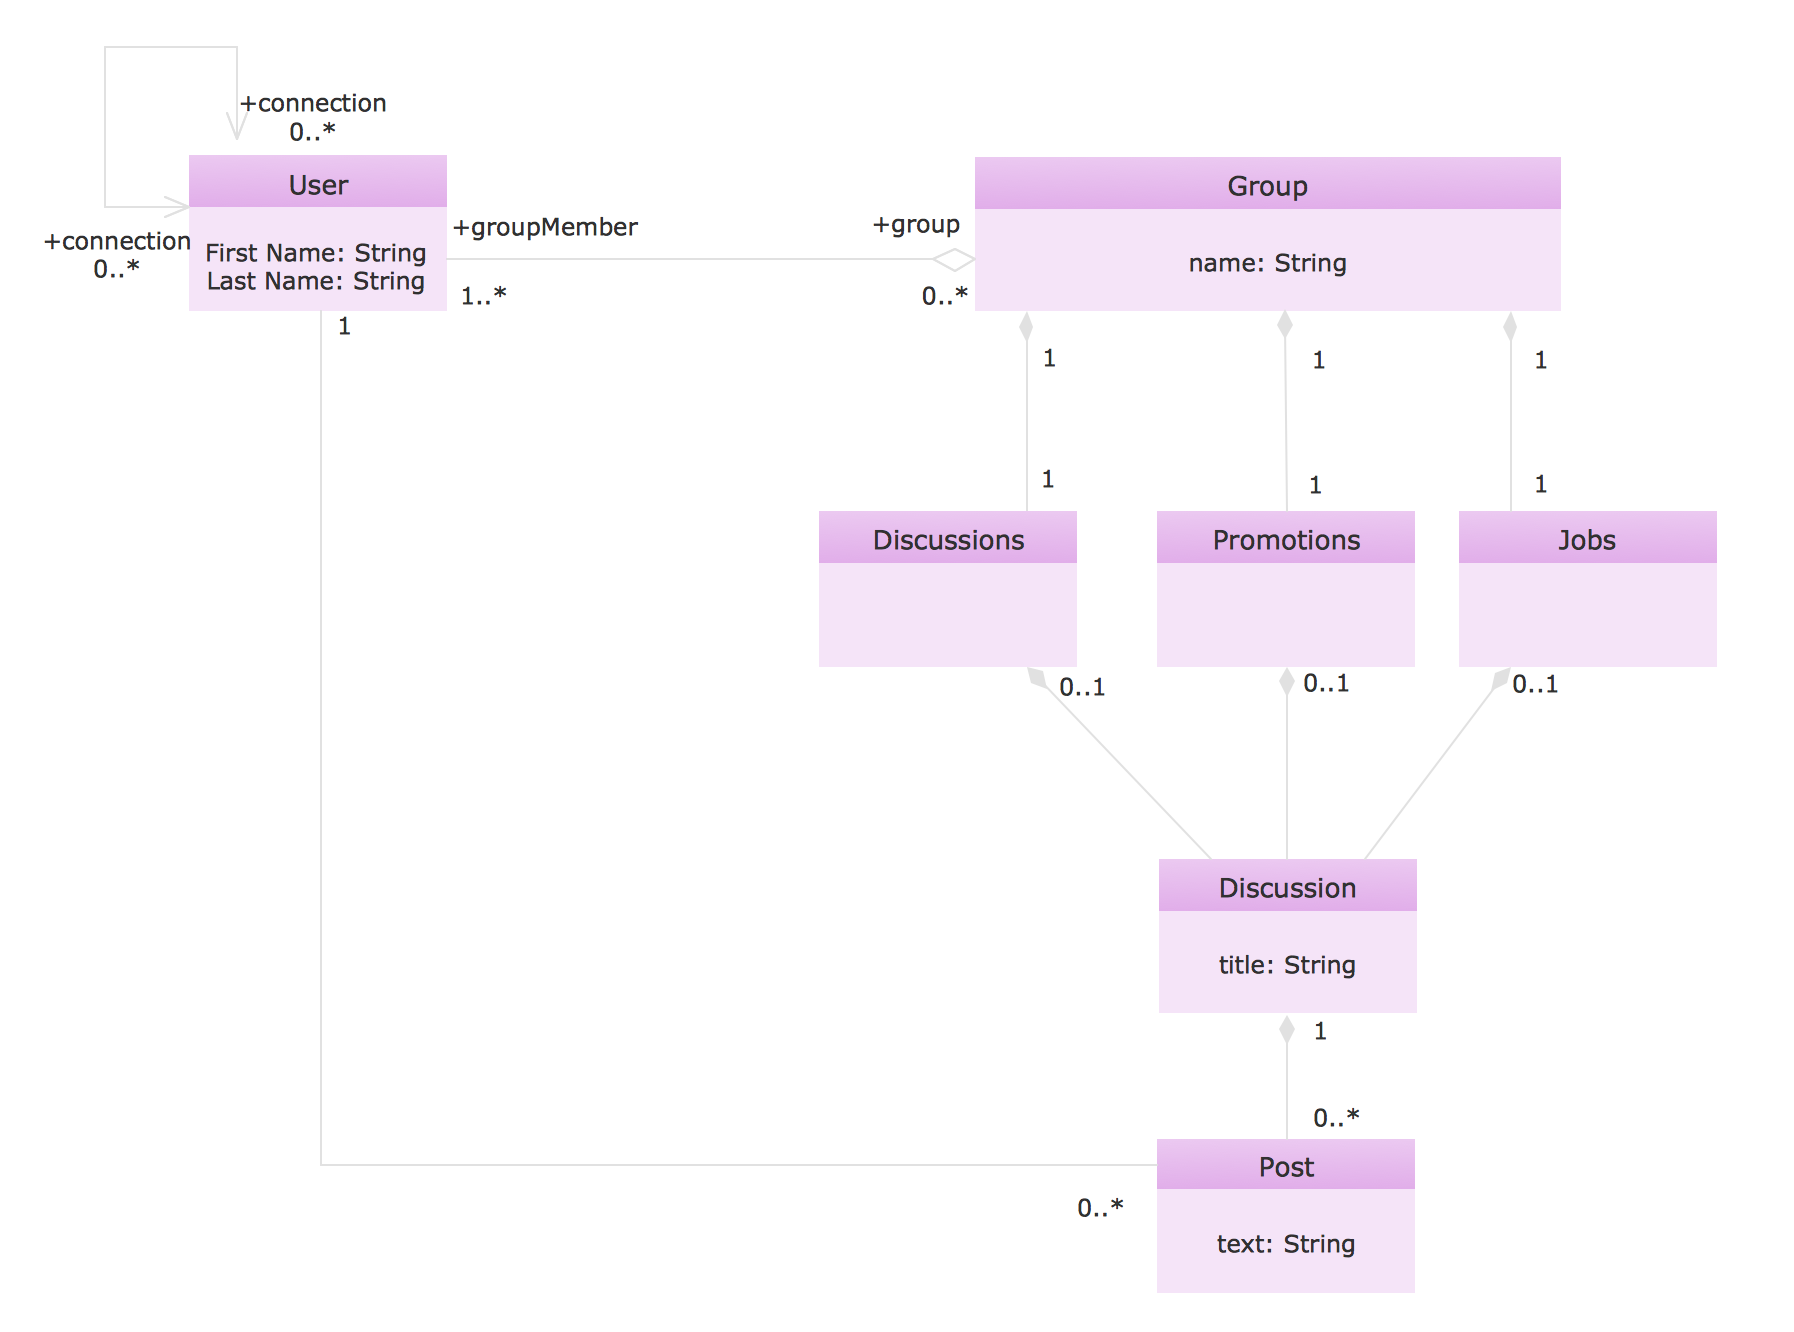
Picture: Social Media UML
Related Solution:
Collaboration tool for project management enables you to give a new role to knowledge management and document sharing within your team.
Picture: How To Use Collaboration Tool in Project Management
Related Solution:
Presentation tools. A convenient tool to present documents via Skype. Share your desktop, collaborate on documents in real-time and run a web conference one-on-one or one-to-many.
A tool for sharing and presenting business documents via Skype. Allows to present Microsoft® Word®, Microsoft PowerPoint®, Microsoft Project® and plenty mindmapping formats.
Picture: Presenting Documents with Skype
Related Solution:
Create a Pie Chart with ConceptDraw software quickly and easily. The simple tutorial helps you learn how to create a pie chart.
Picture: How to Create a Pie Chart
Related Solution:
ConceptDraw DIAGRAM is a world-class diagramming platform that lets you display, communicate, and present dynamically. It′s powerful enough to draw everything from basic flowcharts to complex engineering schematics.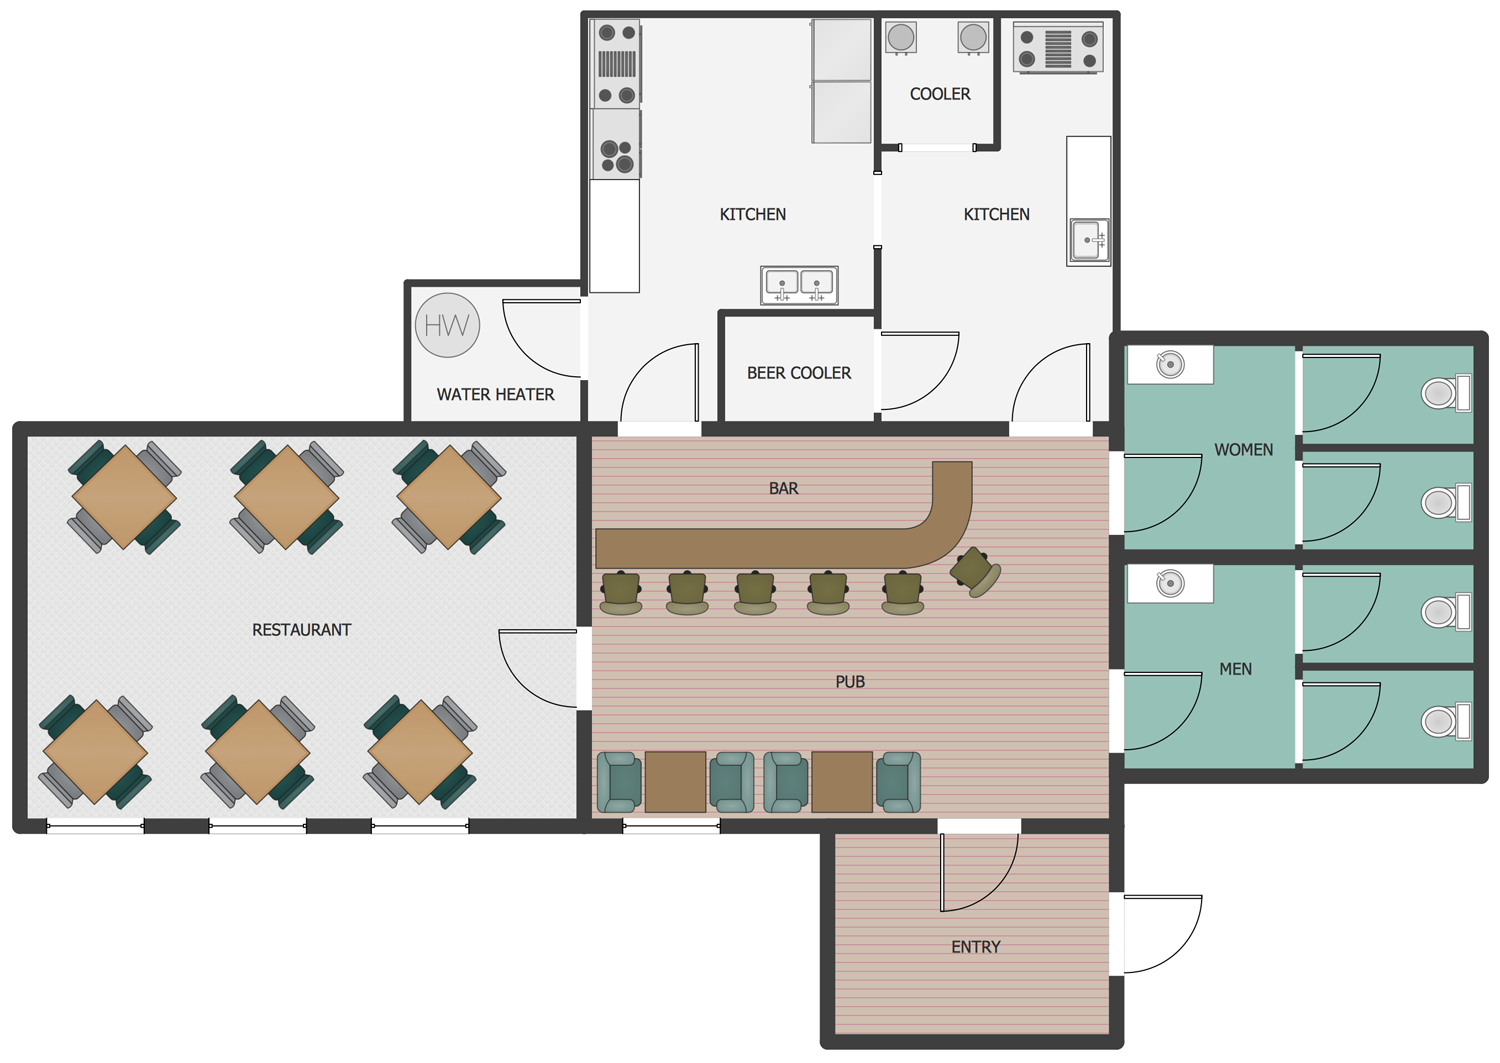
Picture: How to Draw a Building Plans
Related Solution:
ConceptDraw
DIAGRAM 18