Infographic design elements, software tools
Subway and Metro style
Use ConceptDraw DIAGRAM software extended with Metro Map solution from ConceptDraw solution park.
This is a one-click tool to create new stations, change lengths, and add text labels and icons. It contains Lines, Stations, and Landmarks objects. This is great tool to create metro maps, route maps, bus and other transport schemes, or even subway style (tube style) infographics.
Smart Vector Objects and Tools for Subway-style Infographics

About infographic design elements
- This is screen capture of few design elements used ConceptDraw DIAGRAM software with Metro Map solution to demonstrate major design elements and the results you can achieve using this solution.
- Includes Smart Objects with shape-switching capabilities.
- Metro Map Solution is part of ConceptDraw Solution Park extentions for ConceptDraw software products.
- All final documents are vector graphic documents and can be exported to major graphic data formats. They are samples which available for reviewing, modifying or converting to a variety of formats (PDF file, Power point Presentation, image or MS Visio) from the Template Gallery of ConceptDraw DIAGRAM for all users who have installed Metro Map solutions.
See also:
Video Tutorial "How to draw Metro Map style infographics?"
Tutorial explains Metro Map tools, demonstrate how to add stations to the map, control the direction in which you create new stations, change lengths, add text, Lines and Landmarks objects. This video demonstrate ConceptDraw Metro Map Solution.
TEN RELATED HOW TO's:
Simple tutorial help you learn how to draw a scatter chart and increase you possibilities of understanding and work more effective with our scatter chart software.
Picture: How to Create a Scatter Chart
Related Solution:
A concept map is a way of representing relationships between ideas, images, or words.
How to draw a Concept Map quick, easy and effective? ConceptDraw DIAGRAM offers the unique Concept Maps Solution from the Diagrams Area that will help you!
Picture: Concept Map
Related Solution:
ConceptDraw DIAGRAM is a software for making Value Stream Mapping diagram with more than 10 library objects that are scalable vector images.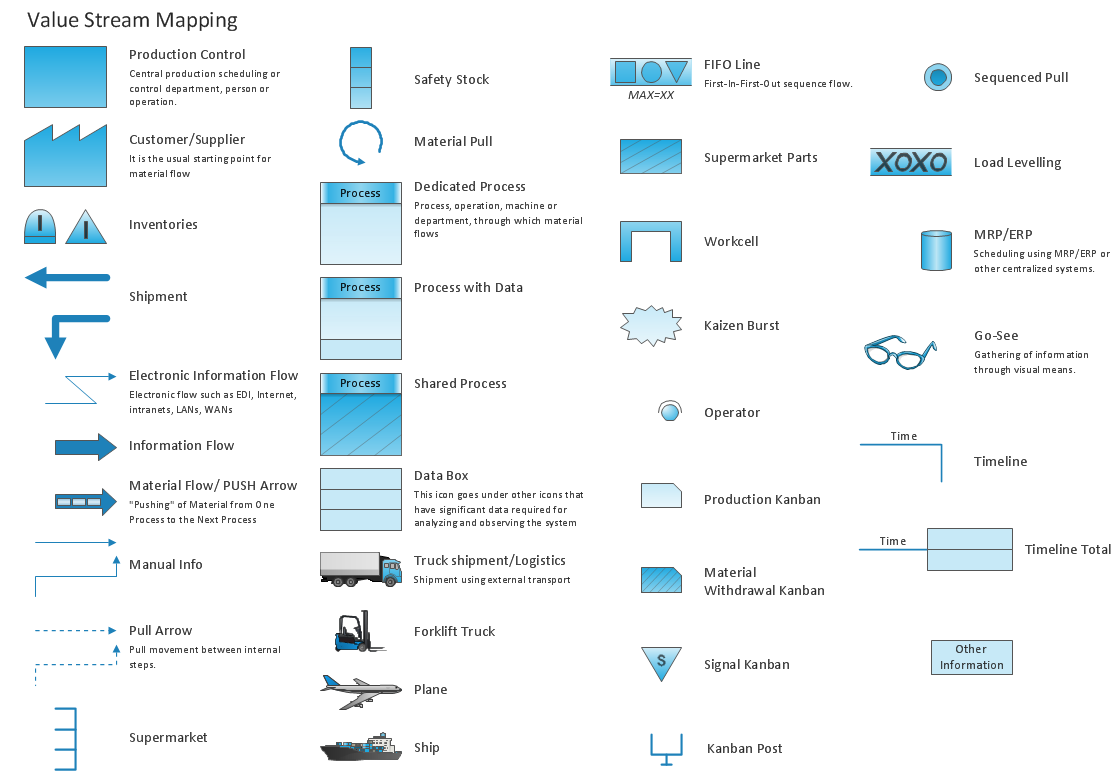
Picture: Value Stream Mapping - Design Elements
Related Solution:
Biology is incredibly interesting and useful natural science which studies all living things on the earth (people, animals, plants), structure, functions, interactions, evolution of living organisms. Biologists of the whole world use actively illustrations and drawings in your science and education activity. To facilitate their task of biology drawing, ConceptDraw DIAGRAM diagramming and vector drawing software was extended with Biology solution from the Science and Education area. Now, ConceptDraw DIAGRAM is a powerful biology drawing software.
Picture: Biology Drawing Software
Related Solution:
The term “cloud” is very popular and widely used now, it is a server, data processing centre, or a network which lets to store the data and software, provides access to them, allows to run applications without installation and gives the possibility to process data hosted remotely via the Internet connection.
For documenting the Cloud Computing Architecture with a goal to facilitate the communication between stakeholders are successfully used the Cloud Computing Architecture diagrams. It is convenient and easy to draw various Cloud Computing Architecture diagrams in ConceptDraw DIAGRAM software with help of tools of the Cloud Computing Diagrams Solution from the Computer and Networks Area of ConceptDraw Solution Park.
Picture: How to Build Cloud Computing DiagramPrincipal Cloud Manufacturing
Related Solution:
ConceptDraw DIAGRAM is a powerful diagramming and vector drawing software. Extended with Website Wireframe solution from the Software Development area, ConceptDraw DIAGRAM became the ideal software for prototype and design professional looking websites wireframes. Website Wireframe solution offers at your disposal wide variety of wireframe examples and samples which confirm this.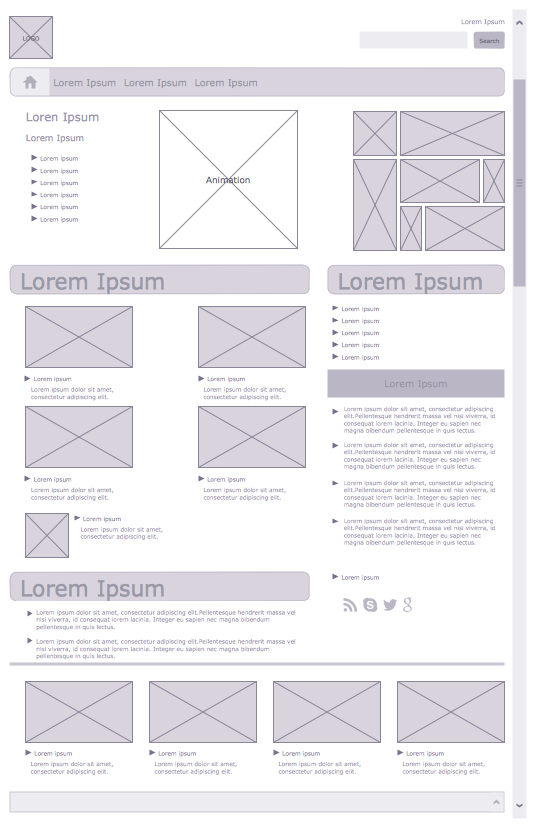
Picture: Wireframe Examples
Related Solution:
ConceptDraw DIAGRAM is perfect for software designers and software developers who need to draw Computer and Network Diagrams._Win_Mac.png)
Picture: Network Diagramming Software for DesignComputer and Network Diagrams
It is very difficult to get into database model idea without any examples. To create one, you can use Chen’s notation for Entity Relationship Diagrams (ERD) and try to see all the peculiarities yourself. This notation describes entities and relations as basic geometric shapes like rectangles and diamonds.
Chen notation for Entity-relationship diagrams is used for designing relational databases. It depicts the database entities as a set of subjects. For example events, people, ideas, etc. All entities has common characteristics (attributes). Any object of the system is identified as the sole and unique. The name of entity should indicate the class or type of the the whole object, not a given example. The connection commonly represents a relationship between entities. Conceptdraw Entity-Relationship Diagrams (ERD) solution provides the libraries with ready-to-use ERD element fitting Chen's notation objects and relationships.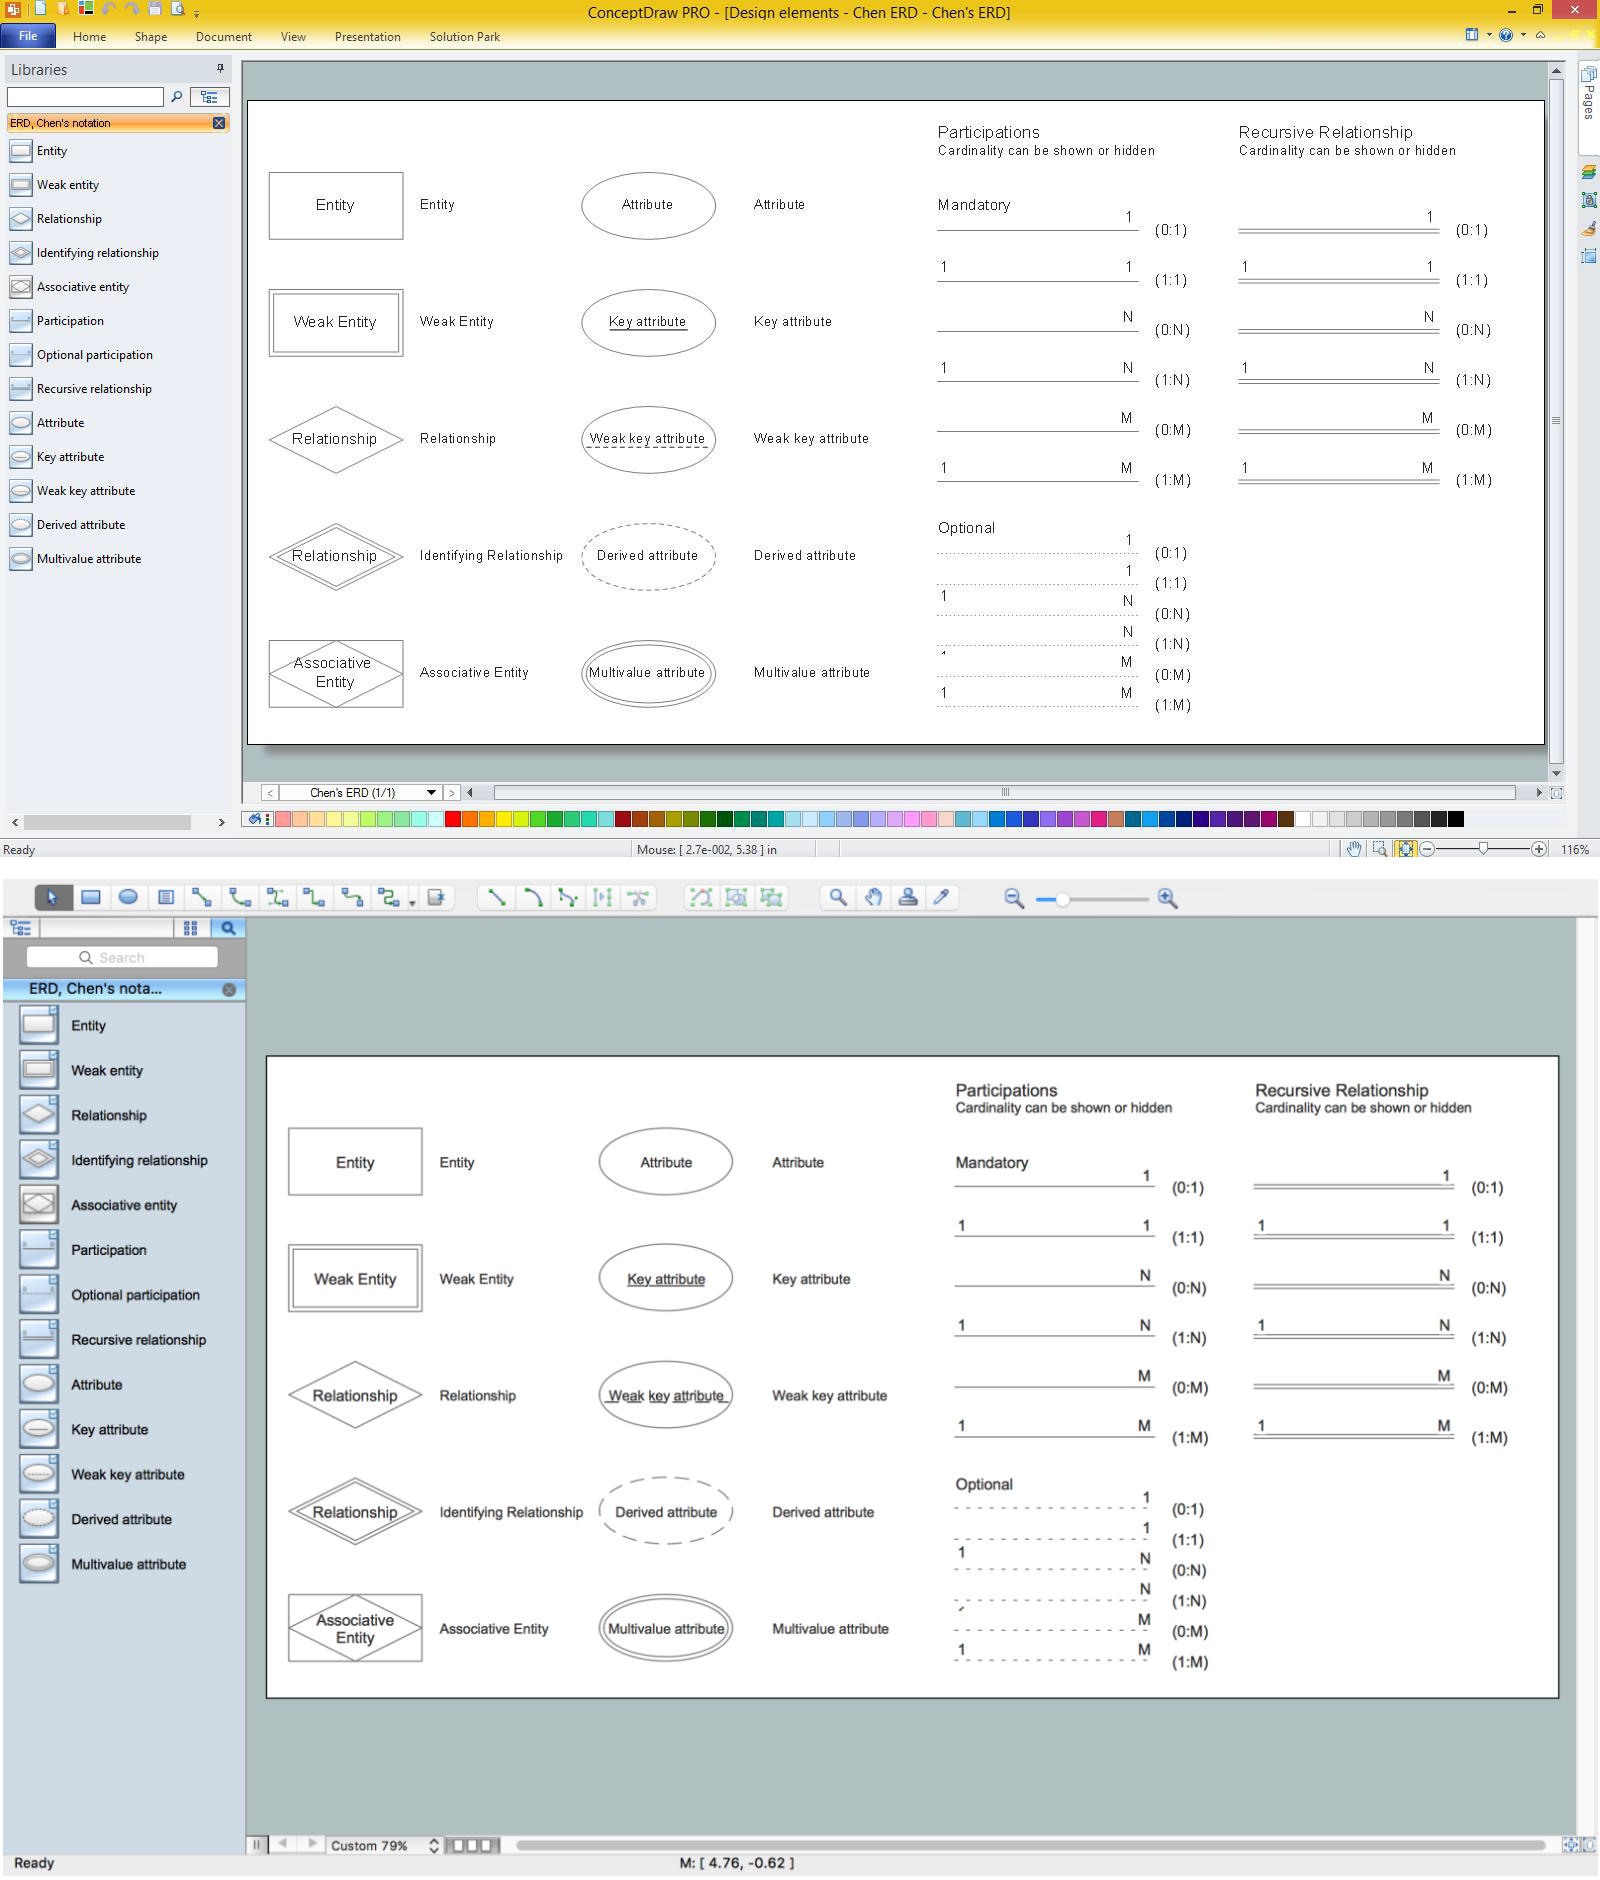
Picture: Design Element: Chen for Entity Relationship Diagram - ERD
Related Solution:
Business graphic applications show a special knowledge representations and include many features for creating schematic pictures. These graphic tools are known as flowchart maker or flowchart maker software.
Picture: Flowchart Maker
Related Solution:
Compare flowchart software by type, features, and workflow fit. Learn the difference between desktop and online tools and choose the right solution for documentation or collaboration.
Picture: Flowchart Software: Tools for Process and Workflow Diagramming
Related Solution:
ConceptDraw
DIAGRAM 18