How to Draw Metro Map style infographics? Moscow, New York, Los Angeles, London
The Metro Map Solution includes a library of specially designed objects, to allow users to design transport maps and tube-style inforgraphics.
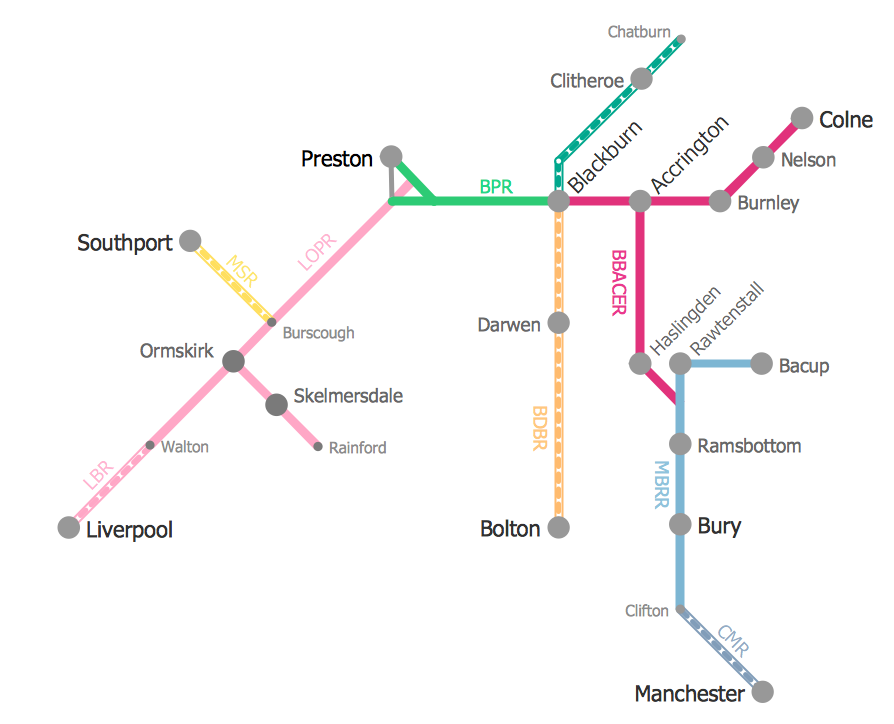
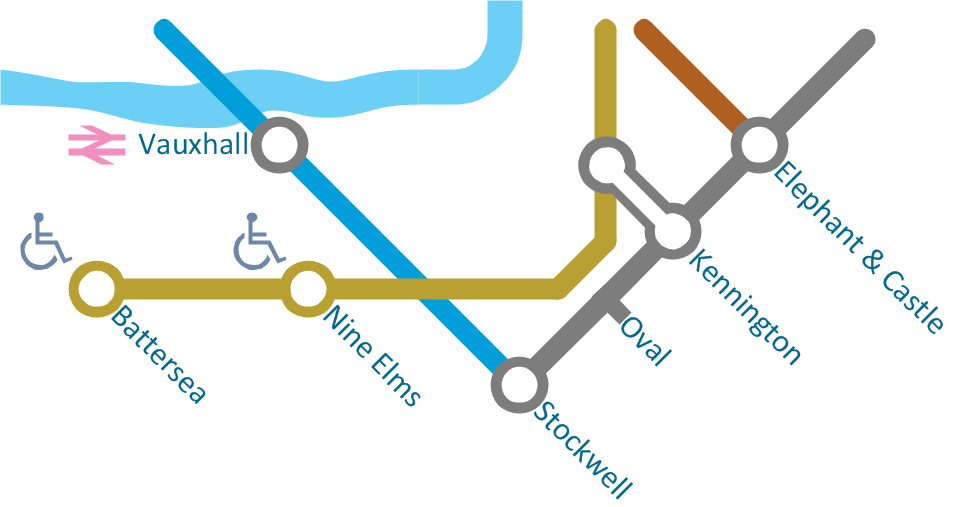
The solution handles designs of any complexity, and the comprehensive library covers all key aspects of a transportation system. To further enhance your map design, there is the option to embed links, that can display station images or other relevant, important information. We have also included a set of samples in the solution, that show the possible real-world application — complex tube systems including the London Tube and New York City Subway show the level of detail possible when using the Metro Map Solution.
Pic.1. Metro Map Solution
ConceptDraw DIAGRAM and the ever-growing collection of product extensions in the ConceptDraw Solution Park provide ultimate flexibility and user-friendliness in a robust, full-featured diagramming package. ConceptDraw DIAGRAM supports Apple MacOS and Microsoft Windows.
This is a one-click tool to add stations to the map. It lets you control the direction in which you create new stations, change lengths, and add text labels and icons. It contains Lines, Stations, and Landmarks objects.
The solution uses two ConceptDraw techniques:
Replicating Objects
Switching Objects
The result is a vector graphic document.
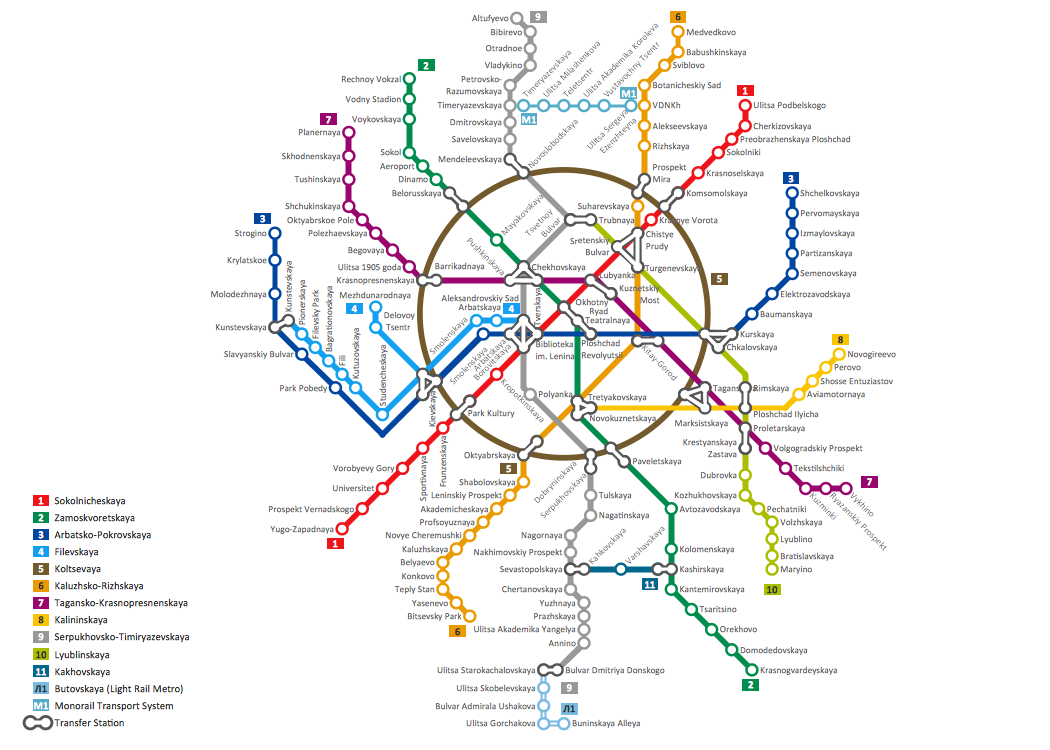
Pic.2. Moscow Metro Map
Opened in 1935 with one 11-kilometre (6.8 mi) line and 13 stations. As of 2012, the Moscow Metro has 186 stations and its route length is 308.7 kilometres (191.8 mi). The system is mostly underground, with the deepest section 84 metres (276 ft).
Drawing of Metro Train Map is usually complex process, but we want to make it easier and offer you the ConceptDraw DIAGRAM software with its Metro Map Solution from the Maps Area of ConceptDraw Solution Park.
Studying informatics demands knowledge in the area of computer networks as well. The most famous world network, Internet, is an example of wide area network (WAN) topology that connects devices spread on any distance. Unlike other smaller networks that are limited to a building or to a campus, WAN is almost limitless.
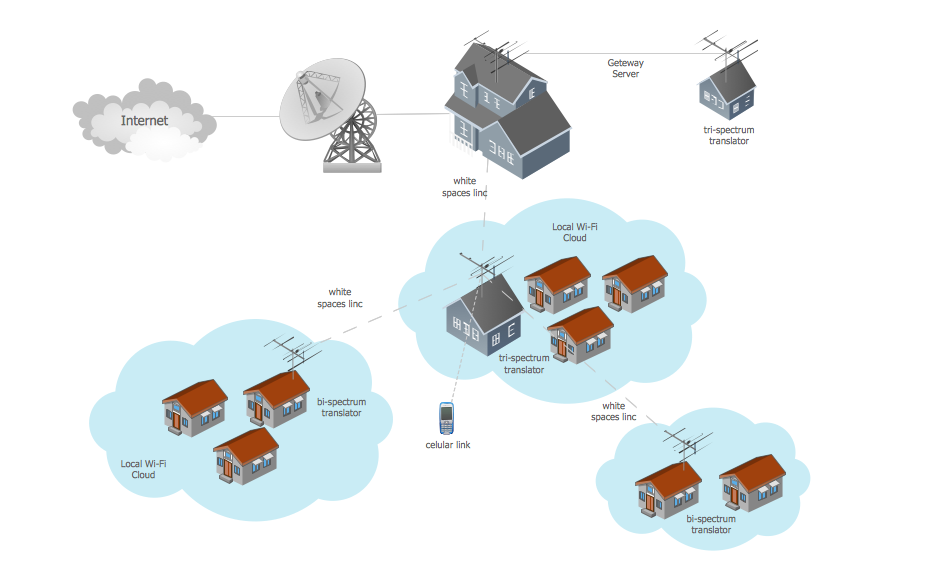
This WAN (wide area network) diagram was created in ConceptDraw DIAGRAM. It shows a telecommunication network that covers a large geographical area connecting several settlements. This type of networks is commonly used by business and government institutions. Using the WANs enables them quickly communicate information between remote geographical points. To reproduce this network diagram, you will need the means, provided by ConceptDraw Computer and Network Diagrams solution.
Picture: Wide area network (WAN) topology. Computer and Network Examples
It’s not easy to plan all the details of your landscape at once. Therefore, you can use a bubble diagram to create a draft of the future project. You can develop any bubble diagrams and use them in your landscape design project with ConceptDraw DIAGRAM and it’s predesigned templates.
This bubble diagram can be applied while initiating the development of garden and landscape design. The bubble diagrams used for this purpose are different from the classic bubble diagrams. Being used in landscape and garden design, they obtain the quite another understanding. Bubbles in this diagram visualize some captured areas, which define the general spaces of a future garden: lawn, flower garden, pool, built-up area, lighting, etc. The bubble diagram represents the landscape project without any special expenses on its creation. It is better to make such simple sketch before you drill down into detailed project and cost estimates.
Picture: Bubble diagrams in Landscape Design with ConceptDraw DIAGRAM
What do you know about restaurants? To have a better understanding, use restaurant floor plans software, and enjoy the result. Registration is going to take just a few minutes, and you will be able to start your experience from tons of examples and free templates.
This restaurant floor plan was created with the help of he ConceptDraw Cafe and Restaurant Plans solution. The main feature of this restaurant is small kitchen. Perhaps that is why the designer of this establishment, has paid great attention to interior diversity. The facilities of ConceptDraw DIAGRAM allow him to make this easily. Here are represented tables for two, for three or four visitors. A visitor can choose any of the bright multi-colored chairs and tables. The two tables at the right upper corner attract one's attention. They are strictly decorated and located near the second door. Probably they are for security service of the restaurant, which monitors to ensure that visitors do not run away without paying.
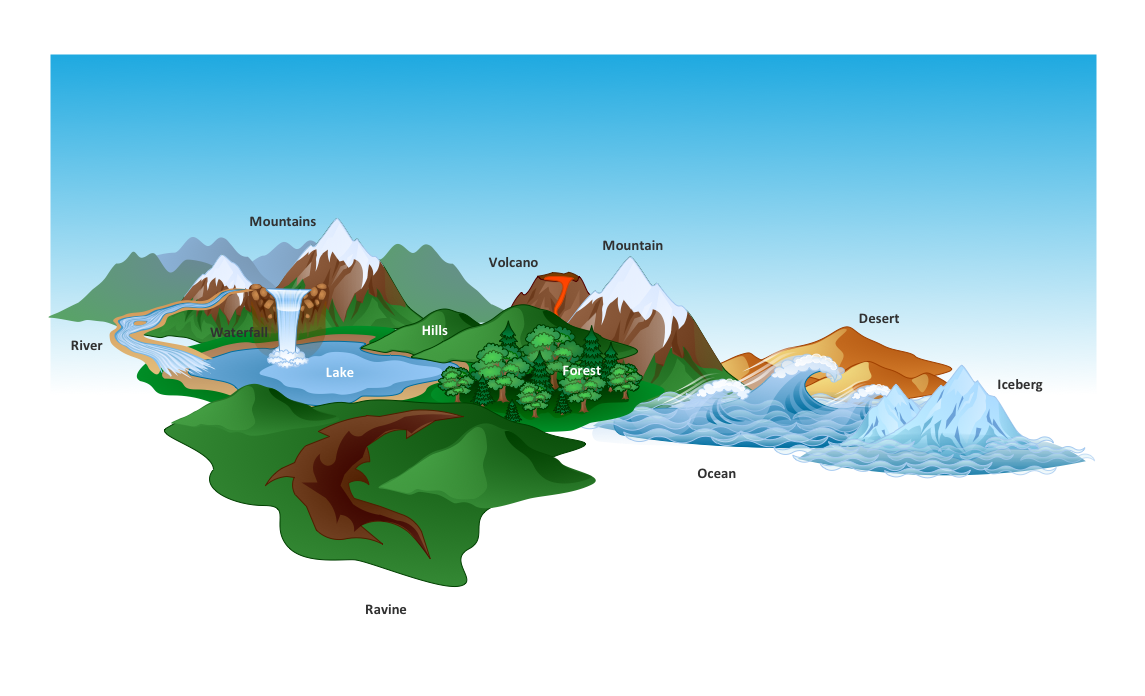
Nature solution expands ConceptDraw DIAGRAM software with samples, templates and libraries of vector clip art for drawing of Nature illustrations.
Use Geography library of vector stencils to draw natural landscapes.
Architectural drawing allows to show the location of a building or ensemble of buildings on the ground, indicating the cardinal points. For centuries, people had been studying architecture in universities to learn how to draw building plans and now everyone can do it easily just using appropriate software. While developing the building plan, its graphic part, you can display the part of the floor or the entire floor of a building with an indication of the exact location of the drawn premise.
Small-sized apartments does not restrict the advanced interior design opportunities. Here is a detailed and precise floor plan of a pretty small apartment. A furniture objects are added to show possible interior of this home. This plan can be used to help somebody with a floor layout and furniture arrangement. Having this floor plan in a pocket while shopping would be useful to check if there is enough rooms for a new furniture.
Fast visualization of structured data is main capability of the ConceptDraw DIAGRAM. With numerous vector stencils and standard flowchart symbols from object libraries and the RapidDraw technology this program stands as the best professional flowchart software for drawing with type of flowchart symbols. ConceptDraw DIAGRAM also known as best flowchart maker.
Picture: Easy Flowchart Program and Standard Flowchart Symbols
To support you in your tasks you can use the power of ConceptDraw DIAGRAM providing
intelligent vector graphics that are useful for management diagramming and
ConceptDraw MINDMAP for key management mind maps.