Made with
ConceptDraw
DIAGRAM 18

Draw Company Structure with Organization Charting Software

Company Structure Diagram gives the detailed information about the company structure and hierarchy - who execute what tasks and who is in charge at this company. This information shows the reasoning and success of business and is indispensable for investors and financial institutions.

ConceptDraw DIAGRAM is a powerful intelligent vector graphics engine that can be used for basic diagramming. Various flowcharts, block diagrams, histograms, pie charts, divided bar diagrams, line graphs, circular arrows diagrams, Venn diagrams, bubble diagrams and concept maps, and others can be generated with ease and then successfully used to visually communicate business and personal ideas and concepts, general structures and activities.

You need create Company Structure Diagram quick and easy? ConceptDraw DIAGRAM extended with Organizational Charts Solution from the Management Area has become the best Organization Charting Software that will help you effectively!


Draw Company Structure with Organization Charting Software *

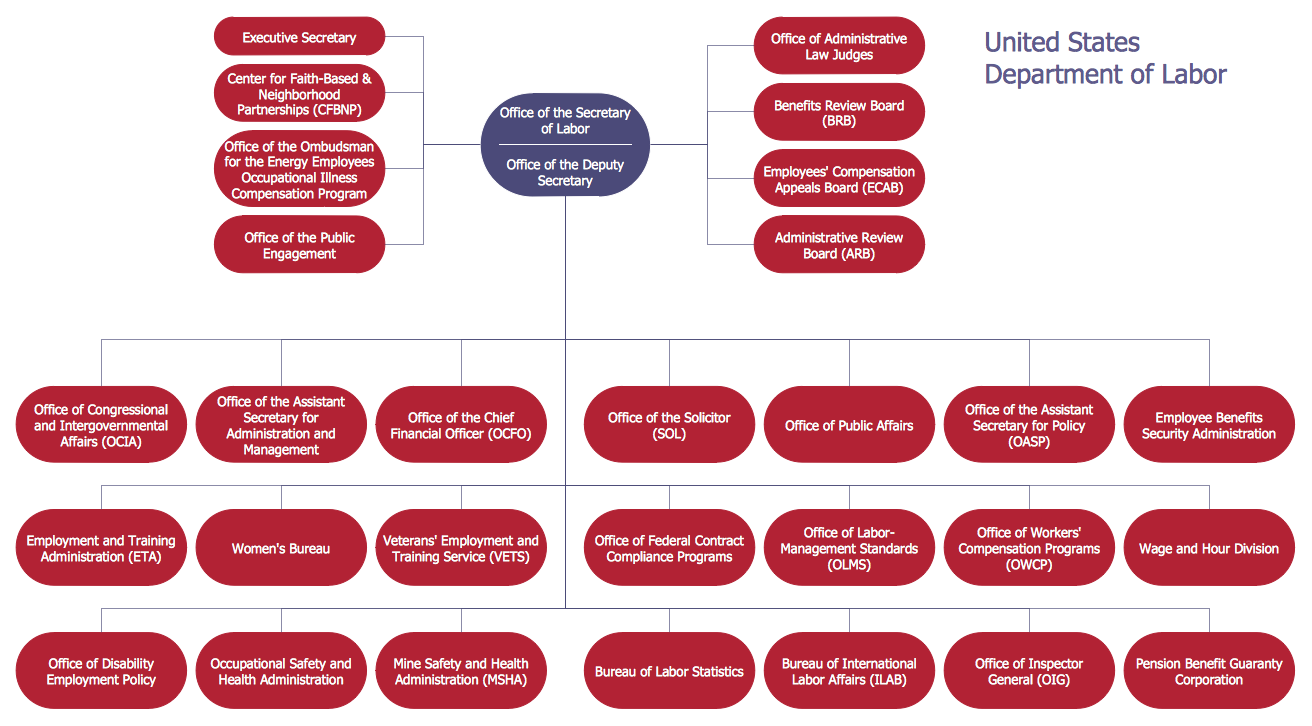
Sample 1. Organizational chart - New York State Education Department.

This sample was created in ConceptDraw DIAGRAM using the Organizational Charts Solution from the Management Area of ConceptDraw Solution Park and shows the organizational structure of New York State Education Department.

Use Organizational Charts solution for ConceptDraw DIAGRAM to create your own Company Structure Diagrams in minutes.


The Company Structure Diagrams designed with ConceptDraw DIAGRAM are vector graphic documents and are available for reviewing, modifying, converting to a variety of formats (image, HTML, PDF file, MS PowerPoint Presentation, Adobe Flash or MS Visio), printing and send via e-mail in one moment.


See also:


NINE RELATED HOW TO's:
ConceptDraw DIAGRAM Comparison with Omnigraffle Professional and MS Visio. All source ConceptDraw documents are vector graphic documents. They are available for reviewing, modifying, or converting to a variety of formats: PDF file, MS PowerPoint, MS Visio, and many other graphics formats.ConceptDraw DIAGRAM Presentation
Picture: ConceptDraw DIAGRAM Comparison with Omnigraffle Professional and MS Visio
Related Solution:
Any bar chart can be also called as a bar graph or a column chart or graph. Being a chart or a graph that is commonly used for presenting some categorical data with the rectangular bars having their lengths or heights proportional to the values that they represent, such drawings can be made with the help of the ConceptDraw DIAGRAM diagramming and drawing software. The created bars can be plotted either vertically or horizontally and any vertical bar chart can be also sometimes called as a line graph.Column Chart Template *
Picture: Column Chart Template
Related Solution:
Bubble diagrams solution extends ConceptDraw DIAGRAM software with templates, Using ConceptDraw Connectors, you can create a bubble chart in moments. Using ConceptDraw you will be able to create a bubble chart from the ready ConceptDraw library objects or make your own objects. The created diagram can represent ideas organization, in brainstorming processes, by teachers for explaining difficult ideas or for presentations.How To Create a Bubble Chart *
Picture: How To Create a Bubble Chart
Related Solution:
Easy charting software comes with beautiful chart templates and examples. This makes it easy to create professional charts without prior experience.Chart Examples *
Picture: Chart Examples
Related Solutions:
ConceptDraw DIAGRAM is a business flowchart software includes the wide flowchart examples package.Basic Flowchart Examples *
Picture: Basic Flowchart Examples
Related Solution:
Bureaucratic companies usually are characterized by a strict hierarchy and clearly defined responsibilities. However, sometimes organizational structure of a company reminds of somewhat tangled. To clarify it, you can create an orgchart that will represent the company as a tree with its' departments as branches. This organization diagram represents a tree-like organizational structure. This is a typical example of a top-level branches of the hierarchical organizational structure. This part of the tree shows heads of branches who are subordinated completely to the president. The information and solutions are distributed though a tree structure down to the company's departments. Each of the sub-division has its own structure that is reflected in the corresponding organizational chart. This orgchart diagram was created using the vector graphic library supplied with ConceptDraw Organizational Charts solution.Organizational Structure *
Picture: Organizational Structure
Related Solution:
Create bar charts for business management problem solving and data comparison using the ConceptDraw DIAGRAM diagramming and vector drawing software extended with the Bar Graphs Solution from the Graphs and Charts area of ConceptDraw Solition Park.Bar Diagrams for Problem Solving.<br>Create business management bar charts with Bar Graphs Solution *
Picture: Bar Diagrams for Problem Solving.Create business management bar charts with Bar Graphs Solution
Related Solution:
The Total Quality Management Diagram solution helps you and your organization visualize business and industrial processes. Create Total Quality Management diagrams for business process with ConceptDraw software.Organizational Structure Total Quality Management *
Picture: Organizational Structure Total Quality Management
Related Solution:
Matrix organizational structure is one of the main forms of structures which is actively used by organizations to carry forth the functions of a company visually and effectively. Now we have ConceptDraw DIAGRAM diagramming and vector drawing software extended with 25 Typical Orgcharts solution from the Management area of ConceptDraw Solution Park which will help easy represent matrix organizational structure of any degree of complexity.Matrix Organization Structure *
Picture: Matrix Organization Structure
Related Solution:
ConceptDraw
DIAGRAM 18