How should diagramming software work? Is it possible to develop a diagram as quickly as the ideas come to you?
The innovative ConceptDraw Arrows10 Technology included in ConceptDraw DIAGRAM is a powerful drawing tool that changes the way diagrams are produced.
While making the drawing process easier and faster.
ConceptDraw DIAGRAM is a powerful tool that helps you create a process map diagram quickly and easily. Fine-tuning the objects in ConceptDraw DIAGRAM allows you to create a really professional finished article.ConceptDraw Arrows10 Technology gives drawing connectors a smart behavior that provides quick and precise placement, allows for easy changes and automatic rearrangement.
A cross functional flowchart (a.k.a. a deployment flowchart) is a tool that visually displays business processes with explicitly defined steps and resources to allow for efficient project management.
Chain Auto-connection mode allows you to draw a flowchart in moments. Thanks to ConceptDraw Arrows10 Technology, you don’t need to concern yourself with technical details such as connecting and placing objects. Your only concern is what to draw. Everything else is taken care of by ConceptDraw professionals.
Let′s see how it works when creating cross-functional flowchart.
Sample 1. Cross-functional flow chart: Ordering process
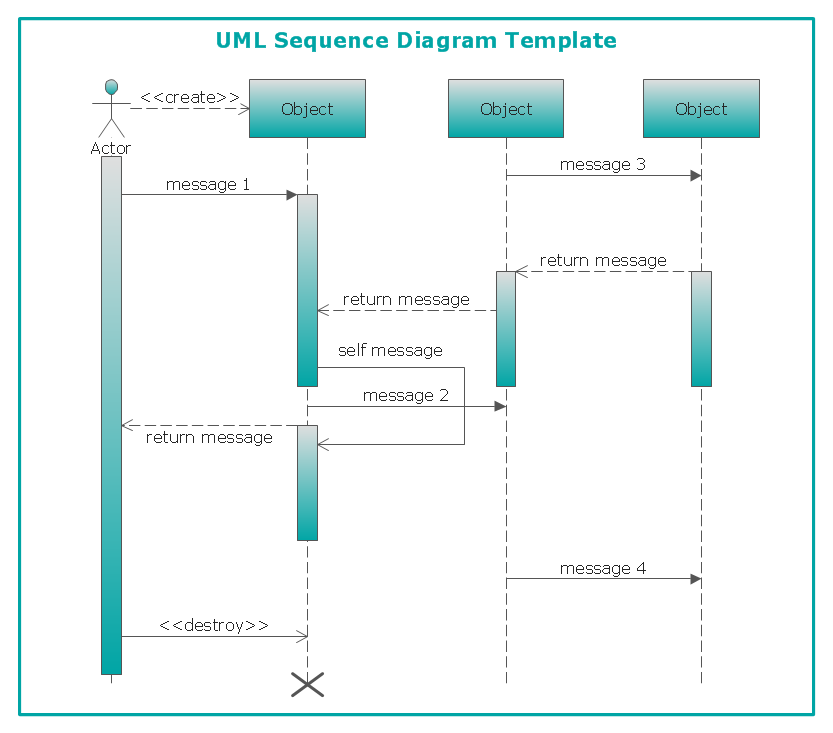
UML Sequence Diagram can be created using ConceptDraw DIAGRAM diagramming software contains rich examples and template. ConceptDraw is perfect for software designers and software developers who need to draw UML Sequence Diagrams.
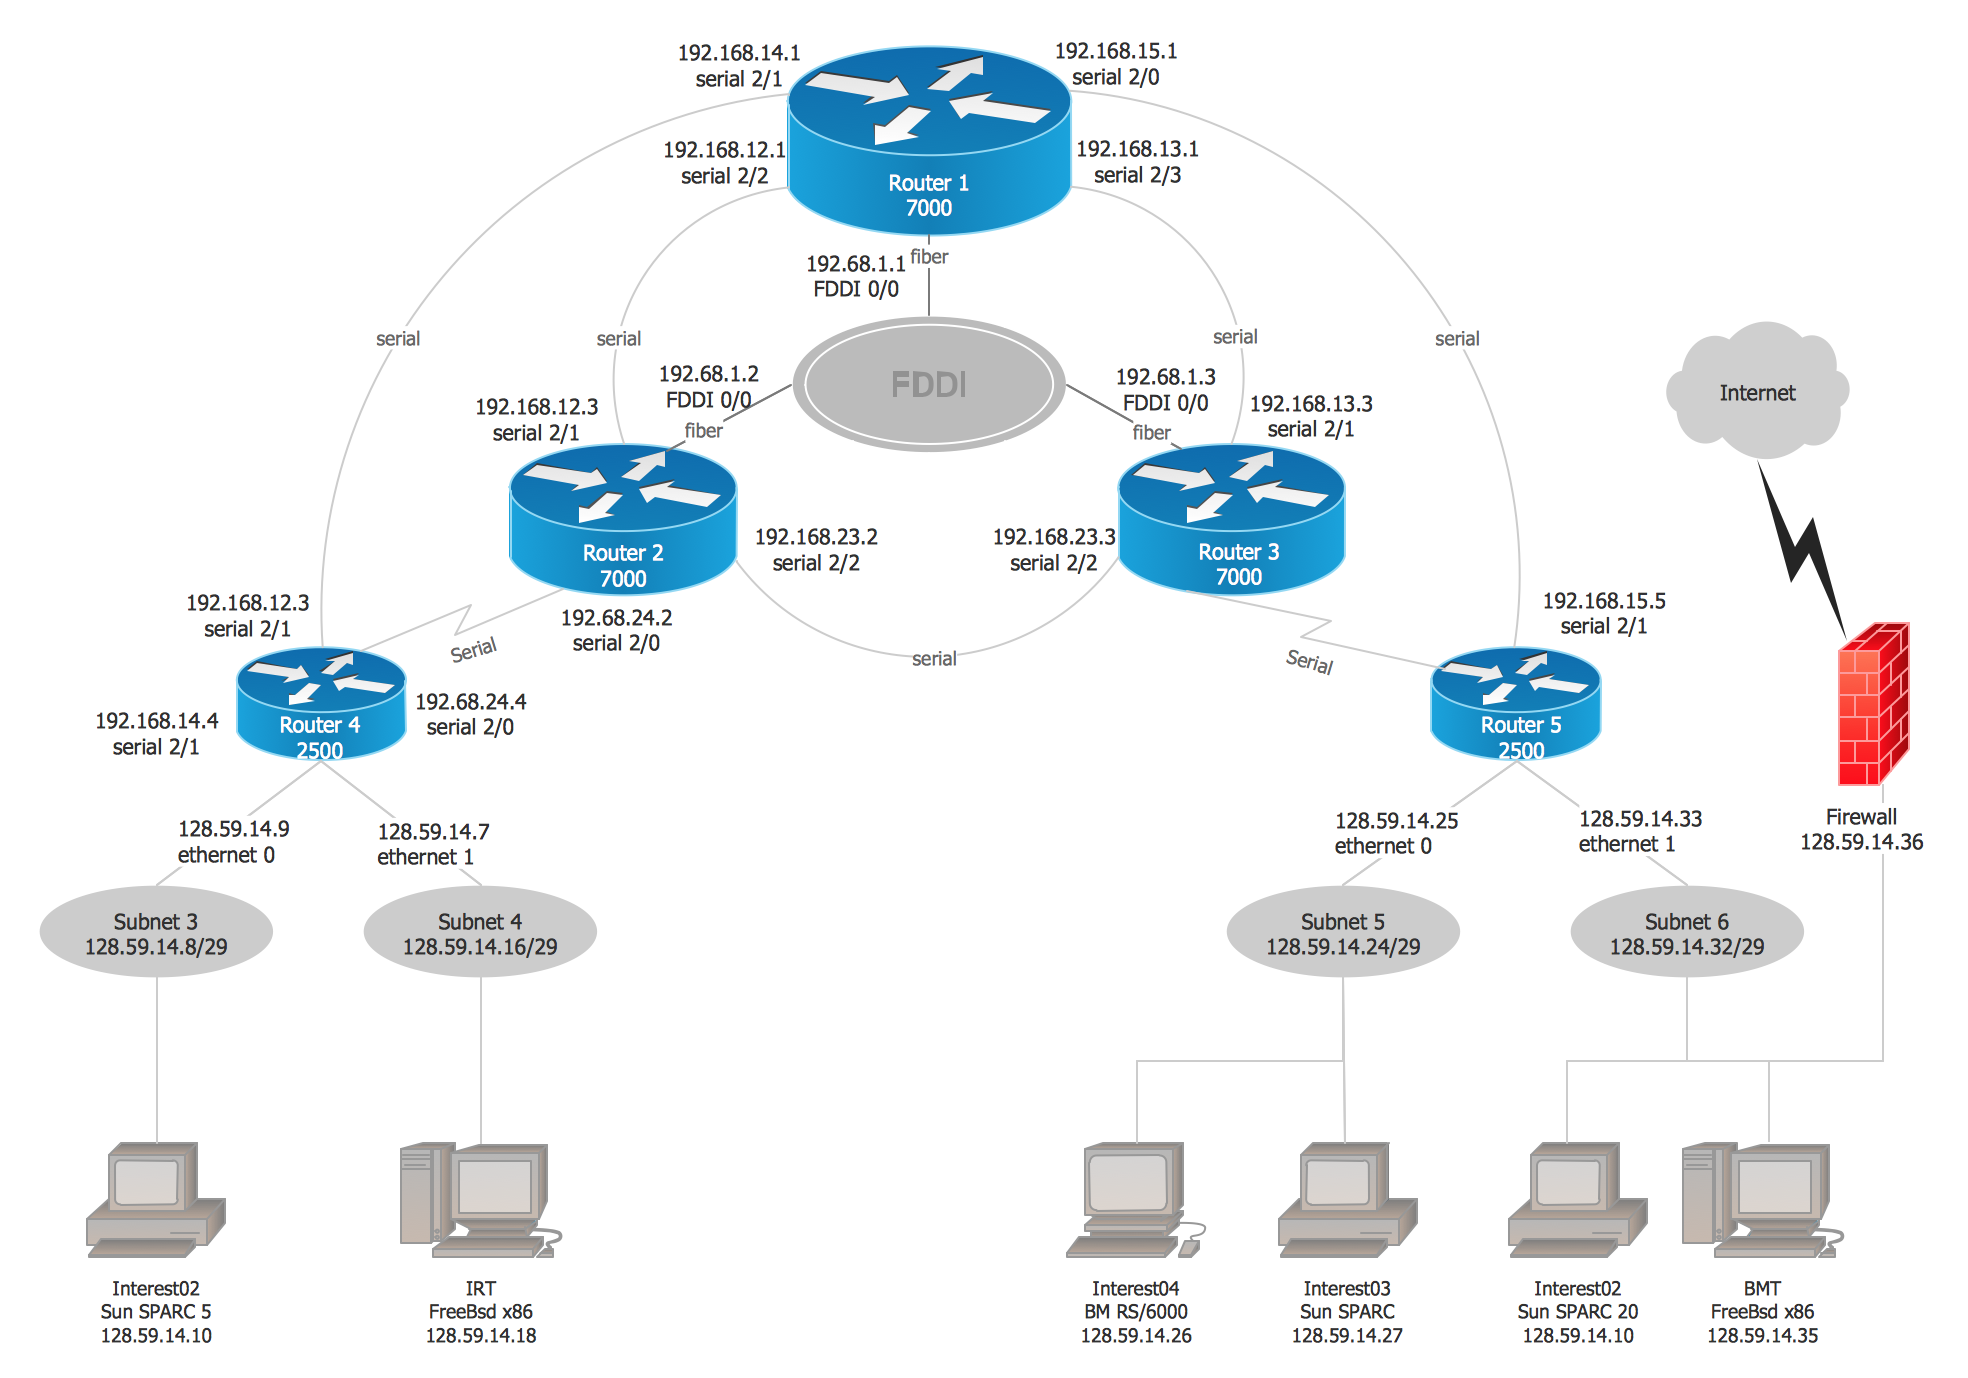
The Cisco Network Diagrams solution from the Computer and Networks area of ConceptDraw Solution Park provides a wide collection of predesigned templates and samples that help you to create the Cisco Network Diagrams in one moment.
IT world is extremely rational and logical. So what can be more precise than Software Diagrams to rate the results of work? Visual statistics is the best way to understand the data.
This figure demonstrates the data flow diagram (DFD), which was created to describe the electronic system of custom purchase. This is the process of buying using electronic bar code scanning system. Such systems are used in large stores. The cashier scans the bar code, the system outputs the data on the price of the goods and carries out a purchase process. This DFD utilizes the Gane/Sarson notation. To create it The ConceptDraw DFD solution has been applied.
The Accounting flowchart shows how information flows from source documents through the accounting records. The are based on the accounting procedures or processes.
Picture: What process should be essentially adopted.Accounting Flowchart Example
Start your business process mapping with conceptDraw DIAGRAM and its Arrows10 Technology. Creating a process map, also called a flowchart, is a major component of Six Sigma process management and improvement. Use Cross-Functional Flowchart drawing software for business process mapping (BPM).
Use a variety of drawing tools, smart connectors and shape libraries to create flowcharts of complex processes, procedures and information exchange. Define and document basic work and data flows, financial, production and quality management processes to increase efficiency of you business.
Picture: Cross Functional Flowchart for Business Process Mapping
Event-Driven Process chain Diagrams for improvement throughout an organisation. Best software for Process Flow Diagram. The Event-driven Process Chain (EPC) Diagrams allows managers to plan processes and resources.
Picture: Business process Flow Chart — Event-Driven Process chain (EPC) diagrams
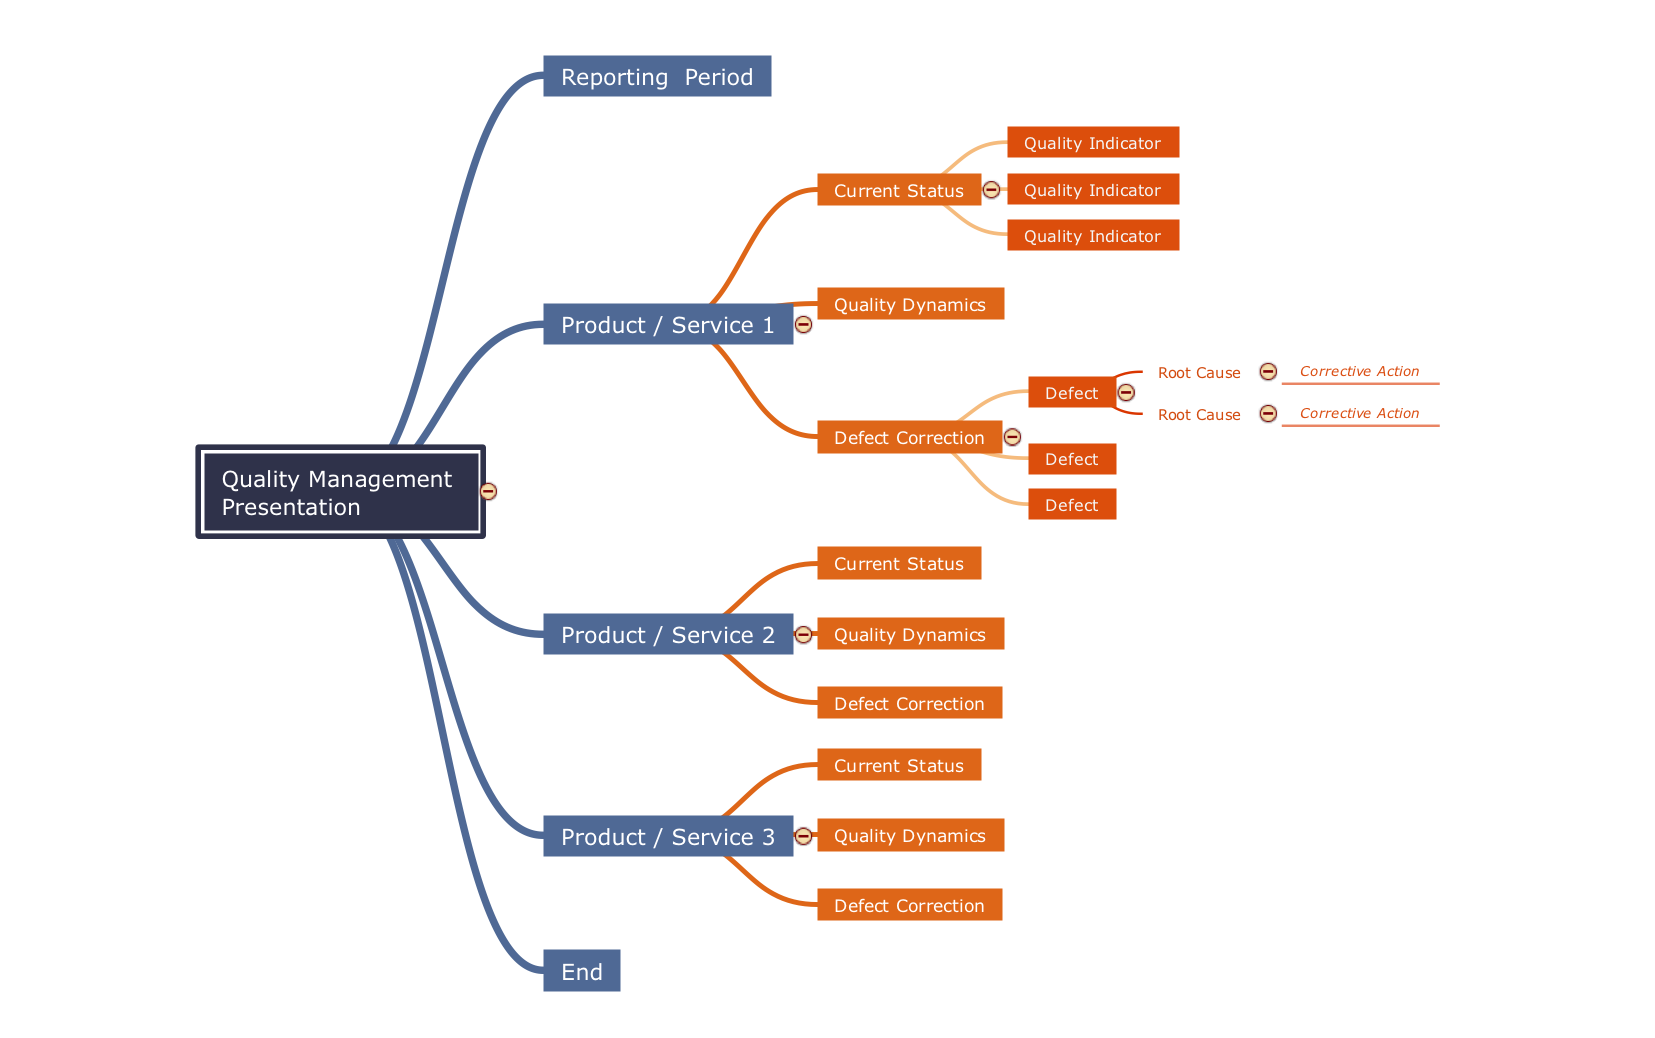
The Total Quality Management Diagram solution helps you and your organization visualize business and industrial processes. Create Total Quality Management diagrams for business process with ConceptDraw software.
Picture: TQM Software — Build Professional TQM Diagrams
Take a look on an example of Cross-Functional-Flowchart, showing the software service cross-function process flowcharts among the different departments. It presents a simple flowchart among the customer, sales, technical support, tester and development.
Try now Flowchart Software and Cross-Functional library with 2 libraries and 45 vector shapes of the Cross-Functional Flowcharts solution. Then you can use built-in templates to create and present your software service cross-function process flowcharts.