Social Media Response DFD Flowcharts - diagramming software ( Mac PC )
ConceptDraw DIAGRAM software provides tools to develop a response flowchart that can be connected with Action Mind Maps. Visual navigation through the stages of a response process helps you locate specific actions to be taken via Action Mind Maps.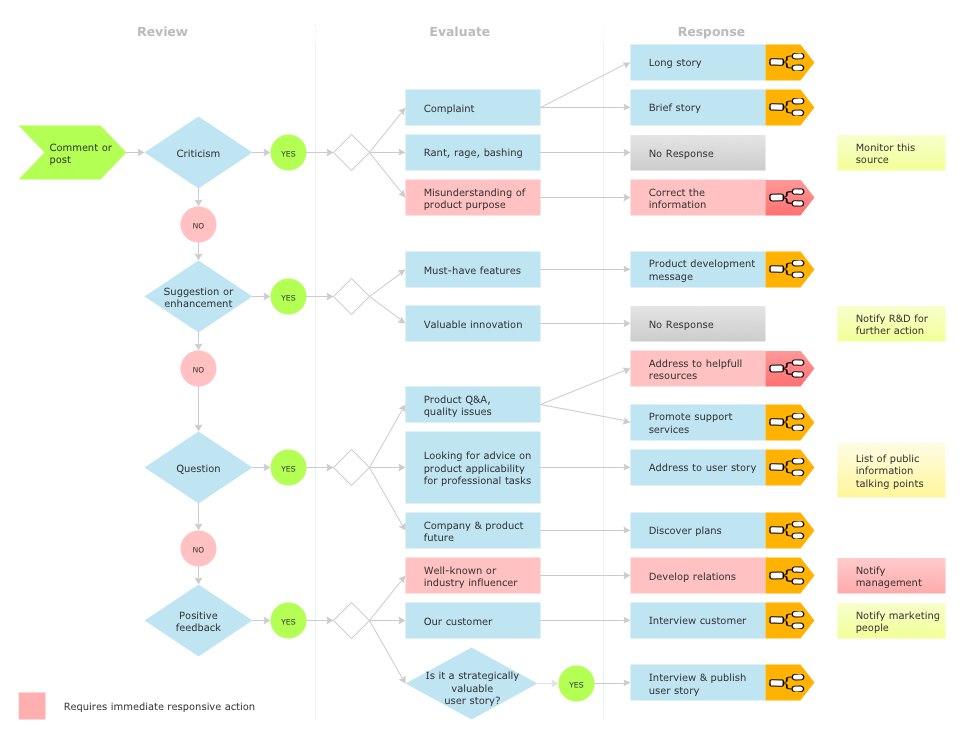
Sample 1. Social Media Response Flowchart
Management Chart Social Media Plan
The Interactive Flowcharts and Action Mind Maps demonstrate the solutions utilization, and management documents you can create using ConceptDraw DIAGRAM software for Mac or PC extended by Social Media Response Solution from ConceptDraw Solution Park.
See also Samples:
TEN RELATED HOW TO's:
The Pie Chart visualizes the data as the proportional parts of a whole and looks like a disk divided into sectors. The pie chart is type of graph, pie chart looks as circle devided into sectors. Pie Charts are widely used in the business, statistics, analytics, mass media. It’s very effective way of displaying relative sizes of parts, the proportion of the whole thing.
Picture: Pie Chart Word Template. Pie Chart Examples
Related Solution:
Network Topology in communication networks, a topology is a usually schematic description of the arrangement of a network, including its nodes and connecting lines. There are two ways of defining network geometry: the physical topology and the logical topology.
Network Topology Mapper offers extensive drawing tools professional-looking network diagrams quickly and easily allowing you to clearly represent and communicate network architecture, topology, and design to engineers, stakeholders and end-users.
Picture: Network Topology Mapper
Related Solution:
To support you in your tasks you can use the power of ConceptDraw DIAGRAM providing
intelligent vector graphics that are useful for management diagramming and
ConceptDraw MINDMAP for key management mind maps.
Picture: Business Productivity - Management
Related Solution:
Internet solutions on ConceptDraw base. What may interest developers of Internet solutions.
Picture: Software development with ConceptDraw products
This sample was created in ConceptDraw DIAGRAM diagramming and vector drawing software using the UML Deployment Diagram library of the Rapid UML Solution from the Software Development area of ConceptDraw Solution Park.
This sample shows the work of the ATM (Automated Teller Machine) banking system that is used for service and performing of the banking transactions using ATMs. System engineers can use comprehensive UML diagrams solution.
Picture: UML Deployment Diagram Example - ATM SystemUML diagrams
Related Solution:
The Rapid UML solution provides diagram examples, templates and vector stencils libraries for quick and easy drawing all types of UML 2.x and 1.x diagrams
Picture: UML Business Process
Related Solution:
A flowchart can take any process and distil it into a series of actions or decisions; it is a versatile and simple form of diagram that can be used to describe situations in any field, and is easily understood by everyone. They are used frequently in business to document workflows from all areas of a company - they can show accounting purchase orders, human resource recruitment strategy, or a product life cycle.
ConceptDraw DIAGRAM diagramming and vector drawing software extended with Flowcharts Solution from the Diagrams Area of ConceptDraw Solution Park is a perfect powerful tool for extremely easy designing professional looking Flow Diagram.
Picture: Flow Diagram
Related Solution:
Working with personnel might be difficult if you are not prepared enough. To explain your workers all the details of communication with customers, you can draw an order process flowchart which will describe every step of the process and answer all the questions that might appear. You can view a lot of business process mapping diagram examples here, in ConceptDraw Solution Park.
This business process flow chart is created to illustrate the sample work order process. Before an organization can make some work for a person, the customer work order request must be completed. It is needed for tracking and accountability objectives. We used this business process flowchart to show a certain tasks and actions assumed by an organization. This flowchart depicts the outside inputs that are needed to launch a process, and ways the organization delivers its outputs. This business process flowchart was created with a help of ConceptDraw Business Process Mapping solution.
Picture: Work Order Process Flowchart. Business Process Mapping Examples
Related Solution:
The use of the special software with Plant Design Solutions is a real help for effective creating the Plant Plan, Plant Layout Plan, Process Plant Layout, Plant Design. ConceptDraw DIAGRAM is the best diagramming and vector drawing software. It offers the Plant Layout Plans Solution from the Building Plans Area for achievement this goal.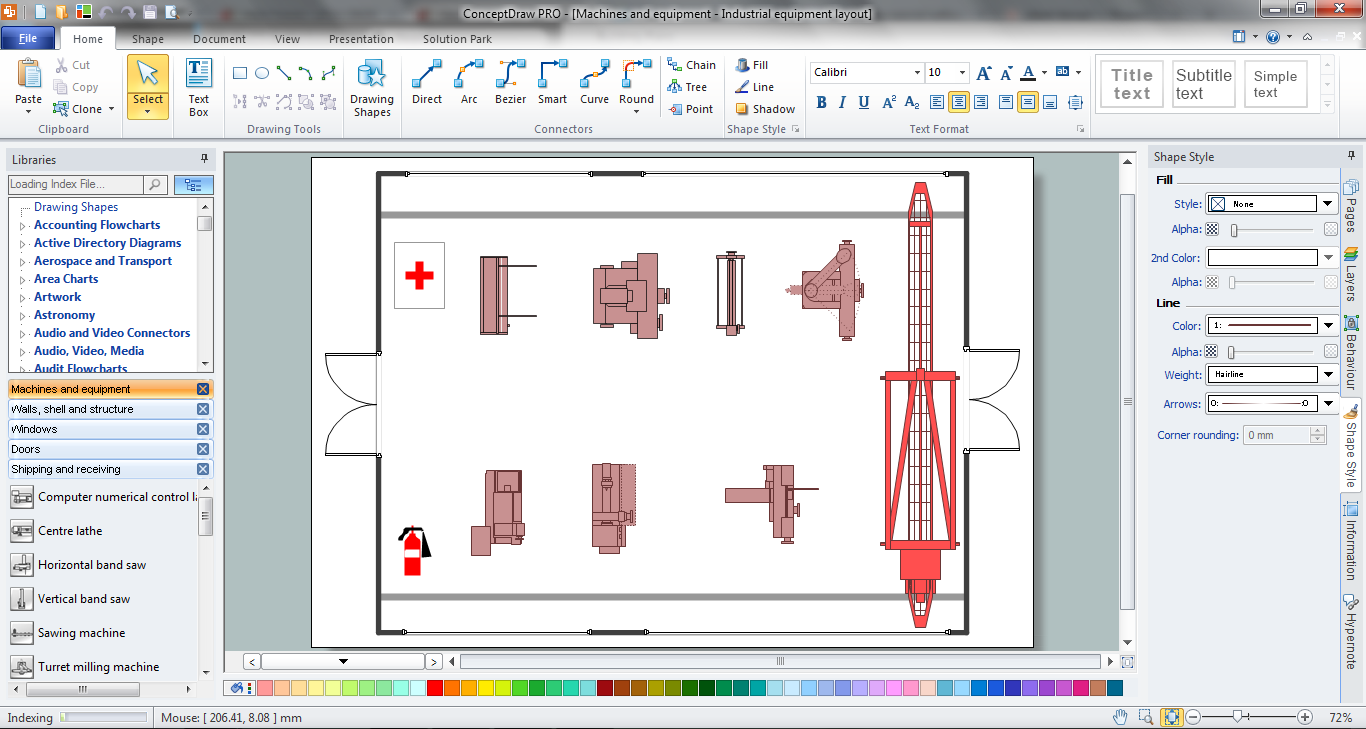
Picture: Plant Design Solutions
Related Solution:
What is Purchasing Process and How to Meet The Standards. Common key elements of purchasing process representation.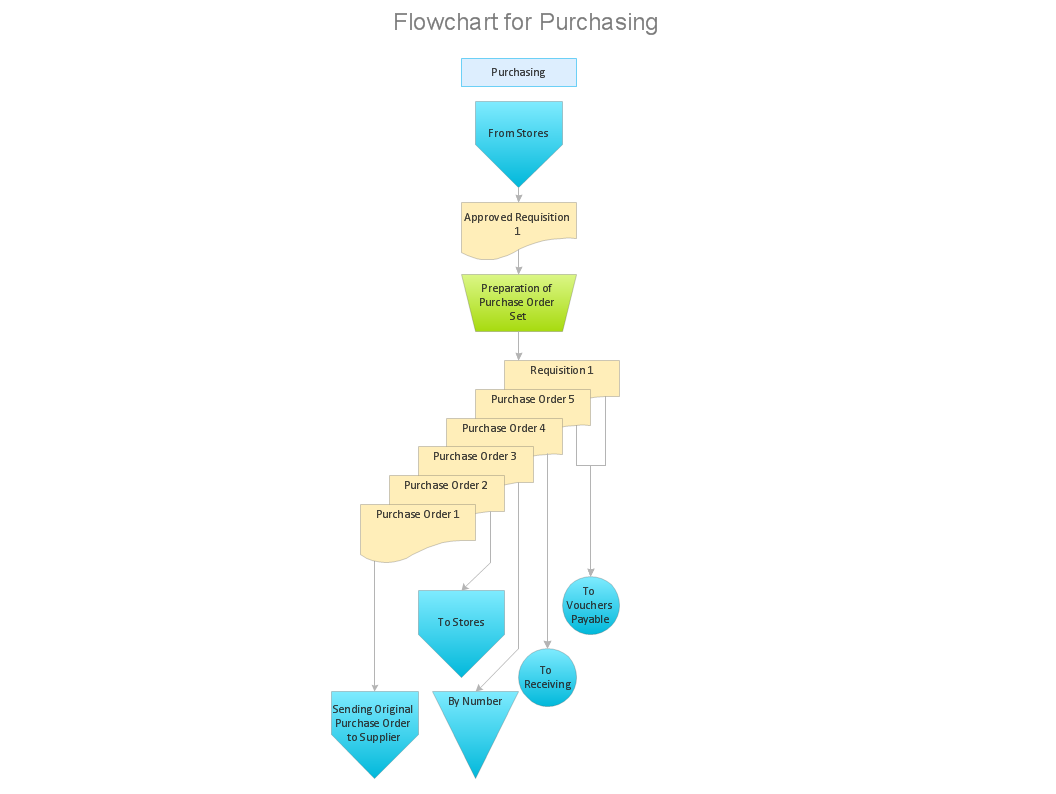
Picture: Why is it important to have a formal purchasing process?
Related Solution:
ConceptDraw
DIAGRAM 18