Cross Functional Flowchart for Business Process Mapping
Cross Functional Flowchart
Cross-functional flowcharts — this type of flowchart is constructed as a matrix, arranged into 'swimlanes' that denote different stakeholders or departments. It shows each individuals activities, and how the work flow crosses departments to form a complete process.
Each flowchart is of a certain level (between 0 and 4) based on the amount of detail the flowchart contains. A level 0 flowchart represents the least amount of detail, and usually contains one or two steps. A level 4 flowchart represents the most amount of detail, and can include hundreds of steps.
Drawing diagrams fast
How should diagramming software work? Is it possible to develop a diagram as quickly as the ideas come to you?
The innovative ConceptDraw Arrows10 Technology included in ConceptDraw DIAGRAM is a powerful drawing flowcharting software that changes the way diagrams are produced.
While making the drawing process easier and faster.
ConceptDraw DIAGRAM is a powerful tool that helps you create professional looking cross-functional flowcharts with the well-designed objects. ConceptDraw DIAGRAM allows you to focus on work, not the drawing process. ConceptDraw Arrows10 Technology allows to draw connectors with smart behavior that gives flexibility to you during work process.
Video. How to Draw Cross Functional Flowchart for Business Process Mapping
ConceptDraw DIAGRAM diagramming software provides vector shapes and connector tools for quick and easy drawing diagrams for business, technology, science and education.
Sample 4. Cross-Functional Flowchart solution
Use ConceptDraw DIAGRAM enhanced with solutions from ConceptDraw Solution Park to create diagrams to present and explain structures, process flows, logical relationships, networks, design schemes and other visually organized information and knowledge.
The Ishikawa diagram, Cause and Effect diagram, Fishbone diagram — all they are the names of one and the same visual method for working with causal connections. Originally invented by Kaoru Ishikawa to control the process quality, the Ishikawa diagram is well proven in other fields of management and personal scheduling, events planning, time management. It is a chart in the form of a fish, whose head is a problem, the fins are variants for its causes.
To design easily the Fishbone diagram, you can use a special ConceptDraw DIAGRAM vector graphic and diagramming software which contains the powerful tools for Fishbone diagram problem solving offered by Fishbone Diagrams solution for the Management area of ConceptDraw Solution Park.
Visio Files and ConceptDraw. ConceptDraw DIAGRAM is compatible with MS Visio.VDX formatted files.VDX is Visio’s open XML file format, and it can be easily imported and exported by ConceptDraw DIAGRAM.
Use case diagrams are used at the development of software and systems for definition of functional system requirements or system of systems. Use case diagram presents the consecution of object’s actions (user’s or system’s) which are executed for reaching the definite result.
Picture: Use Case Diagrams technology with ConceptDraw DIAGRAM
Draw your own business process flowcharts using ConceptDraw DIAGRAM diagramming and business graphics software.
The Flowcharts Solution for ConceptDraw DIAGRAM is a comprehensive set of examples and samples in several different color themes for professionals that need to graphically represent a process.
Create bar charts for visualizing problem solving in manufacturing and economics using the ConceptDraw DIAGRAM diagramming and vector drawing software extended with the Bar Graphs Solution from the Graphs and Charts area of ConceptDraw Solition Park.
Picture: Bar Diagrams for Problem Solving. Create manufacturing and economics bar charts with Bar Graphs Solution
The Event-driven Process Chain ( EPC ) Diagrams allows users present business process models in terms of work flows. The EPC diagram can show various ways for improvement throughout an organisation.
Picture: EPC Diagrams Illustrate Business Process Work Flows
It can be tough to get straight into business papers and processes.Otherwise, you can learn how to create flowcharts for an accounting information system and visualize these documents. Accounting diagrams are clear and easy to understand for all the participants of the process.
There are symbols used for creating accounting flowcharts using ConceptDraw DIAGRAM and its Accounting Flowcharts solution. Accounting flow charts are a special kind of flow charts. Actually a variety of flowcharts are often used to facilitate many aspects of a workflow of accounting department. Accounting flowcharts are utilized to support creating accounting documentation, to depict positions responsible for fulfillment of each phase of accounting workflow.
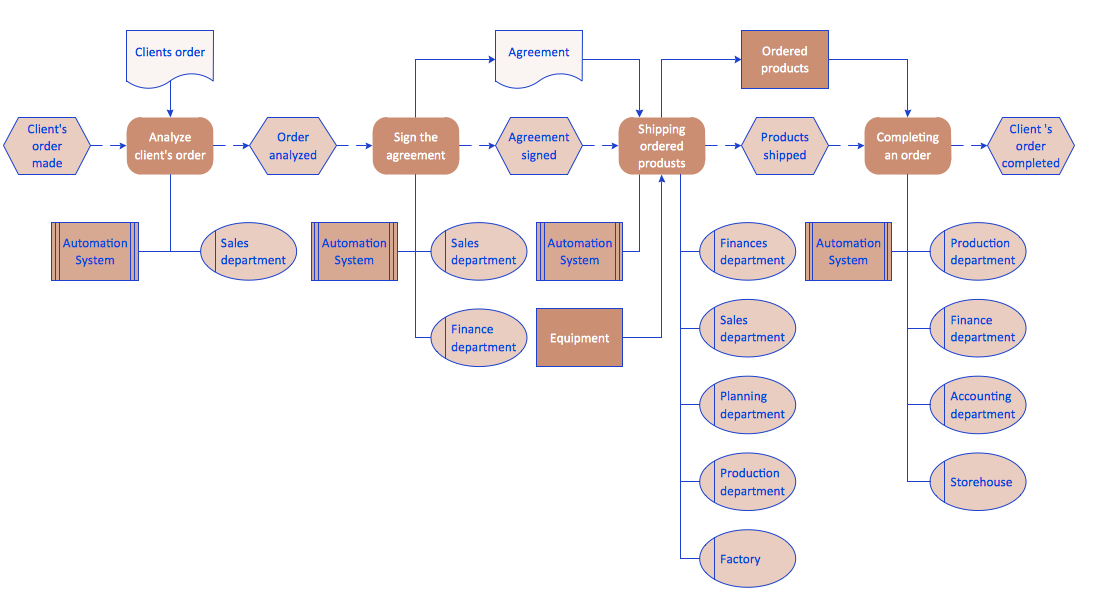
Start your business process mapping with conceptDraw DIAGRAM and its Arrows10 Technology. Creating a process map, also called a flowchart, is a major component of Six Sigma process management and improvement. Use Cross-Functional Flowchart drawing software for business process mapping (BPM).
Use a variety of drawing tools, smart connectors and shape libraries to create flowcharts of complex processes, procedures and information exchange. Define and document basic work and data flows, financial, production and quality management processes to increase efficiency of you business.
Picture: Cross Functional Flowchart for Business Process Mapping
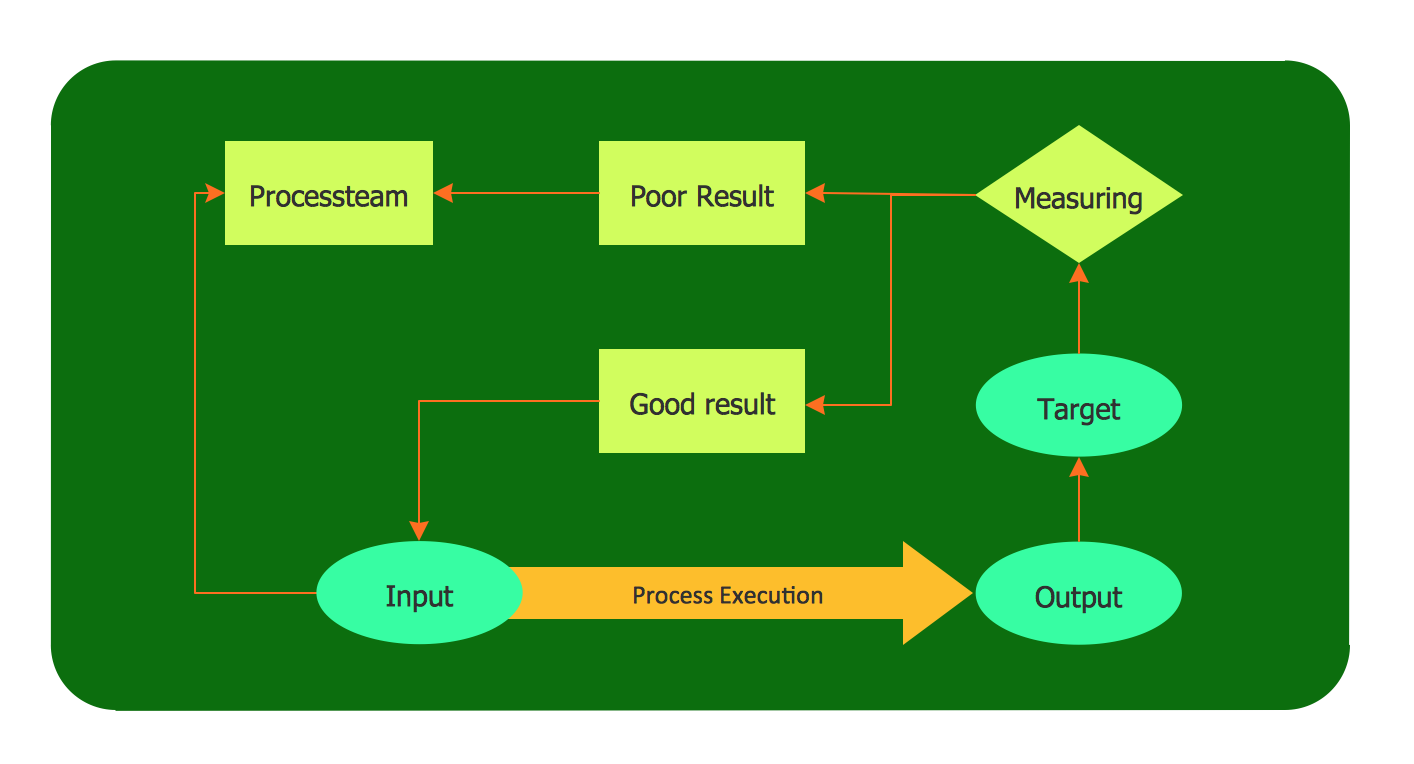
The Total Quality Management Diagram solution helps you and your organization visualize business and industrial processes. Create Total Quality Management diagrams for business process with ConceptDraw software.
Picture: Organizational Structure Total Quality Management