Process Flow Diagram
What is a Process Flow Diagram
A Process Flow Diagram (PFD) is a diagram which shows the relationships between the main components in a system. Process Flow Diagrams are widely used by engineers in chemical and process engineering, they allows to indicate the general flow of plant process streams and equipment, helps to design the petroleum refineries, petrochemical and chemical plants, natural gas processing plants, and many other industrial facilities.
Process Flow Diagram is focused on the representation the major equipment and doesn't show minor equipment details and designations. The PFD of a single unit process can include:
- process piping;
- major equipment items, symbols, names and identification numbers;
- recirculation streams and major bypass;
- control valves and other valves which influence on the system's work, monitor and control the operations of the processes;
- flow directions;
- interconnections with other systems;
- the set of operational data - pressure, temperature, flow rate, density, operational values for the pumps, compressors, distillation columns and other vessels, composition of fluids, process stream names, amount and composition of all the major process streams, amount of heat, system ratings, etc.

Example 1. Process Flow Diagram - Crude Oil Distillation Unit
Benefits of Process Flow Diagram
The Process Flow Diagram has a wide set of benefits:
- gives a clear documentation of a process;
- allows to define and offers common understanding of processes;
- helps to build a process visual representation for analysis, discussion, and communication;
- allows to identify the scope of the process;
- allows to trace and analyze the process steps;
- helps to standardize and find areas for monitoring, improvement and increased efficiency in a process;
- allows to find and detach the steps of the process that are not essential;
- helps in understanding the logic of complex problems;
- offers a guidance for managers overseeing operations;
- shows the plant design basis, the arrangement of major equipment, process lines, main control loops;
- indicates feedstock, product, main streams flow rates and operating conditions;
- facilitates communication between programmers and business people;
- helps programmers to write the programs of any complexity and on the any high level language;
- helps in debugging process and provides efficient program maintenance;
- helps to understand and explain to other people the logic of the complex problems and their solution;
- assists to improve teamwork effectiveness.
Design a Process Flow Diagram in ConceptDraw DIAGRAM
ConceptDraw DIAGRAM diagramming and vector drawing software extended with powerful tools of Flowcharts Solution from the "Diagrams" Area of ConceptDraw Solution Park is effective for drawing:
- Process Flow Diagram
- Flow Process Diagram
- Business Process Flow Diagrams
Flowcharts Solution offers collection of predesigned samples and 2 libraries with variety of predesigned vector shapes for easy drawing Process Flow Diagrams:
- Flowchart library contains 26 objects,
- Flowcharts Rapid Draw library contains 39 objects.
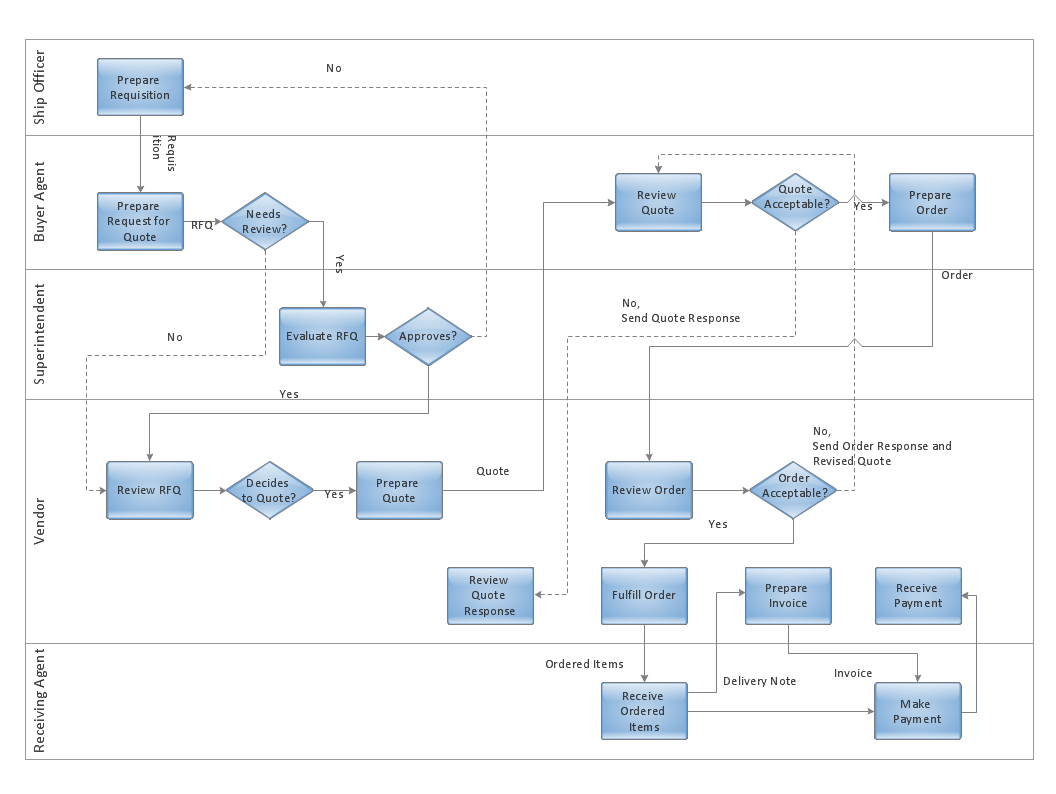
Example 2. Process Flow Diagram. Design Elements — Invoice Payment Process Flowchart for Apple OS X and Windows
The Process Flow Diagrams you see on this page were created in ConceptDraw DIAGRAM software using the Flowcharts Solution and Chemical and Process Engineering Solution. These samples are available from ConceptDraw STORE.
Use the tools of Flowcharts Solution for ConceptDraw Solution Park for fast and easy designing professional looking Process Flow Diagram, and then successfully use it in your work activity.
All source documents are vector graphic documents. They are available for reviewing, modifying, or converting to a variety of formats (PDF file, MS PowerPoint, MS Visio, and many other graphic formats) from the ConceptDraw STORE. The Flowcharts Solution is available for all ConceptDraw DIAGRAM or later users.
TEN RELATED HOW TO's:
ConceptDraw DIAGRAM is the beautiful design software that provides many vector stencils, examples and templates for drawing different types of illustrations and diagrams.
Mathematics Solution from the Science and Education area of ConceptDraw Solution Park includes a few shape libraries of plane, solid geometric figures, trigonometrical functions and greek letters to help you create different professional looking mathematic illustrations for science and education.

Picture: Scientific Symbols Chart
Related Solution:
A process flow chart is a sequence diagram on events, actions, tasks and decisions that are visualized in a form of inputs and outputs. Such flow chart involves a defined number of standard symbols and notation keys used to help one understand and pass the information.
Process flow charts have become a day-to-day tool for chemical engineers, technologists and production engineers as well as software developers. However, their use has recently increased in other areas such as business, manufacturing and, especially a service sector.
Picture: Example Process Flow Chart
Related Solution:
Chemical and Process Engineering solution contains variety predesigned process flow diagram elements relating to instrumentation, containers, piping and distribution necessary for chemical engineering, and can be used to map out chemical processes or easy creating various Chemical and Process Flow Diagrams in ConceptDraw DIAGRAM.
Picture: Process Flow Diagram Symbols
Related Solution:
When trying to figure out the nature of the problems occurring within a project, there are many ways to develop such understanding. One of the most common ways to document processes for further improvement is to draw a process flowchart, which depicts the activities of the process arranged in sequential order — this is business process management. ConceptDraw DIAGRAM is business process mapping software with impressive range of productivity features for business process management and classic project management. This business process management software is helpful for many purposes from different payment processes, or manufacturing processes to chemical processes. Business process mapping flowcharts helps clarify the actual workflow of different people engaged in the same process. This samples were made with ConceptDraw DIAGRAM — business process mapping software for flowcharting and used as classic visio alternative because its briefly named "visio for mac" and for windows, this sort of software named the business process management tools.
This flowchart diagram shows a process flow of project management. The diagram that is presented here depicts the project life cycle that is basic for the most of project management methods. Breaking a project into phases allows to track it in the proper manner. Through separation on phases, the total workflow of a project is divided into some foreseeable components, thus making it easier to follow the project status. A project life cycle commonly includes: initiation, definition, design, development and implementation phases. Distinguished method to show parallel and interdependent processes, as well as project life cycle relationships. A flowchart diagram is often used as visual guide to project. For instance, it used by marketing project management software for visualizing stages of marketing activities or as project management workflow tools. Created with ConceptDraw DIAGRAM — business process mapping software which is flowcharting visio alternative or shortly its visio for mac, this sort of software platform often named the business process management tools.
Picture: Process Flowchart: A Step-by-Step Comprehensive Guide
Related Solution:
Use ConceptDraw DIAGRAM software with Flowcharts Solution to create Process Flow Charts, Flow Chart Process Maps, and High-Level Process Flow Charts to illustrate ✔️ high-level processes in industrial, chemical, and process engineering, ✔️ major plant processes, ✔️ minor details
Picture: Process Flow Chart
Related Solution:
A flowchart is a simple but very functional tool when it comes to understanding a workflow or to removing unnecessary stages from a process. When drawing flowcharts, keep in mind that there are four common types of flowcharts, like document flowcharts and data flowcharts that show control over a data or document flow over a system. To show controls on a physical level, use system flowcharts. In addition, to show controls in a program, you can draw a program flowchart.
This flowchart diagram represents the piece of an article editing process, that involves the author and editor. It was created using the Basic Flowchart notation that consists from the basic flowchart symbols. The start and the end of the process are indicated with "Terminator" symbols. The "Process" symbols show the action steps consisting from making edits and searching for a compromise, when the author does not agree with the suggestions of the editor. The "Process" symbol is the general symbol in process flowcharts. The "Decision" symbol indicates a branching in the process flow. There are two branches indicated by a Decision shape in the current flowchart (Yes/No, Disagree/Agree). This basic flowchart can be used as a repeating unit in the workflow diagram describing the working process of some editorial office.
Picture: Types of Flowcharts
Related Solution:
Below you can see the symbol for pool table. You can find this symbol in the library of the Floor Plans Solution and use it in your floor plan of the sport complex, home, etc.
ConceptDraw DIAGRAM is a powerful diagramming and vector drawing software for creating the different Floor Plans. It’s very convenient, simple and quick to design the professional looking Floor Plans of any difficulty in ConceptDraw DIAGRAM.
Picture: Symbol for Pool Table for Floor Plans
Related Solution:
ConceptDraw DIAGRAM enhanced with Flowcharts Solution is the best flow chart maker online design software. Use it to ✔️ create clear and actionable Flowcharts, ✔️ improve decision-making, ✔️ enhance problem-solving in various scenarios, ✔️ enhance creativity and productivity across industries, ✔️ streamline workflows
Picture: Flow Chart Online
Related Solution:
Enjoy the flowcharting process with the intuitive interface and powerful tools of the user-friendly ConceptDraw DIAGRAM software: ✔️ represent algorithms, ✔️ break down complex processes, ✔️ display workflows, ✔️ show procedures, ✔️ succeed in decision-making, ✔️ streamline processes, ✔️ increase productivity, ✔️ enhance efficiency
Picture: Flowcharting Software
Related Solution:
The human organism is so constituted that for a full life you need a wide range of nutrients, minerals and vitamins. To get all this, it is necessary to enrich your nutrition by natural and healthy food. The same microelements and nutrients are contained in different foods, so it is very important to create your own healthy diet plan, based on your preferences and containing the balance of nutrients suitable for you.
ConceptDraw DIAGRAM diagramming and vector drawing software extended with Health Food solution from the Food and Beverage area of ConceptDraw Solution Park contains powerful tools for designing healthy diet plan.
Picture: Healthy Diet Plan
Related Solution: