Quality Mind Map Solution
The Quality Mind Map Solution extends ConceptDraw MINDMAP with the addition of a number of Quality Management Mind Maps (Presentations, Meeting Agendas, and problem-solving techniques). These map templates are great starting points to identify, track, and address quality initiatives in your organization.
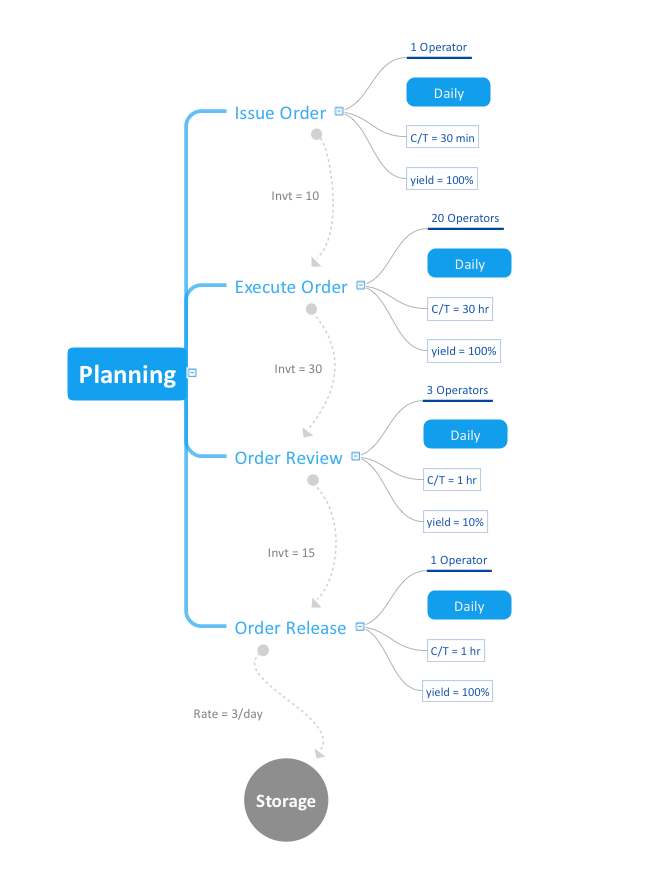
Pic.1 Mind map - Value stream mapping (VSM).
This mind map shows how Value Stream Maps can be represented as a mind map. Value Stream Maps can help a manufacturing team visualize the material and information flow required to deliver a product or a service to customers. Value Stream Maps are used in the Lean Manufacturing methodology to analyse and identify potential process improvement opportunities.
See also Samples:
TEN RELATED HOW TO's:
ConceptDraw DIAGRAM diagramming and vector drawing software extended with Business Diagrams Solution from the Management Area is a powerful Bubble Chart Maker.
Picture: Bubble Chart Maker
Related Solution:
This mind map demonstrates how the well-known Total Quality Management (TQM) methodology can be presented in a mind map. Using mind mapping for quality management is a creative approach that allows one to structure all key quality points on the one page.
Picture: Total Quality Management
Related Solution:
Use ConceptDraw Value Stream Maps (VSM) visualization for a manufacturing plant the material and information flow required to deliver a product or service to customers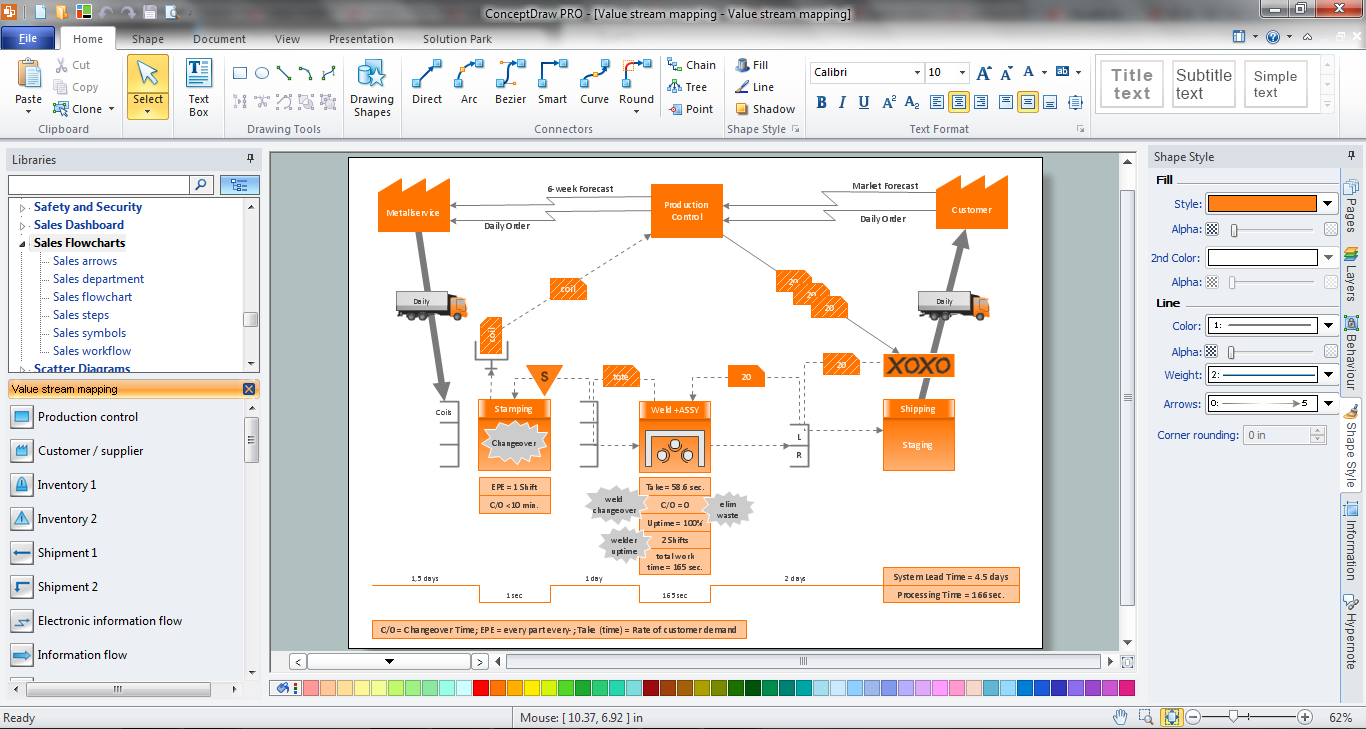
Picture: Value Stream Mapping
Related Solution:
What is a Process Flow Map? It is a chart which visually illustrates a business process and how its steps work together. Process Flow Maps help companies define problem areas, inefficient activities for the purpose of further increasing performance and profitability of businesses. ConceptDraw DIAGRAM diagramming and vector drawing software extended with Flowcharts solution from the Diagrams area of ConceptDraw Solution Park is efficient and productive software for fast and simple creating professional looking Process Flow Map.
Picture: Process Flow Maps
Related Solution:
ConceptDraw MINDMAP with Quality mindmaps solution as a demonstration of the creative approach to quality management in daily work of quality management team.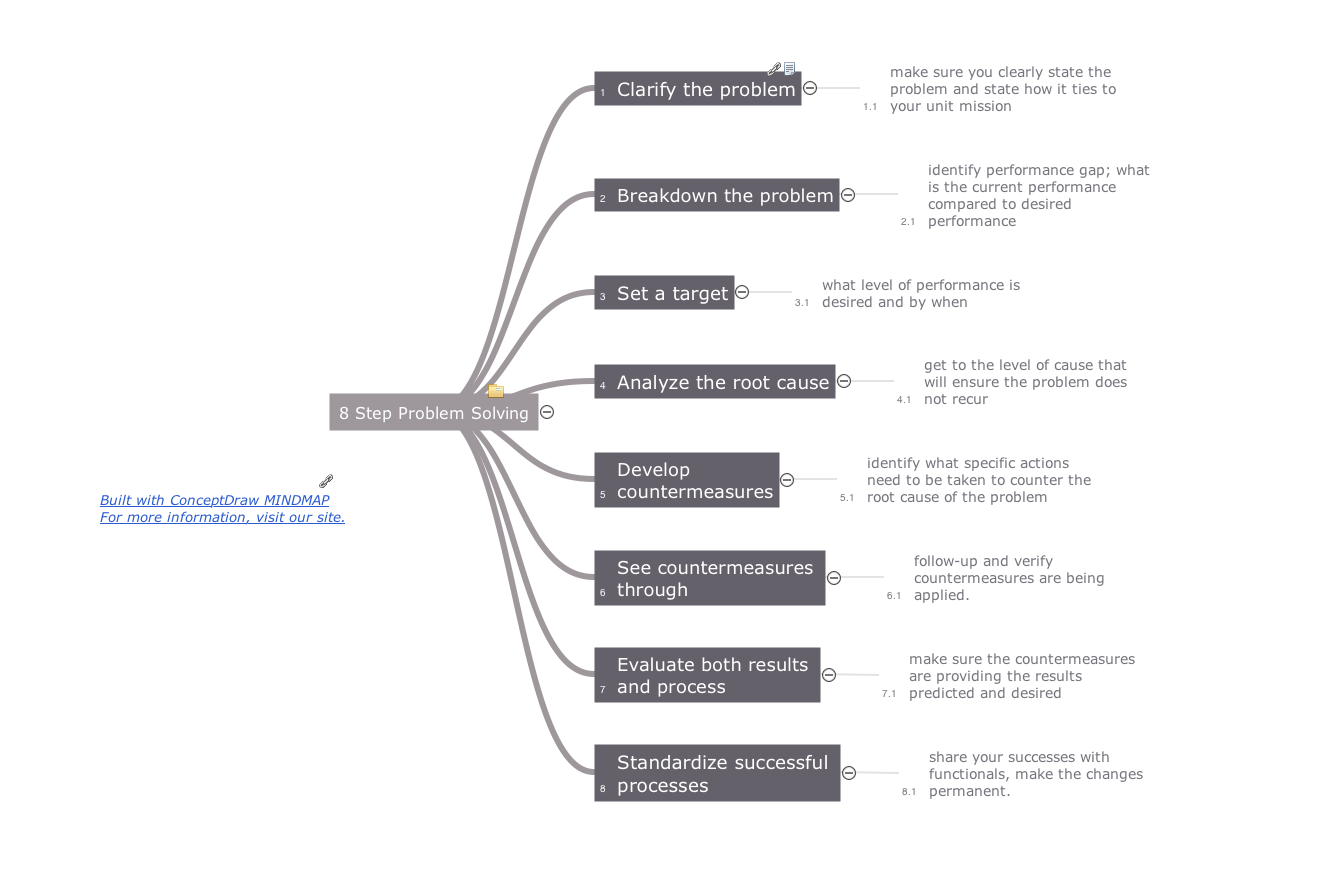
Picture: Quality Management Teams
Related Solution:
Collaborating with co-workers is very important, not only in order to get things done effectively, but also to keep in touch with the outside world. Great way for business collaboration is Skype.
Picture: Online Collaboration via Skype
Related Solution:
The Total Quality Management Diagram solution helps your organization visualize business and industrial processes. Create Total Quality Management diagrams for business process with ConceptDraw software.
Picture: Probability Quality Control Tools
Related Solution:
What is a Concept Map and what software is effective for its design? A concept map or conceptual diagram is a diagram that depicts suggested relationships between concepts. As for effective software - we suggest you to pay attention for the ConceptDraw DIAGRAM diagramming and vector drawing software. Extended with Concept Maps Solution from the Diagrams Area it is a real godsend for you.
Picture: What Is a Concept Map
Related Solution:
The Quality Mind Map Solution extends ConceptDraw MINDMAP with the addition of a number of Quality Management Mind Maps (Presentations, Meeting Agendas, and problem-solving techniques).
Picture: Quality Mind Map Solution
Related Solution:
ConceptDraw DIAGRAM is a powerful intelligent vector graphics engine that can be used to create basic diagrams including flowcharts, charts, workflows, flowcharts, organizational charts, business diagram, learn business diagrams, flow diagrams.
Picture: The Best Mac Software for Diagramming or Drawing
Related Solution:
ConceptDraw
MINDMAP 16