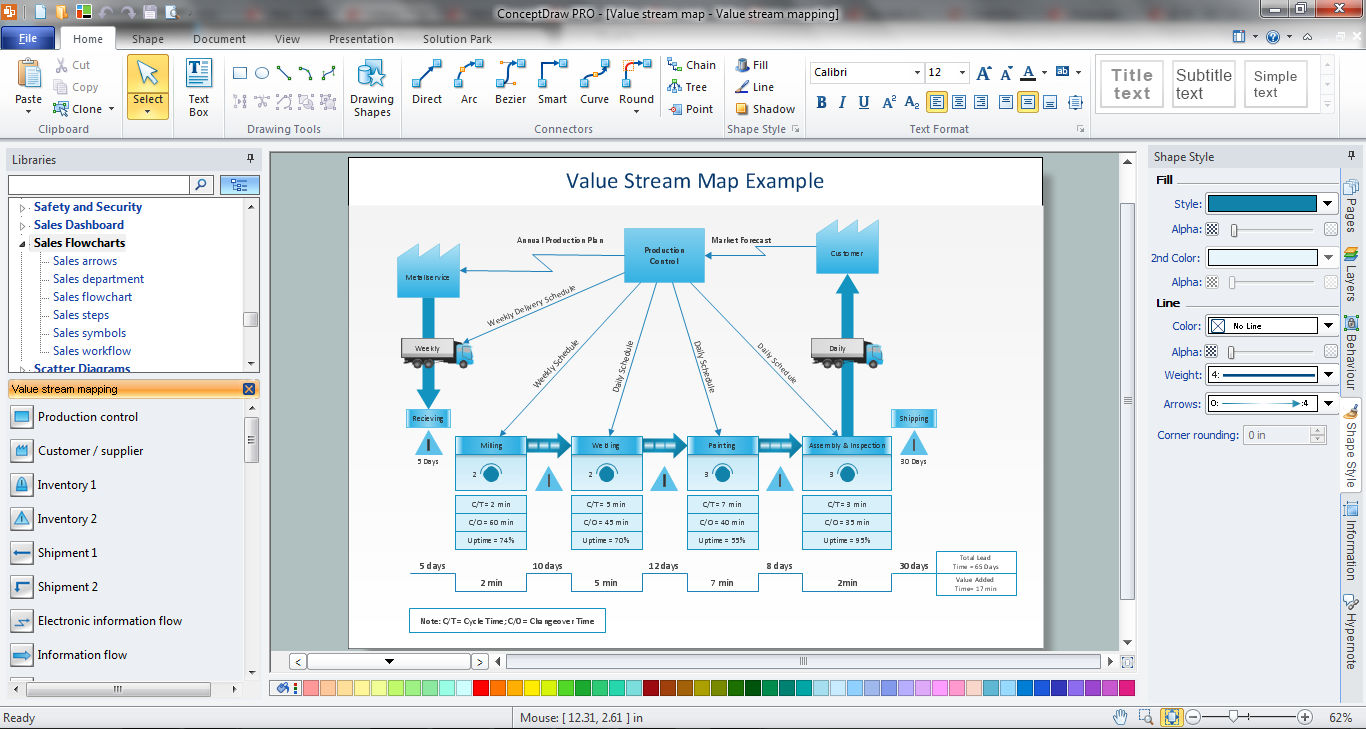
Example 1. ConceptDraw DIAGRAM — Value Stream Mapping Software
Value Stream Mapping Solution extends ConceptDraw DIAGRAM software with templates and samples. It offeas a collection of vector stencils for easy drawing and analyzing professional-looking Value Stream Maps (VSM). All these tools allow simple illustrating the lean manufacturing methodology and providing value stream analysis.

Example 2. Value Stream Mapping Sample
The following features make ConceptDraw DIAGRAM the best Value Stream Mapping software:
- You don't need to be an artist to draw professional-looking diagrams in a few minutes.
- Large quantity of ready-to-use vector objects makes your drawing diagrams quick and simple.
- Great number of predesigned templates and samples give you the good start for your own diagrams.
- ConceptDraw DIAGRAM provides you the possibility to use the grid, rules and guides. You can easily rotate, group, align, arrange the objects, use different fonts and colors to make your diagram exceptionally looking.
- All ConceptDraw DIAGRAM documents are vector graphic files and are available for reviewing, modifying, and converting to a variety of formats: image, HTML, PDF file, MS PowerPoint Presentation, Adobe Flash, MS Visio.
- Using ConceptDraw STORE you can navigate through ConceptDraw Solution Park, managing downloads and updates. You can access libraries, templates and samples directly from the ConceptDraw STORE.
- If you have any questions, our free of charge support is always ready to come to your aid.
TEN RELATED HOW TO's:
It’s very important that your basketball illustrations looked bright, beautiful, interesting and attracted the attention. For this you just need to add the illustrations! The Basketball solution delivers two libraries with predesigned vector clipart objects. Simply drag the needed clipart to your diagram to make it successful.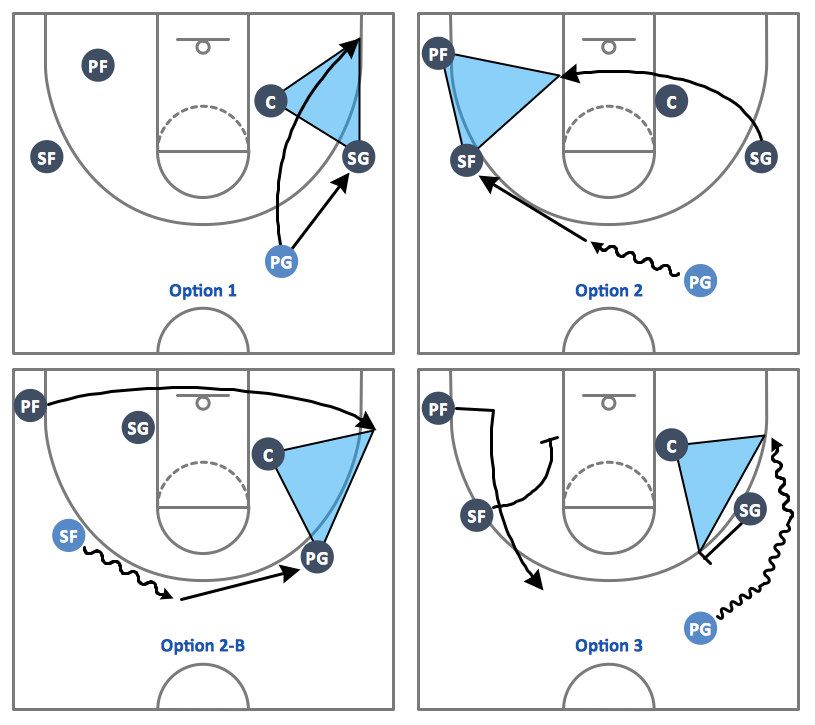
Picture: Basketball Illustrations
Related Solution:
ConceptDraw DIAGRAM is a powerful Network Engineering software thanks to the Vehicular Networking Solution and many other networking solutions from the Computer and Networks Area of ConceptDraw Solution Park.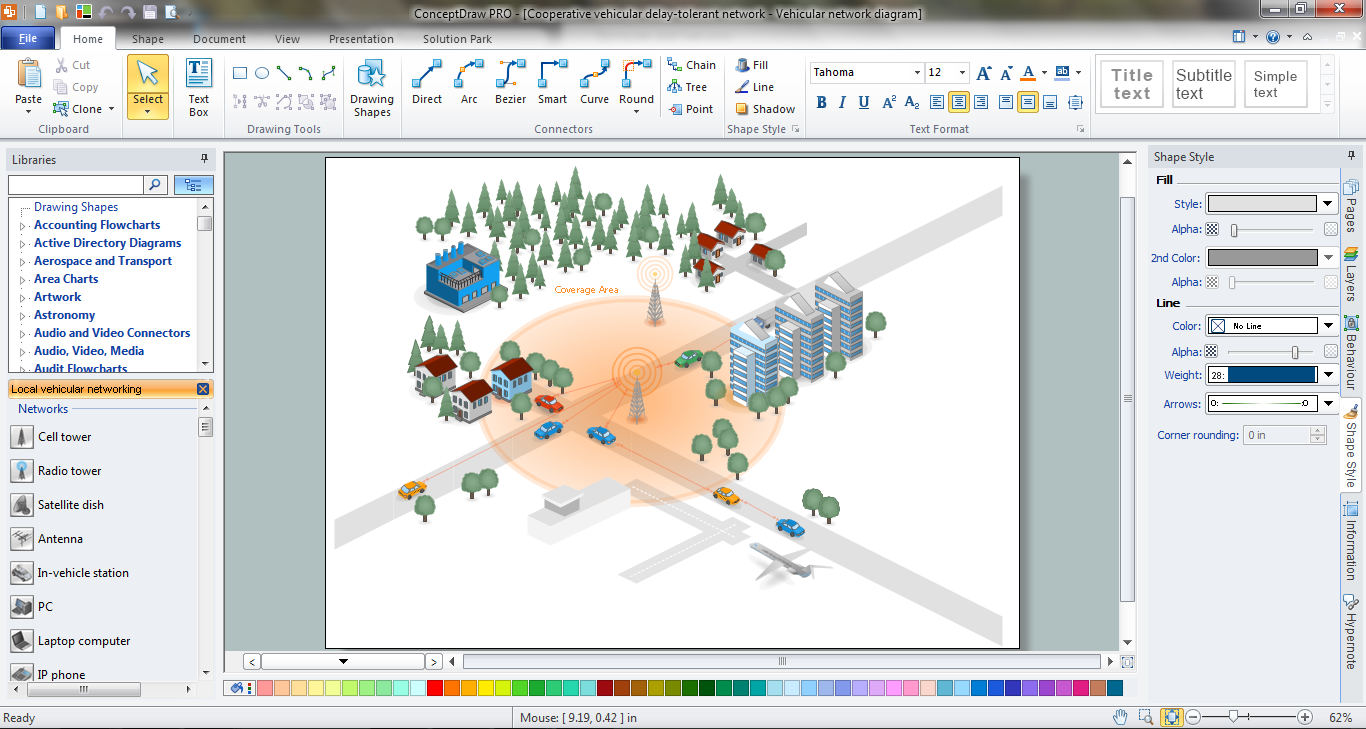
Picture: Network Engineering
Related Solution:
Infographic Design Elements for visually present various geographically distributed information.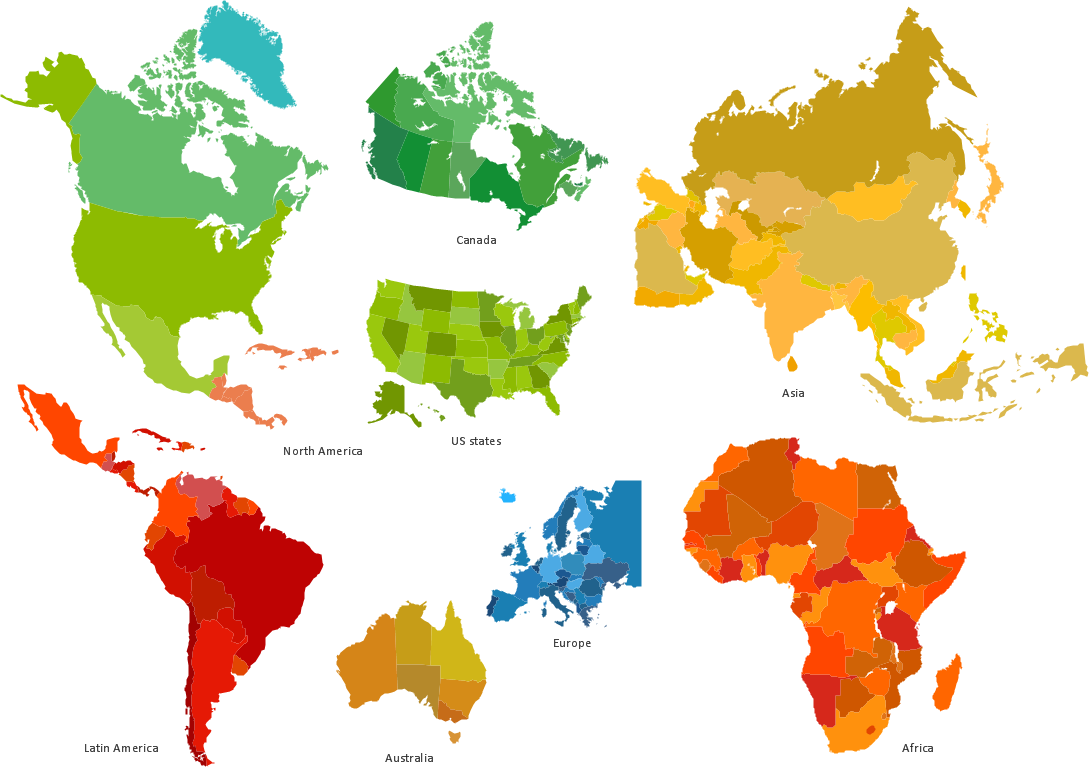
Picture: Spatial infographics Design Elements: Location Map
ConceptDraw DIAGRAM software is the best Mac software for drawing workflow diagrams. Its rich set of samples and templates, and specific features to draw diagrams faster make this software as comfortable as possible for drawing workflow diagrams.
Use the ConceptDraw DIAGRAM professional Mac OS X software for drawing workflow diagram. The Workflow Diagrams solution with its libraries and templates set make the possibility to identify resources that are required for work goal implementation. The process flow diagram identify flow which occurs as network of process dependencies, organizational decisions and interactions between departments. Usually workflow diagrams show business participants actions that carry product or service to the final destination, the consumer.
Picture: Workflow Diagram Software Mac
Related Solution:
This sample was created in ConceptDraw DIAGRAM diagramming and vector drawing software using the Business Process Diagram Solution from the Business Processes area of ConceptDraw Solution Park. The Business Process Solution is based on the standard BPMN 2.0 and includes the set of libraries of ready-to-use objects.
Picture: BPR Diagram. Business Process Reengineering Example
Related Solution:
Why do you need a business process flow diagram? How to use business process diagram software? Explore ✔️ the significance, ✔️ creation process, and ✔️ discover cutting-edge software solutions designed to streamline and optimize your workflows
Picture: Business Process Workflow Diagrams & Software
Related Solution:
Connecting objects manually in ConceptDraw DIAGRAM is a snap:
- points;
- Connecting groups of objects;
- Auto-routing;
- Connectors text;
- Snap to Guides ;
- Quick.
Picture: ConceptDraw Arrows10 Technology
Presentation with Business World style in ConceptDraw DIAGRAM with illustrations and notes from mind map document.
Picture: Business World Presentation
Related Solution:
Create Quality Engineering Diagrams (value stream maps) - for value stream analysis and value stream management, material and information flow mapping, using our quick start templates included with ConceptDraw.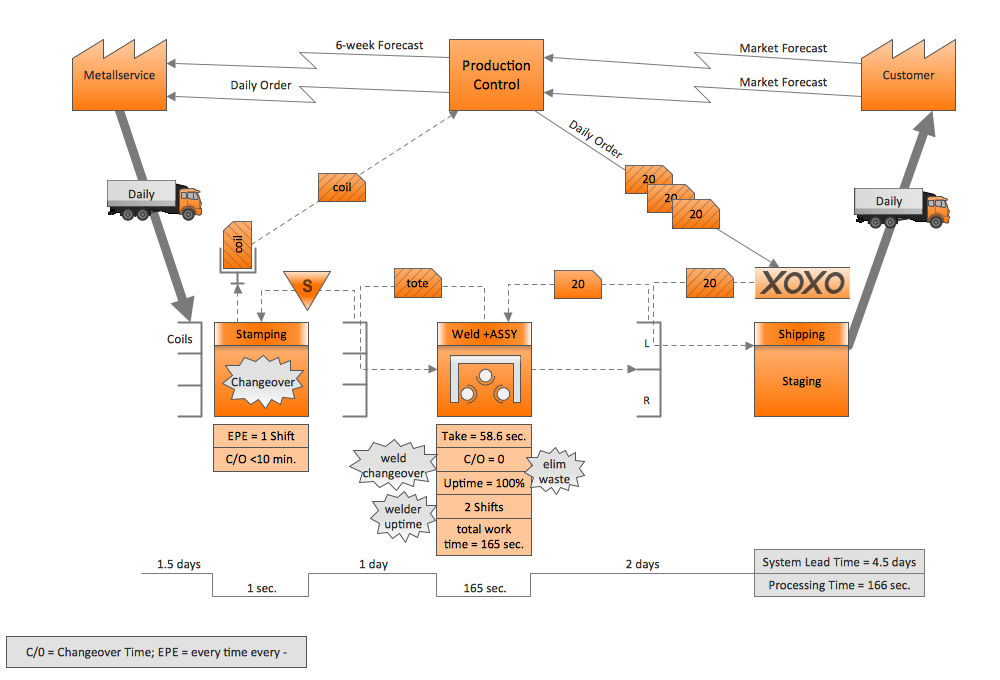
Picture: Quality Engineering Diagrams
Related Solution:
Visio for Mac and Windows - ConceptDraw as an alternative to MS Visio. ConceptDraw DIAGRAM delivers full-functioned alternative to MS Visio. ConceptDraw DIAGRAM supports import of Visio files. ConceptDraw DIAGRAM supports flowcharting, swimlane, orgchart, project chart, mind map, decision tree, cause and effect, charts and graphs, and many other diagram types.
Picture: Is ConceptDraw DIAGRAM an Alternative to Microsoft Visio?
