A Creative Look at Quality Procedures
Get a creative look at a quality procedures with mindmaping software ConceptDraw MINDMAP . Once a quality problem is identified, mind maps can be of great value in depicting and describing a problem in detail, then structure it, and find the right decision. Using quality mind maps is a perfect addition to quality visualization in your company. Mind maps provide descriptive documents for daily work and keep all quality team members clearly informed about key points.
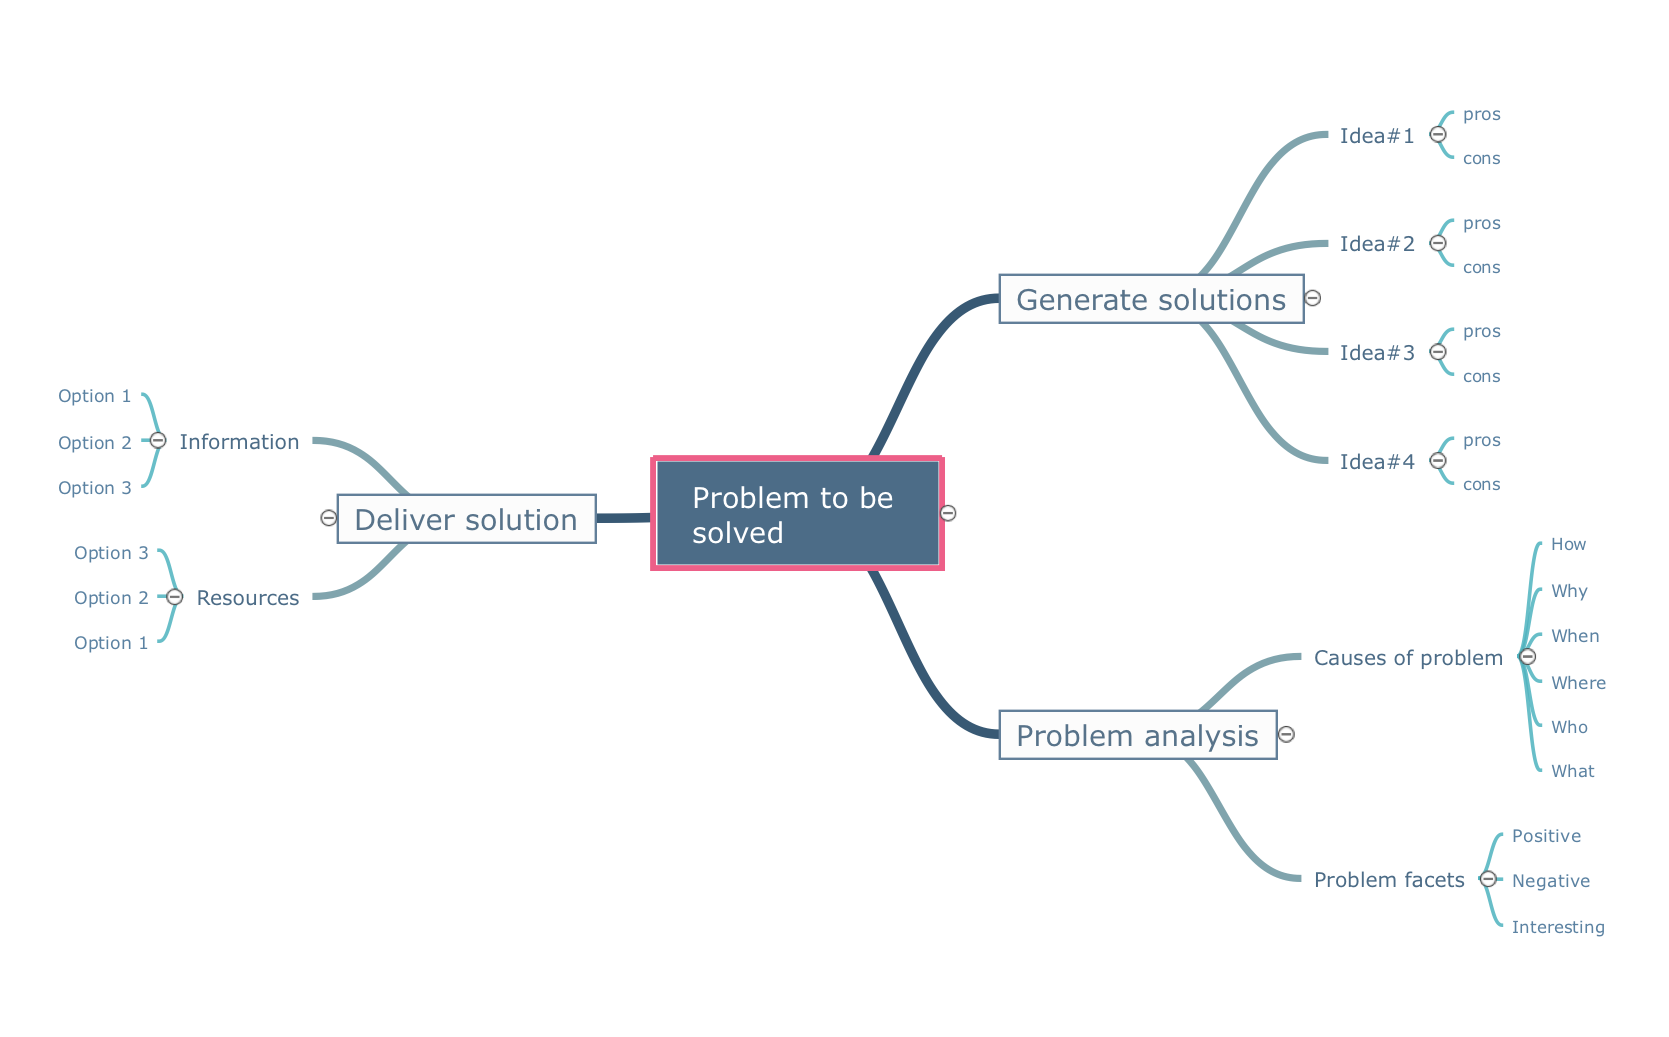
Pic.1 Problem to be solved - Mind map template.
Look at quality procedures creatively using ConceptDraw Quality mindmaps solution.
See also Samples:
SEVEN RELATED HOW TO's:
The ConceptDraw Flowchart component includes a set of samples and templates. This geathered as flowchart maker toolbox which focused on drawing flowcharts of any industry standards.
Picture: Flowchart Components
Related Solution:
A Flow Map is a type of thinking maps, which help organize and understand information easily. Use ConceptDraw DIAGRAM software to ✔️ create a Flow Map of any degree of complexity in a few minutes, ✔️ display the interrelated information, ✔️ structure information sequentially or chronologically, ✔️ represent manufacturing or engineering processes
Picture: Flow Map: A Step-by-Step Guide
Related Solution:
The Cause and Effect diagram introduced by Kaoru Ishikawa in 1968 is a method for analyzing process dispersion. It can help you to dive into a problem and find an effective solution, identify and represent the possible causes for an effect, analyze the complex business problems and successfully solve them.
You can design your Cause and Effect diagram on a paper, but more effective way is to use specific software - ConceptDraw DIAGRAM is a powerful Cause and Effect Diagram Software. It helps you create Cause and Effect diagram known also as Fishbone diagram or Ishikawa diagram from templates and examples.
Picture: Cause and Effect Diagram Software
Related Solution:
ConceptDraw DIAGRAM diagramming and vector drawing software extended with Seven Basic Tools of Quality solution from the Quality area of ConceptDraw Solution Park provides effective tools for quality control and helps design any types of quality-related diagrams.
Picture: Seven Basic Tools of Quality — Quality Control
Related Solution:
A competent delegation of responsibilities between workers guarantees business success in most cases. At first sight, it might seem that workflow diagram symbols are quite similar to a regular flowchart. But workflow diagram is a more accurate way to present working processes.
Workflow diagrams are helpful for a working process analyzation, to depict a pathway of process issues, personalize responsibilities and identify resources that will help to optimize a workflow. Generally, Workflow diagram deploys flowchart symbols for displaying work process steps and relationships. But, often it require some additions and improvements to become more professional and illustrative. The Workflow solution for ConceptDraw DIAGRAM provides the user with a big library of symbols that are designed especially for workflow diagrams.
Picture: Workflow Diagram Symbols
Related Solution:
ConceptDraw MINDMAP with Quality mindmaps solution as a demonstration of the creative approach to quality management in daily work of quality management team.
Picture: Quality Management Teams
Related Solution:
The 7 Management and Planning Tools solution implements well-known methodologies for problem analysis and solving. Different products from the ConceptDraw Office suite can be used as a complete solution for any of the methodologies in this solution. ConceptDraw Office provides visual communication during every stage of work.
Picture: 7 Management & Planning Tools
Related Solution:
ConceptDraw
MINDMAP 16