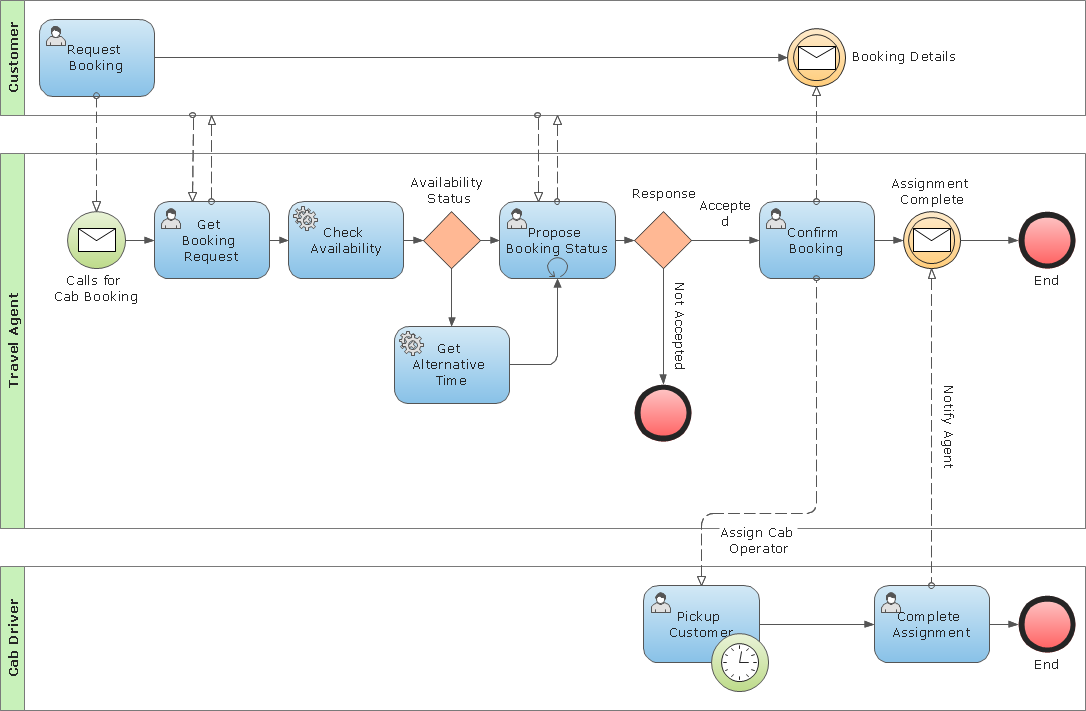
A public (B2B) process represents the interactions between a private business process and another process or participant. Only those activities that communicate outside the private business process are included in the public process. All other “internal” activities of the private business process are not shown. Thus, the public process shows to the outside world the sequence of messages that are required to interact with that business process. Public processes can be modeled separately or within a collaboration to show the flow of messages between the public process activities and other participants.
TEN RELATED HOW TO's:
Value Stream Mapping for the lean office is a tool that uses a flow diagram to document in great detail every step of a manufacturing process.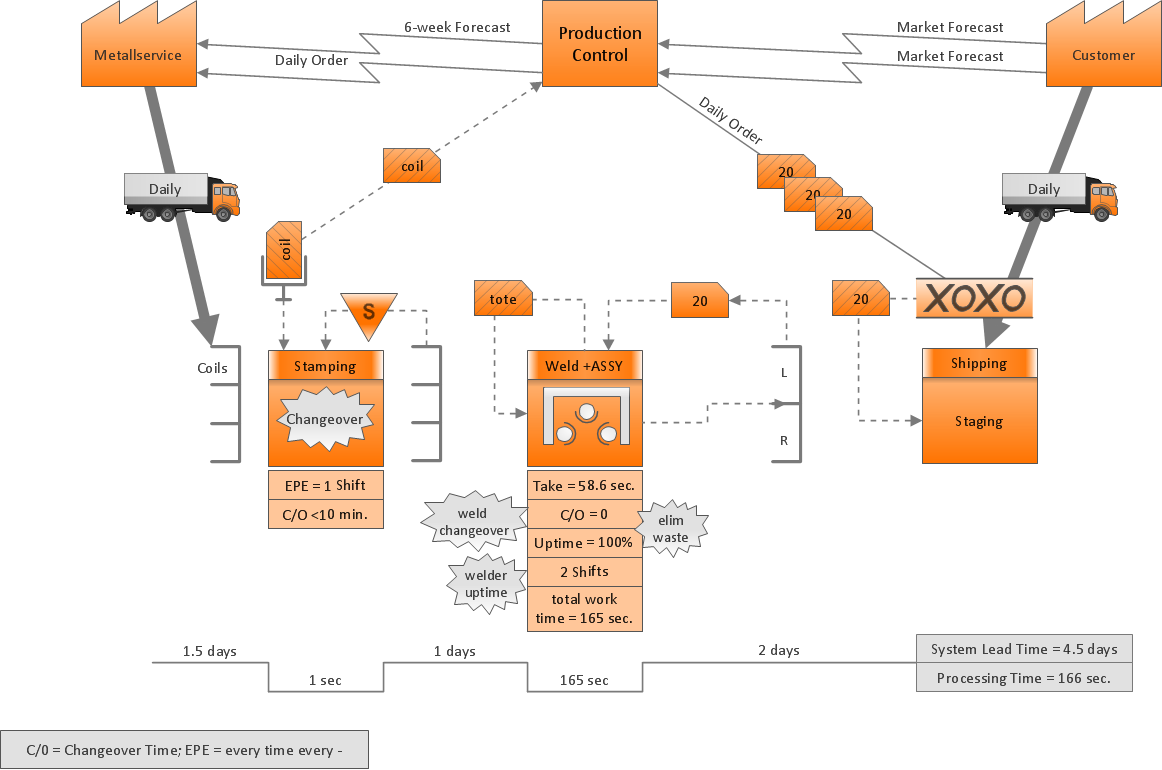
Picture: Value Stream Mapping for the Lean Office
Related Solution:
Use ConceptDraw DIAGRAM with Accounting Flowcharts solution to document and communicate visually how accounting processes work, and how each operation is done.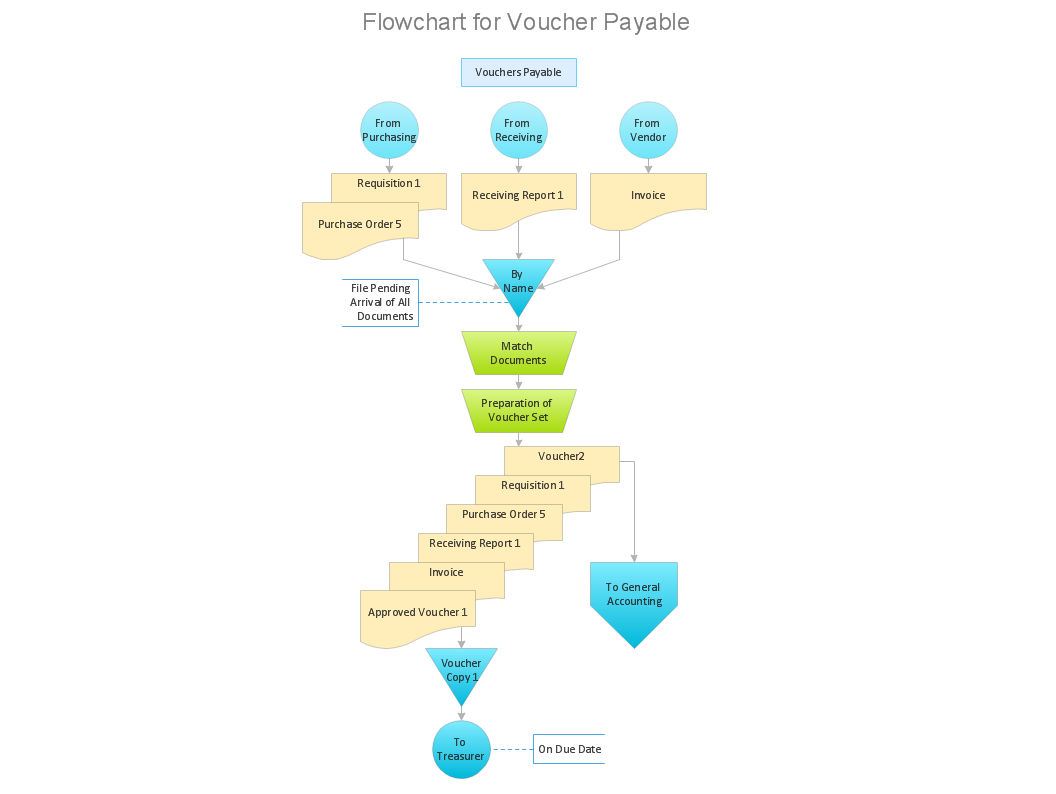
Picture: Accounting Flowchart: Purchasing, Receiving, Payable and Payment
Related Solution:
The Organizational Chart is a diagram that shows the structure of the organization and the relationships of its parts. There are many ways to present the Organizational Chart. One of them is the Horizontal Organizational Chart: the parts of the diagram are arranged from left to right, or from right to left.
This sample was created in ConceptDraw DIAGRAM diagramming and vector drawing software using the Organizational Charts Solution from the Management area of ConceptDraw Solution Park.
Picture: Horizontal Orgchart
Related Solution:
On this diagram are used the flowchart symbols that represents the processes and documents.
Picture:
Credit Card Order Process Flowchart.
Flowchart Examples
Related Solution:
Explore practical flowchart examples including business process diagrams, workflow charts, swimlane flowcharts, and IT troubleshooting flows. Review common patterns and start from ready templates.
Picture: Flowchart Examples
Related Solution:
Analysis is very important part for every business, as it helps to understand the weakness and to see the opportunities, and SWOT is one of the most effective tools. To illustrate the multifunctionality of this tool, let’s imagine a SWOT sample in area of computers networking, which can be carried out to realize the pros and cons of some equipment, for example. Even a network topology or a administer can be a subject for this analysis.
This SWOT analysis matrix illustrate the sample of using this useful technique for comprehension of Strengths and Weaknesses, and for determining the Opportunities open to business and the Threats it encounters. Used in a business scope, it will help to create a perspective niche in the market for particular business. The ConceptDraw SWOT and TOWS Analysis solution gives a lot of templates of both SWOT and TOWS matrices that allow managers and marketers create custom diagrams to perform SWOT or TOWS analysis in context of a particular business.
Picture: SWOT Sample in Computers
The Total Quality Management Diagram solution helps you and your organization visualize business and industrial processes. Create Total Quality Management diagrams for business process with ConceptDraw software.
Picture: TQM Diagram Example
Related Solution:
Total Quality Management (TQM) system is the management method where the confidence in quality of all organization processes is placed foremost. The given method is widely used in production, in educational system, in government organizations and so on.
Picture: Total Quality Management with ConceptDraw
Set of vector cliparts, samples, templates and libraries helps you to create all sorts of new imagesthe for Money Illustrations.
Various styles of money design elements (currency symbols, clipart, money symbols) can be found in ConceptDraw DIAGRAM Business and Finance Solution.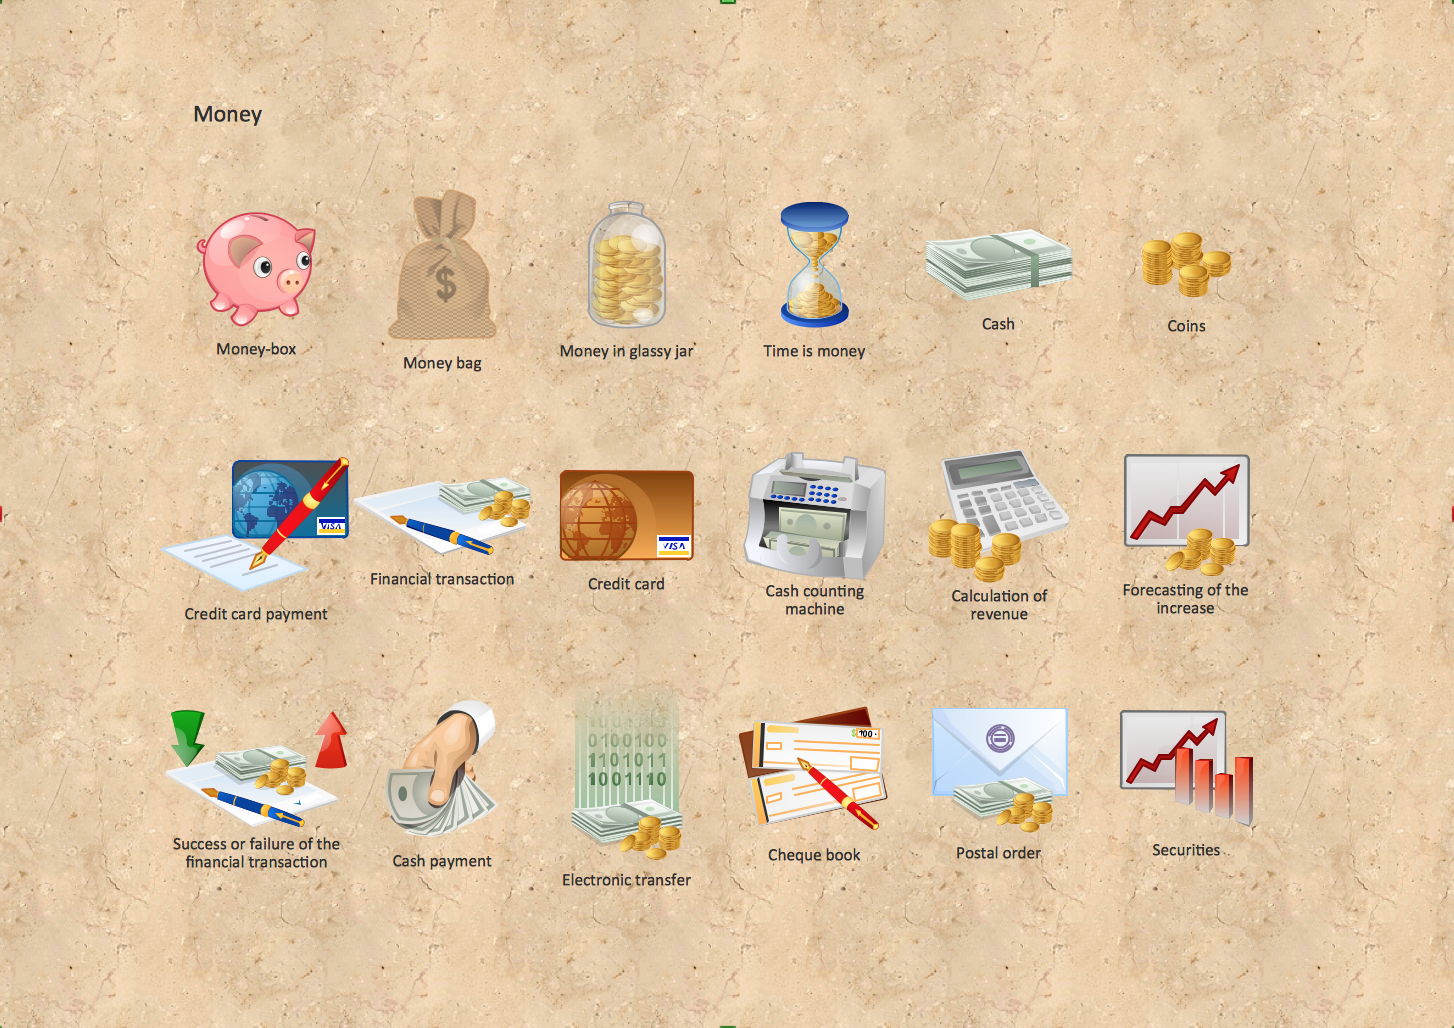
Picture: Money - Design Elements
Related Solution:
Use the set of special professionally developed swim lane flowchart symbols - single, multiple, vertical and horizontal lanes from the Swimlanes and Swimlanes BPMN 1.2 libraries from the Business Process Diagram solution, the Swim Lanes library from the Business Process Mapping solution as the perfect basis for your Swim Lane Flowcharts of processes, algorithms and procedures.
Picture: Swim Lane Flowchart Symbols
Related Solution: