
Example 2. Software Diagram Template
This software diagram template was also created in ConceptDraw DIAGRAM using the predesigned objects from the libraries of Software Development area. An experienced user spent 10 minutes creating this template for you.
Use templates from the solutions of Software Development area for ConceptDraw DIAGRAM to create your own professional looking Software Diagrams in minutes.
The Software Diagrams designed with ConceptDraw DIAGRAM are vector graphic documents and are available for reviewing, modifying, converting to a variety of formats (image, HTML, PDF file, MS PowerPoint Presentation, Adobe Flash or MS Visio), printing and send via e-mail in one moment.
See also samples:
TEN RELATED HOW TO's:
The Value Stream Map is one of the key tools of lean practitioners. It helps aptly describe the manufacturing processes both complex and simple. It supports process improvement, allows identifying waste, and reducing process cycle times. Use ConceptDraw DIAGRAM extended with Value Stream Mapping solution to document processes starting with a professionally designed Value Stream Mapping template.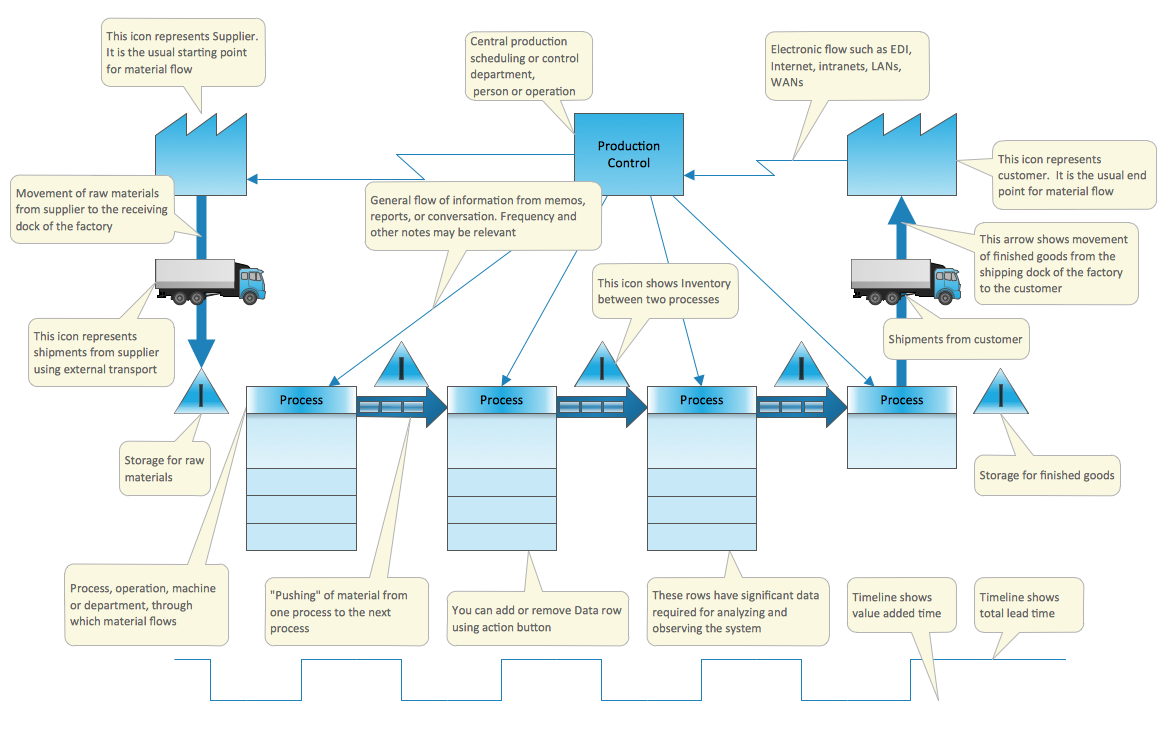
Picture: Value Stream Mapping Template
Related Solution:
Have you ever created the fire plans on the base of Fire Evacuation Plan Template? It's incredibly convenient and time-saving way. Let's try to make sure this with Fire and Emergency Plans solution for ConceptDraw DIAGRAM software.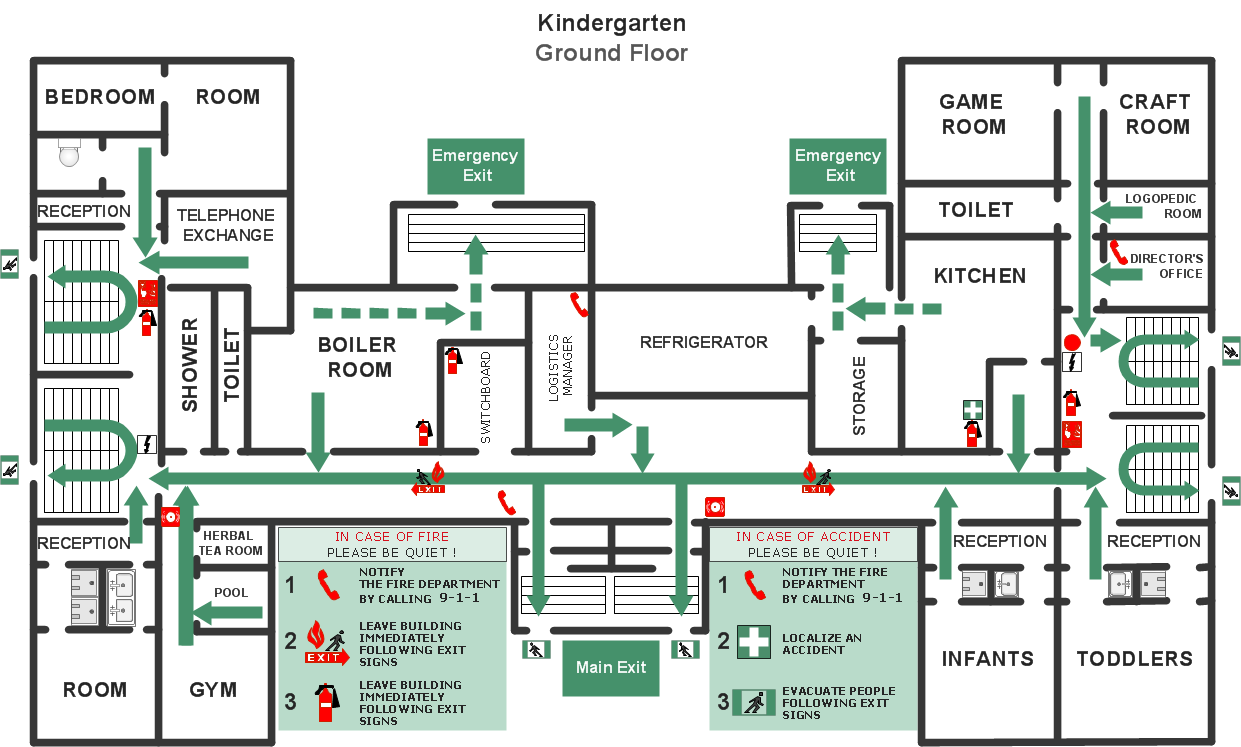
Picture: Fire Evacuation Plan Template
Related Solution:
The vector stencils library IDEF0 Diagram from the solution IDEF0 Diagrams contains specific IDEF0 diagram symbols such as arrow symbols and entity symbols for ConceptDraw DIAGRAM software.
Picture: IDEF0 Diagram
Related Solution:
The intuitive interface of ConceptDraw MINDMAP and the Functional Tools overview below will guide you in creating and demonstrating powerful mind map presentations using template.
An advanced tool allows you effectively generate, change, and update your presentation.
Picture: Create a Presentation Using a Design Template
Related Solution:
Swim lanes are visual elements used in Business Process Maps, Process Flow Diagrams and Flowcharts.
ConceptDraw DIAGRAM diagramming and vector drawing software extended with Business Process Mapping Solution from the Business Processes Area of ConceptDraw Solution Park is ideal for drawing Business Process Maps and Swim Lanes Flowcharts.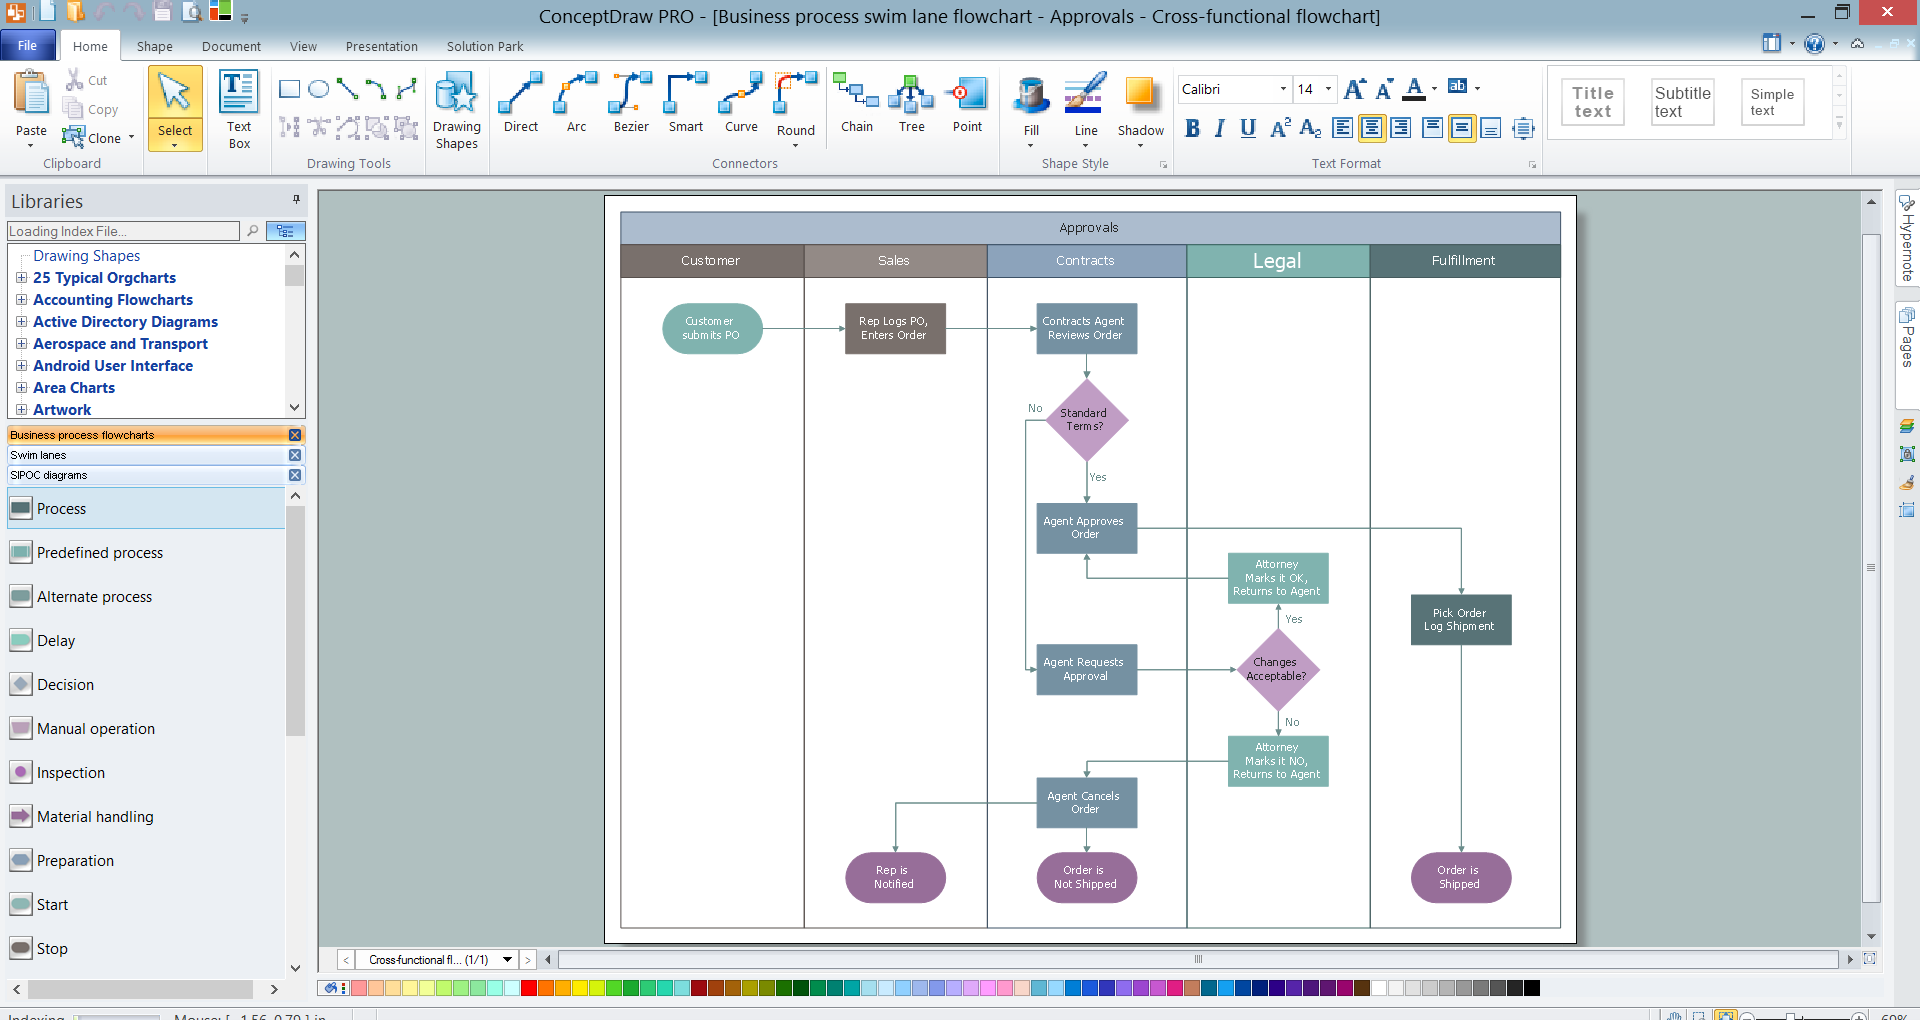
Picture: Swim Lanes
Related Solution:
Creating of computer network diagrams is a complex process which requires a lot of time and efforts. ConceptDraw DIAGRAM diagramming and vector drawing software was extended with Computer Network Diagrams Solution from the Computer and Networks Area to make your design process easier. One of the most helpful tools of this solution is Network Diagram Template.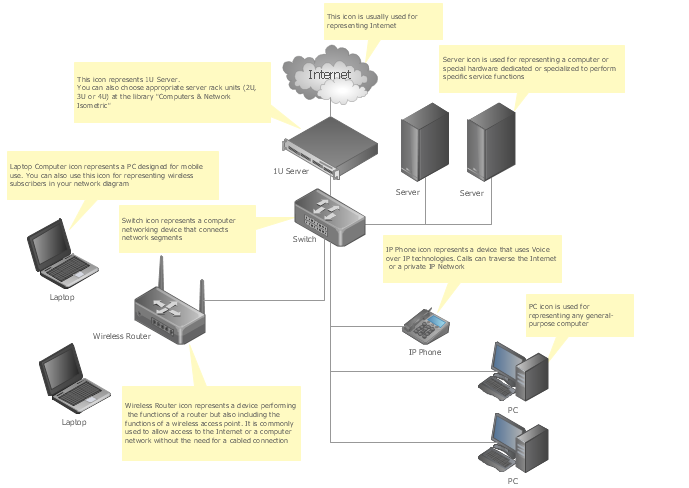
Picture: Network Diagram Template
Related Solution:
The Organizational Chart is a diagram that shows the structure of the organization and the relationships of its parts. There are many ways to present the Organizational Chart. One of them is the Horizontal Organizational Chart: the parts of the diagram are arranged from left to right, or from right to left.
This sample was created in ConceptDraw DIAGRAM diagramming and vector drawing software using the Organizational Charts Solution from the Management area of ConceptDraw Solution Park.
Picture: Horizontal Orgchart
Related Solution:
The ConceptDraw vector stencils library Cisco IBM contains equipment symbols for drawing the computer network diagrams.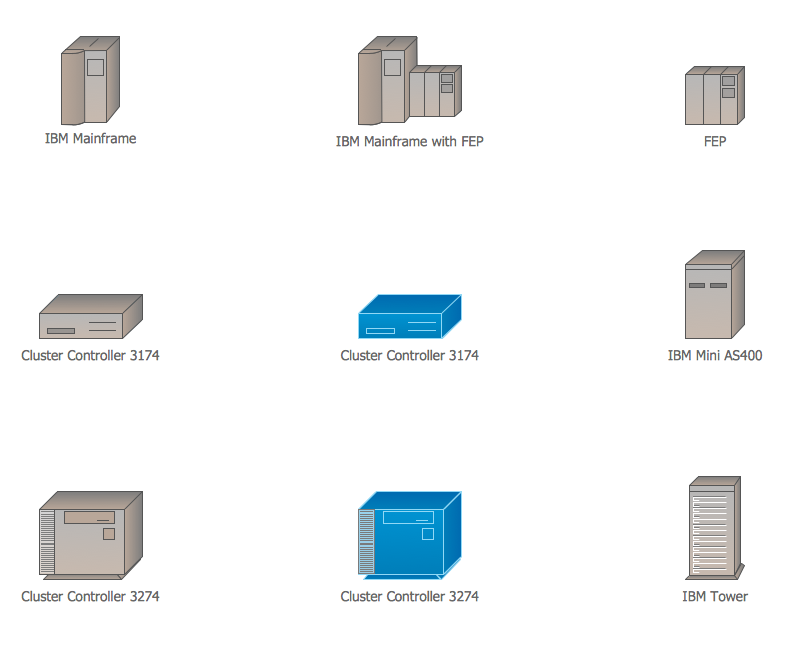
Picture: Cisco IBM. Cisco icons, shapes, stencils and symbols
Related Solution:
This sample shows the UML Class Diagram that was created in ConceptDraw DIAGRAM on the Mac and then was opened for editing in MS Visio.
Using the 13 libraries of the Rapid UML Solution for ConceptDraw DIAGRAM you can create your own visual vector UML diagrams quick and easy.
Picture: UML Diagram Visio
Related Solution:
Designing a Data Flow Diagram is incredibly simple in the ConceptDraw DIAGRAM. You can start with a blank sheet or choose one of the offered DFD templates included in the Data Flow Diagrams solution. Once started with a predesigned Data Flow Chart template, use also the ready-made vector objects from the Data Flow Diagrams solution libraries.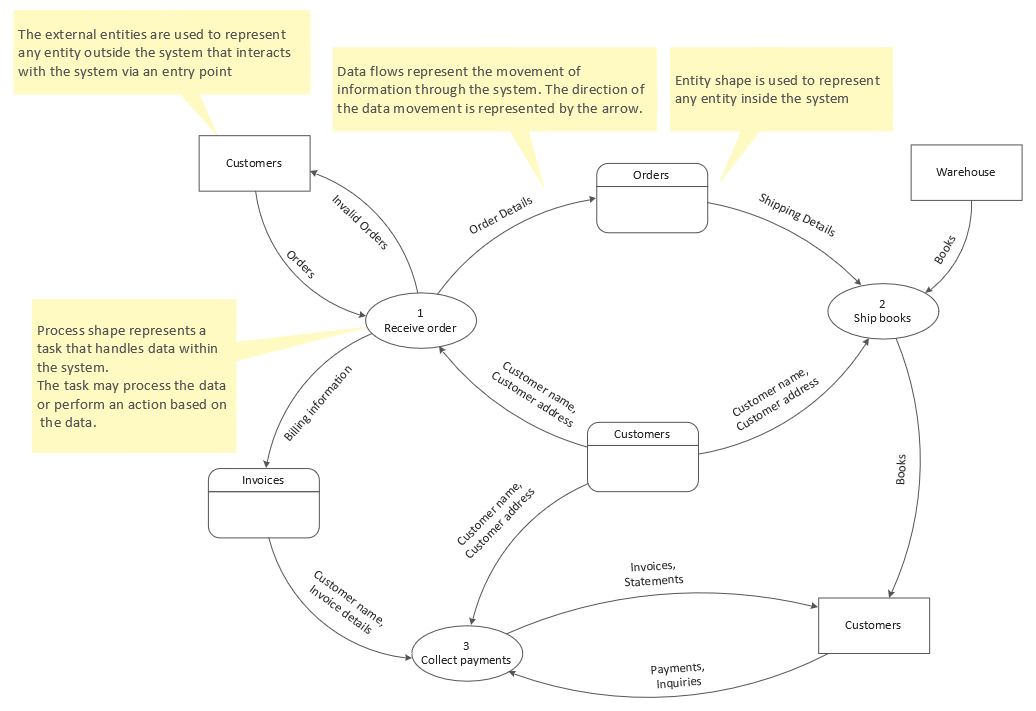
Picture: Data Flow Chart Template
Related Solution:

 Template")


