Chart Maker for Presentations
ConceptDraw DIAGRAM is a powerful diagramming and vector drawing software for quick, easy and effective creating the professional looking charts and graphs for presentations.
ConceptDraw DIAGRAM provides the Bar Graphs Solution from the Graphs and Charts Area of ConceptDraw Solution Park that allows you design bar and column charts.
Pic. 1. Chart Maker Solution
Bar Graphs Solution contains the library with ready-to-use vector stencils that allow you create: Vertical Bar Chart, Horizontal Bar Chart, Double Bar Chart, 3D Bar Chart and Cylindrical Bar Chart.
Bar Graphs Solution provides also the professional looking predesigned templates and samples for creating the charts and graphs in a few moment.
Pic. 2. Bar Graphs library
The charts and graphs designed with ConceptDraw DIAGRAM are vector graphic documents. They can be reviewed, modified, converted to a variety of formats (image, HTML, PDF file, MS PowerPoint Presentation, Adobe Flash or MS Visio) and easy used in different professional presentations.

Pic. 3. Chart Template
This template was created in ConceptDraw DIAGRAM using the Bar Graphs Solution and shows the Column Chart.
Pic. 4. Chart Software
More Examples:
NINE RELATED HOW TO's:
The vector stencils library Aircraft contains clipart of aerospace objects, transportation vehicles, office buildings, and ancillary facilities for ConceptDraw DIAGRAM diagramming and vector drawing software.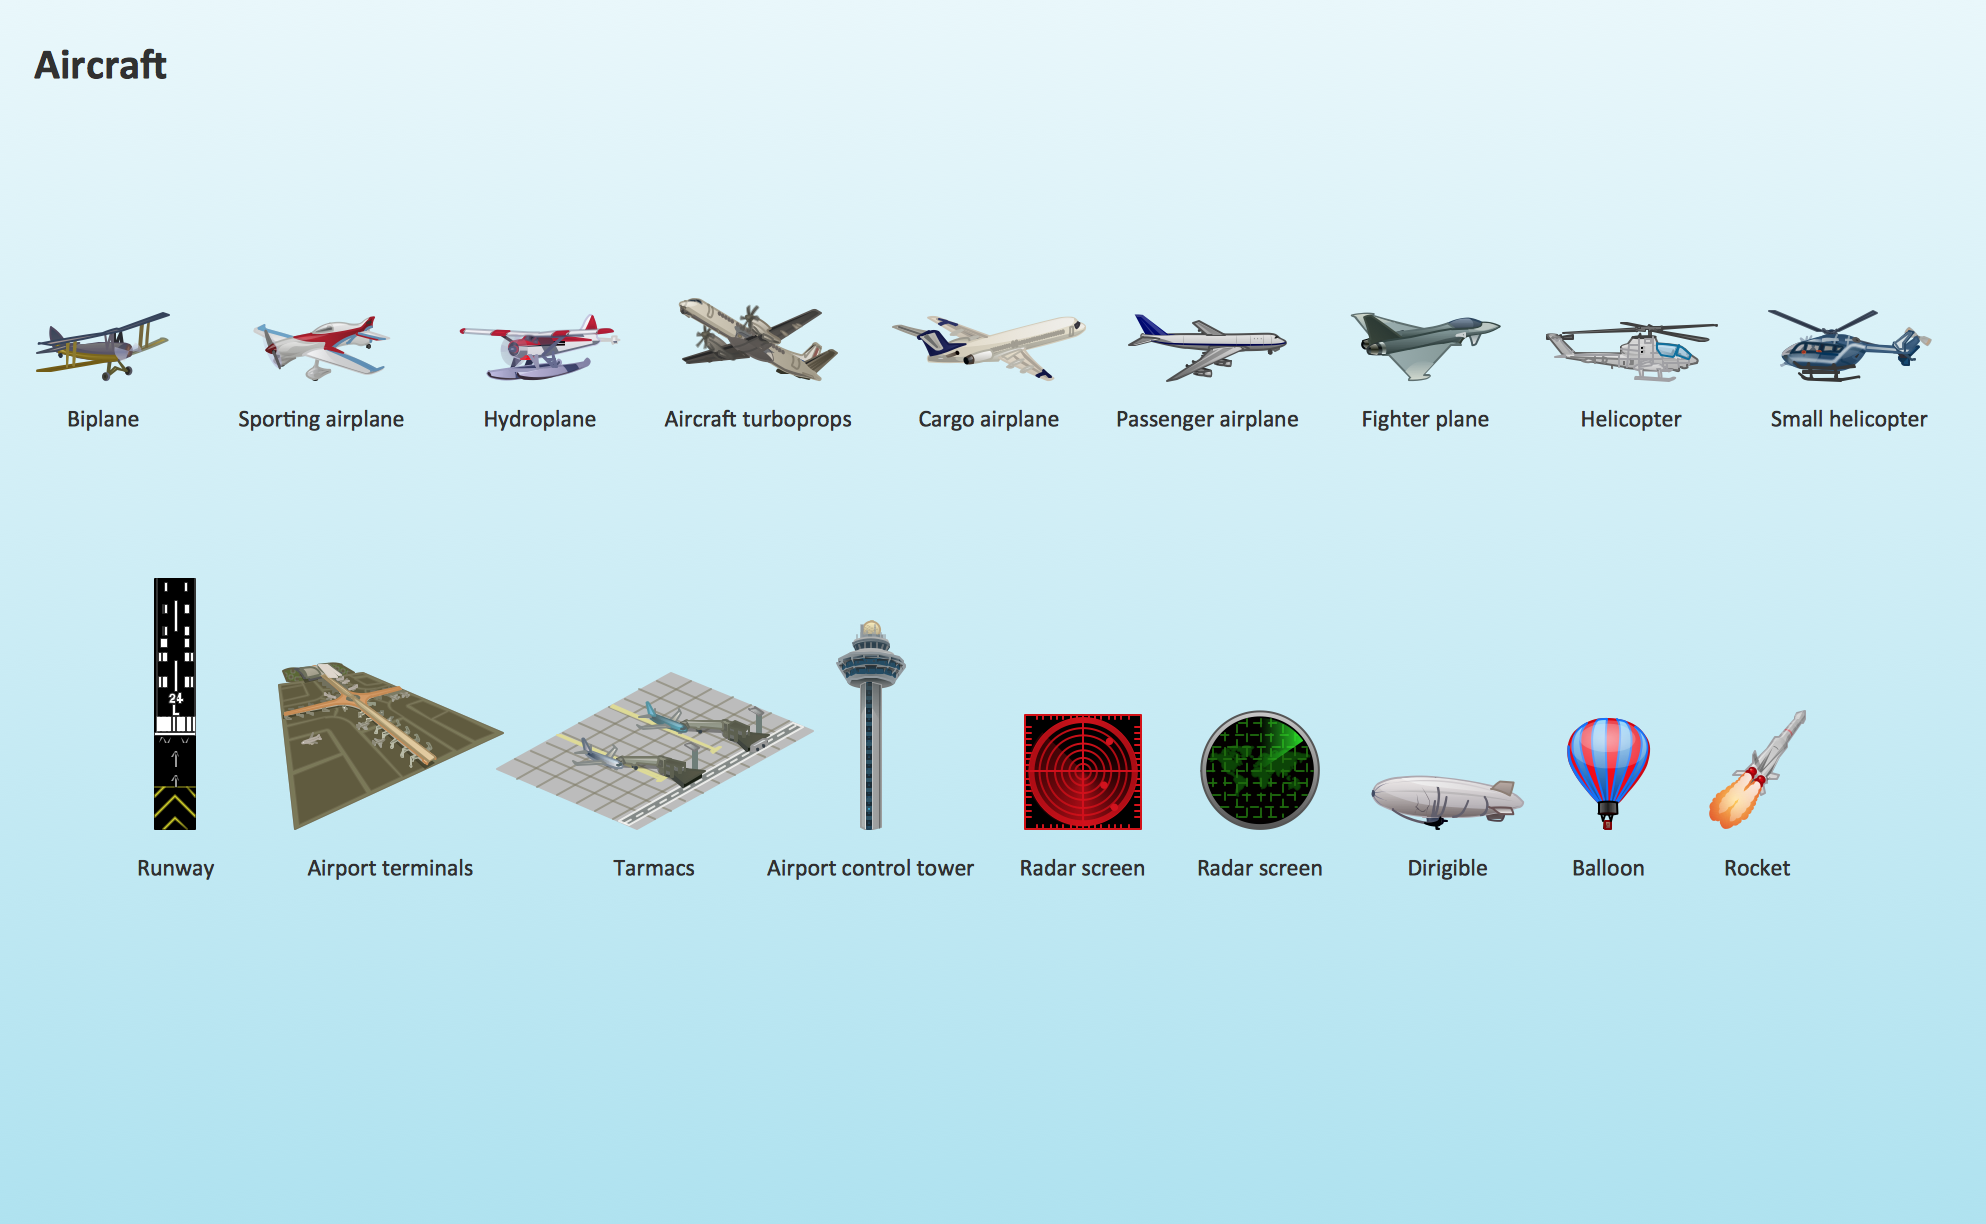
Picture: Aircraft - Design Elements
Related Solution:
ConceptDraw DIAGRAM diagramming and vector drawing software extended with tools of Flowcharts Solution from the Diagrams Area of ConceptDraw Solution Park ideally suits for fast and easy Online Flow Chart designing. We propose to verify this right now.
Picture: Online Flow Chart
Related Solution:
When we think about programming, we usually imagine sleepless nights spent on writing kilobytes of code. However, from another point of view, Software development with ConceptDraw DIAGRAM makes a programmer's life endlessly easier. This tool is unique to fulfill all your needs in short period of time.
Over the recent years object-oriented methodology has become more and more widespread. Thanks to this methodology developers manage to deal with growing complexity of applications. More and more programs are written in such programming languages as C++, Java, Visual Basic and Object Pascal. However, the complexity of the designed systems imposes extended requirements as to design of graphic documentation. ConceptDraw possesses powerful tools for designing of technical documentation for object-oriented projects. The libraries included in the package allow to easily draw class hierarchies, object hierarchies and diagrams of data flows with the use of the most popular notations, including UML and Booch notations. And the library for projecting COM-interfaces will spare developers of ActiveX-servers a headache.
Picture: Software development with ConceptDraw DIAGRAM
What is the accounting cycle? The accounting cycle is a sequence of steps that occur in the accounting period and include the processes of identifying, collecting, analyzing documents, recording transactions, classifying, summarizing, and reporting financial information of an organization.
Picture: What is the Accounting Cycle?
Related Solution:
To make a histogram, you need to divide the range of values into a series of intervals and then to count how many of the values fall into each of the intervals.
Picture: Histogram
Related Solution:
Use ConceptDraw DIAGRAM business diagramming and business graphics software for general diagramming purposes, it inludes tousands colored professional flowchart symbols, examples and samples which saves time when you prepare documents, professional presentations or make an explanation of process flow diagram.
Picture: Flow Chart Design — How to Design a Good Flowchart
Related Solution:
Public catering business will always be in demand.To attract a lot of clients, it’s important to have a detailed banquet hall plan, a diverse menu and reasonable prices. If you want to create a good plan, you can use drawing software.
When planning and considering the layout of a banquet hall, one must take into consideration, that it is very significant to make it stylish with correctly selected appointment and celebratory belongings. Tables and seating must be handily arranged. The furniture arrangement can changes depending on client requirements, kind of banquet and amount of guests. ConceptDraw Cafe and Restaurant Plans solution supplies a dozens of predesigned vector graphic objects of banquet furniture and accessories. Thus you can design the Banquet Hall layout for the celebrations in any style and any number of guests.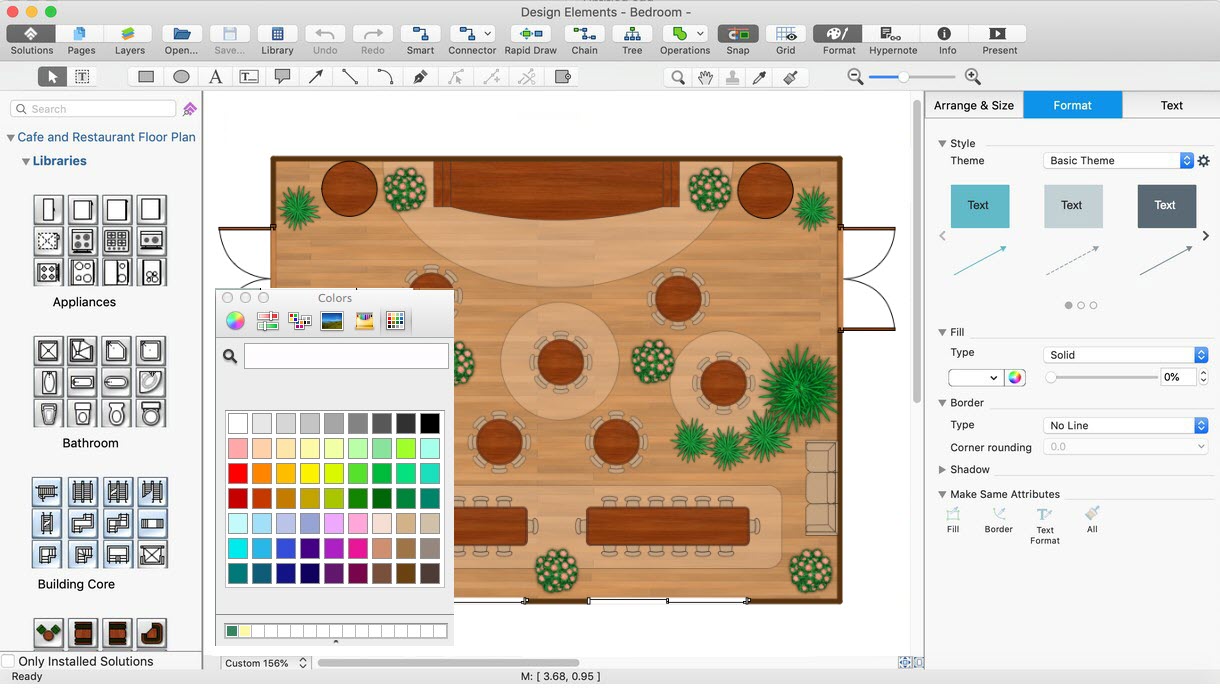
Picture: Banquet Hall Plan Software
Related Solution:
Relative value is a value measured in the terms of liquidity, risks, return of one investment or financial instrument relative to another.
Relative values are widely used in:business, economics, investment, management, marketing, statistics, etc.
ConceptDraw DIAGRAM software is the best for drawing professional looking Relative Value Charts. ConceptDraw DIAGRAM provides Divided Bar Diagrams solution from the Graphs and Charts Area of ConceptDraw Solution Park.
Picture: Relative Value Chart Software
Related Solution:
It is so simple making the drawing process easier and faster. you just need to choose the right drawing software.
ConceptDraw Arrows10 Technology - This is so easy and fast to draw any type of diagram with any degree of complexity.
Picture: Simple & Fast Diagram Software
Related Solutions:


