How To Create Floor Plans
If you ever need to draw the floor plans such as architectural house, pole building one or storage building, commercial building or residential building one, you can always rely upon the unique software ConceptDraw DIAGRAM which is the one providing over 10000 stencils in numerous libraries as well as lots of templates and examples for making very professional plans as if you were designer or engineer even if you have no experience in making any of these floor plans. Using all of our symbols and pre-designed elements means having everything you need for your interior plans look perfect.
Floor Plan software
You do not need to be an artist to create great-looking house building plans. ConceptDraw has many examples and templates for drawing floor plans, house floor plans, office layout plans, electrical layout plans.
You can create quick custom great-looking designs of
- house floor plan
- office floor plan
- salon floor plan
with our Floor Plan software.
You will find more than 10000 stencils for all building plans layouts so you can draw
- architectural house plans
- pole building plans
- storage building plans
- commercial building plans
- residential building plans
and more.
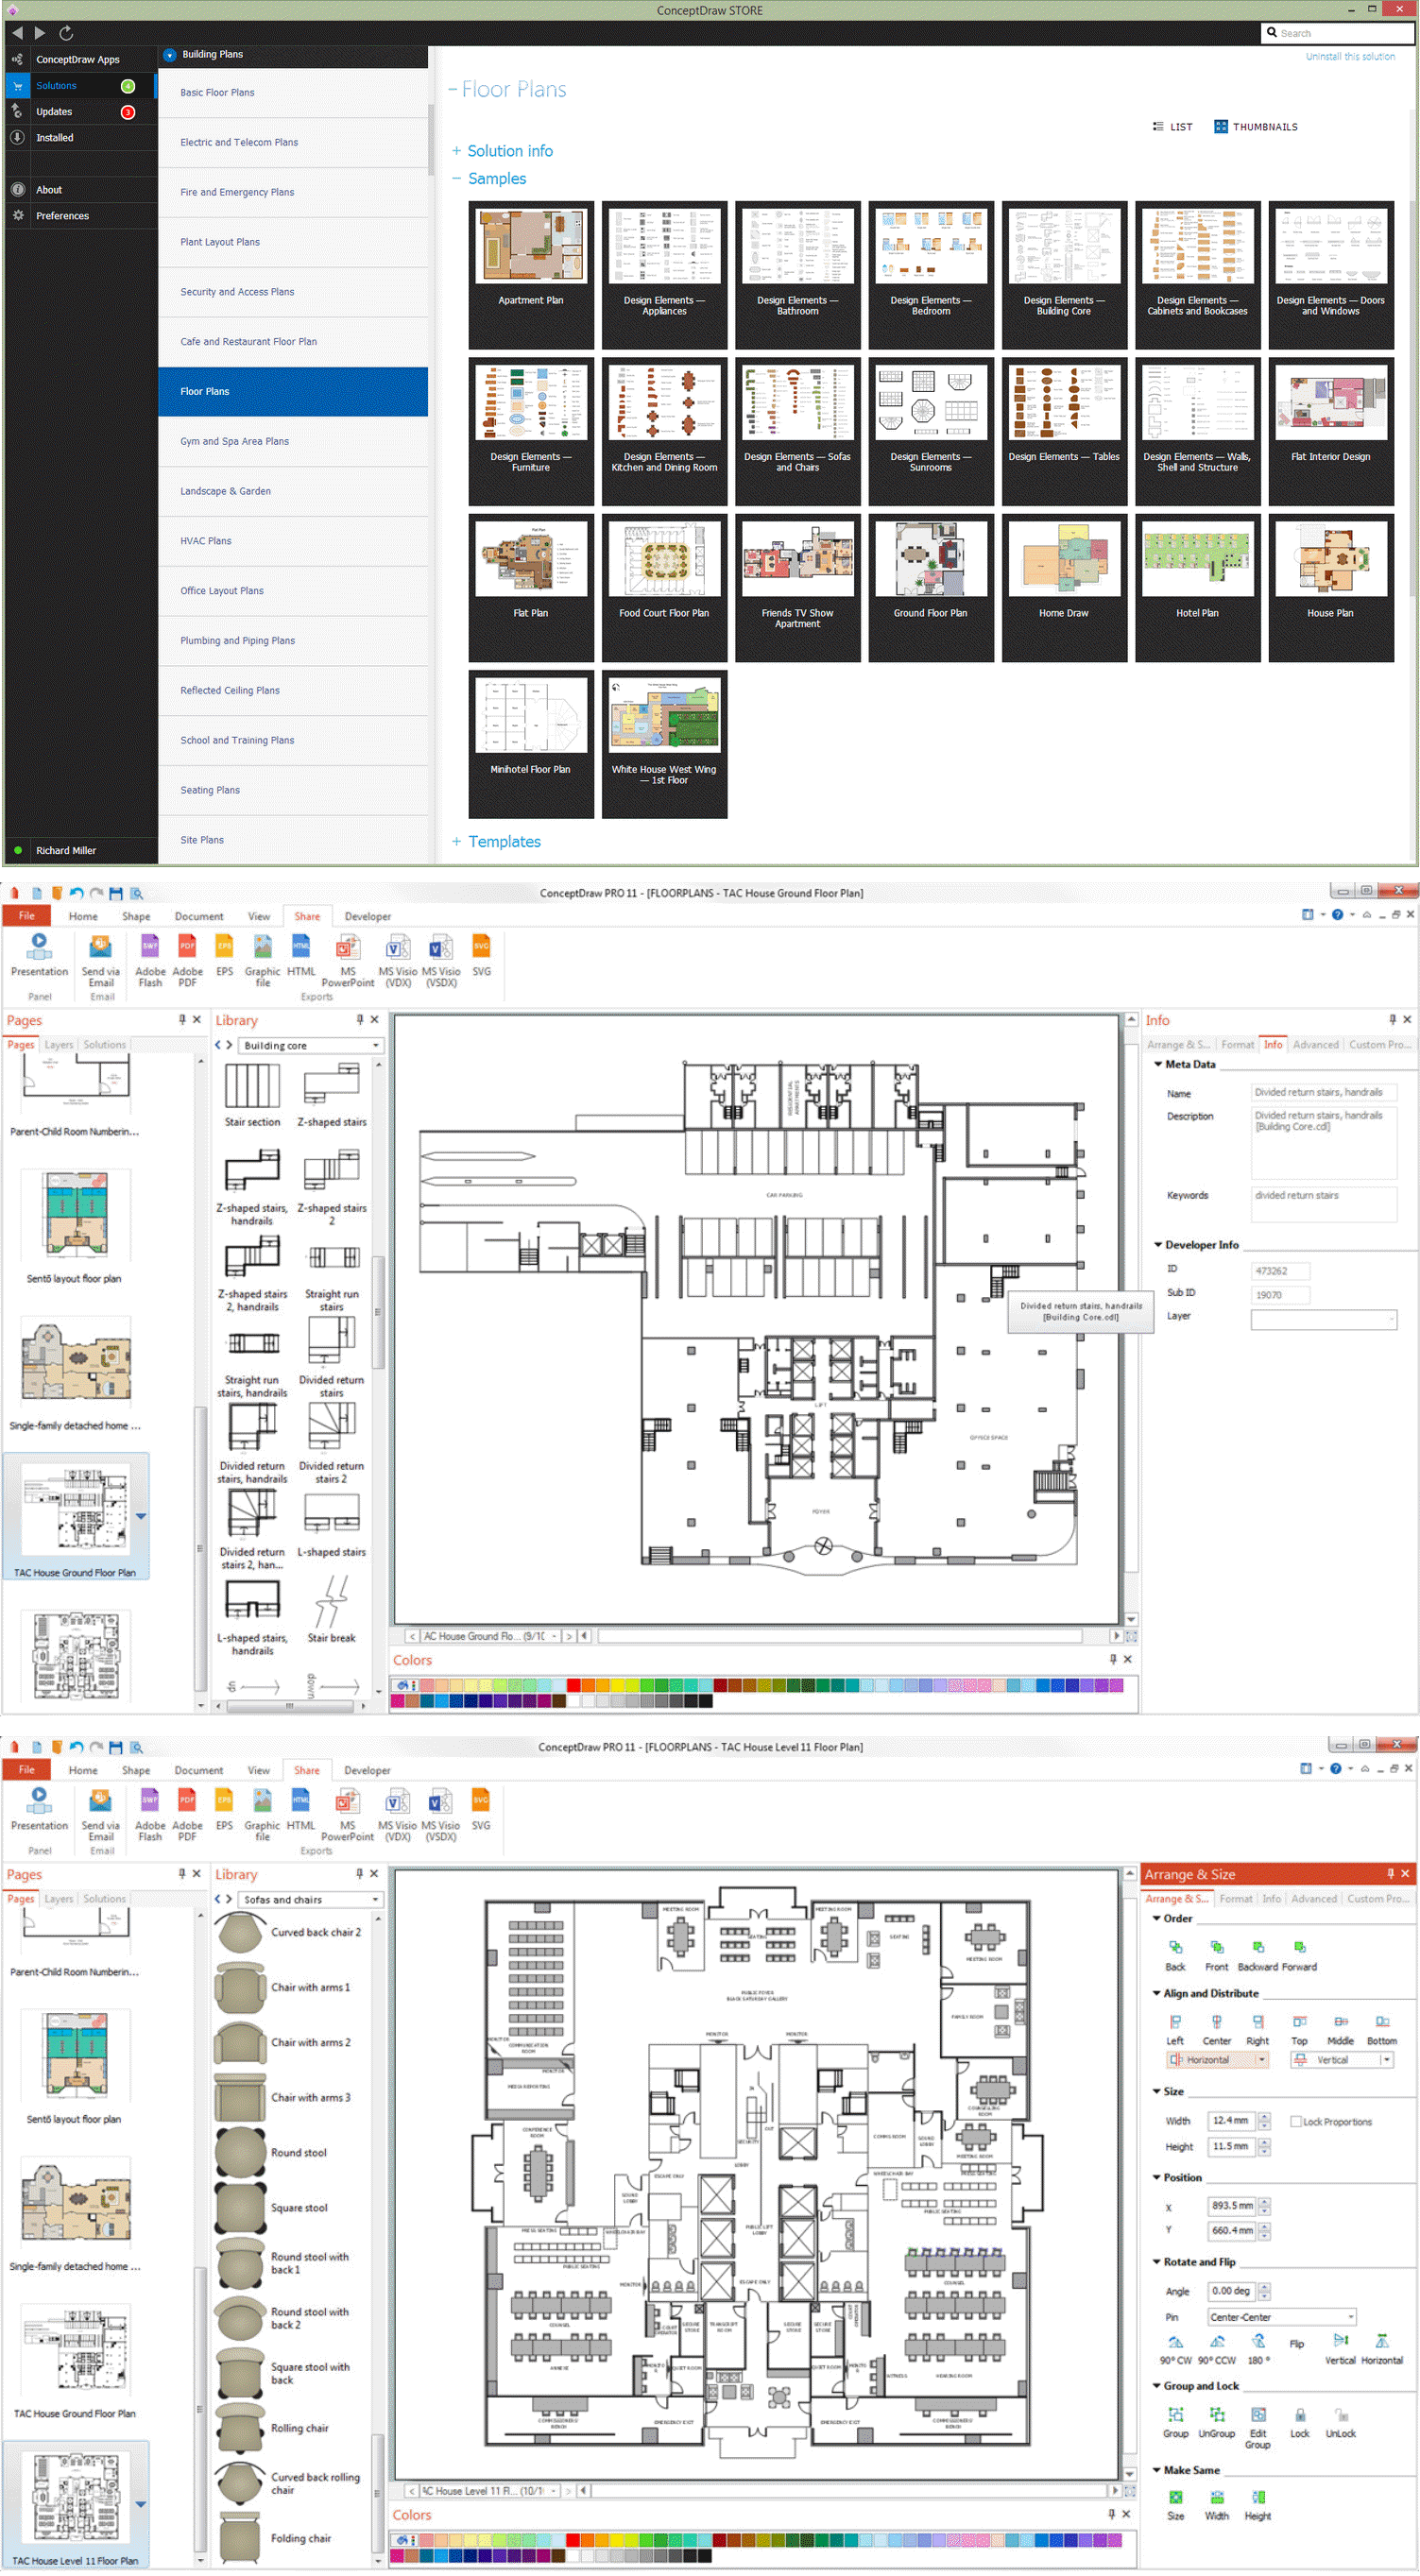
Pic 1. Floor Plans Software
This sample is created using ConceptDraw DIAGRAM diagramming and vector drawing software enhanced with Floor Plans solution from ConceptDraw Solution Park.
Use the Building Plans Solution to develop the floor plans, and blueprints for facilities management, move management, office supply inventories, assets inventories, office space planning.
TEN RELATED HOW TO's:
Collaborating with co-workers is very important, not only in order to get things done effectively, but also to keep in touch with the outside world. Great way for business collaboration is Skype.
Picture: Online Collaboration via Skype
Related Solution:
Using ConceptDraw quality mind maps is a perfect addition to quality visualization in your company.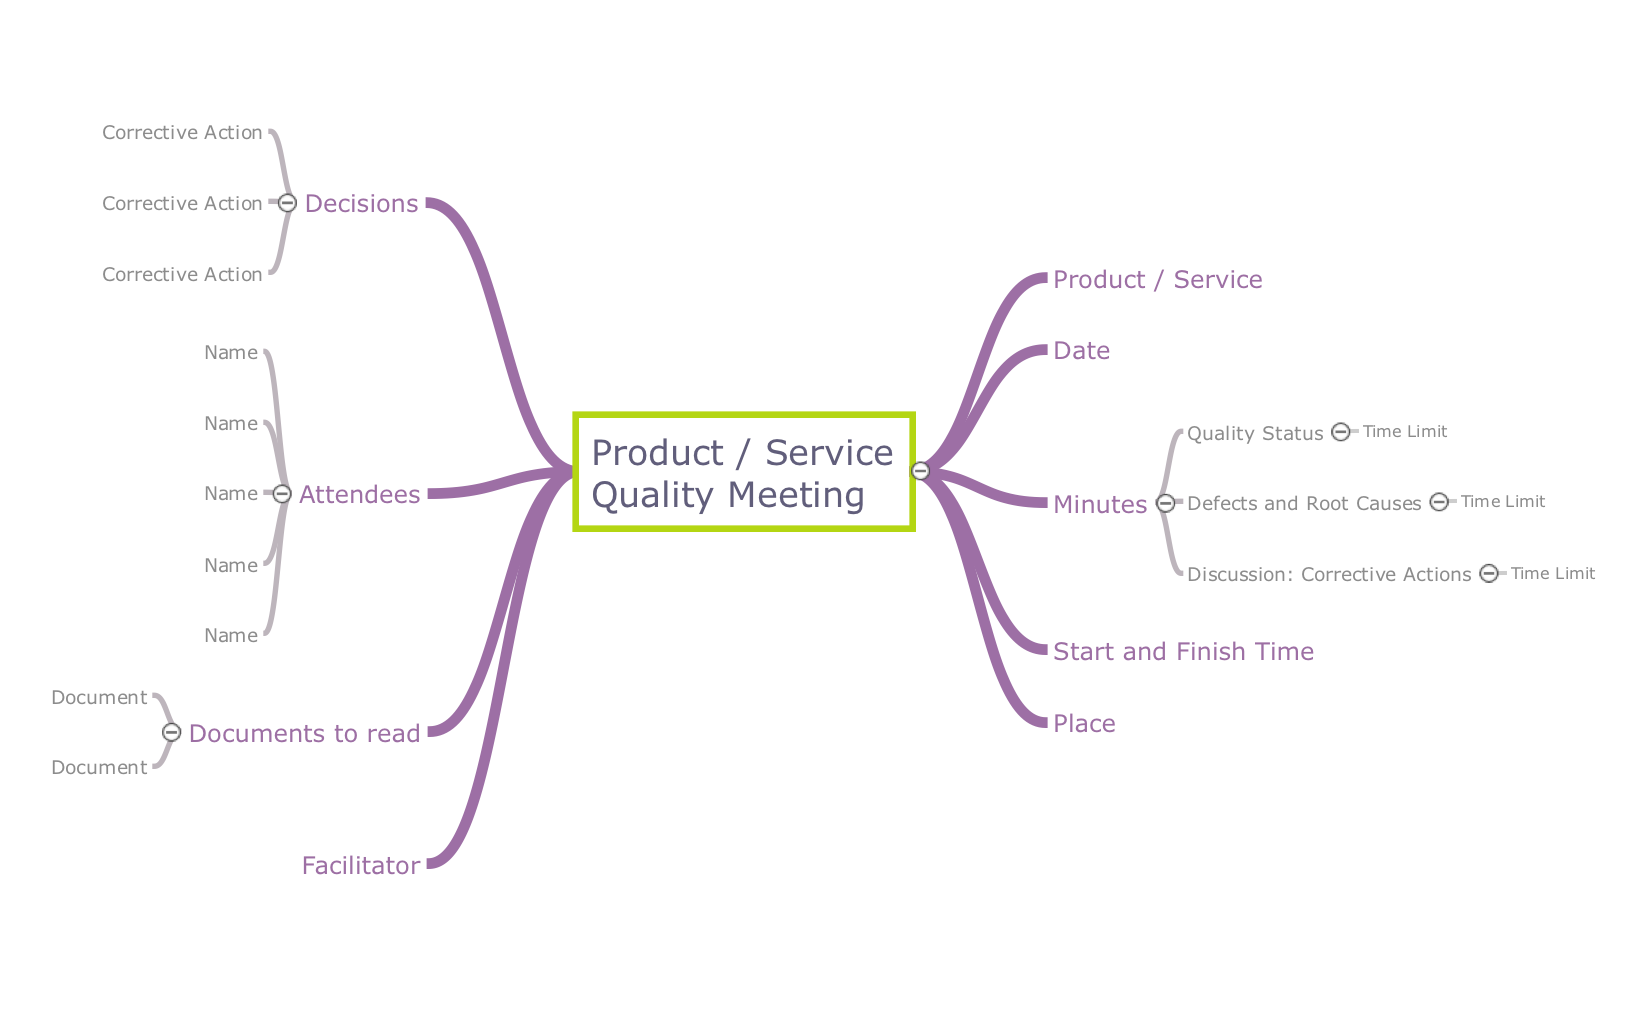
Picture: Quality visualization in your company
Related Solution:
How to create a Residential Electric Plan quick and easy? The simplest way is to use the tools of ConceptDraw DIAGRAM software extended with Electric and Telecom Plans Solution.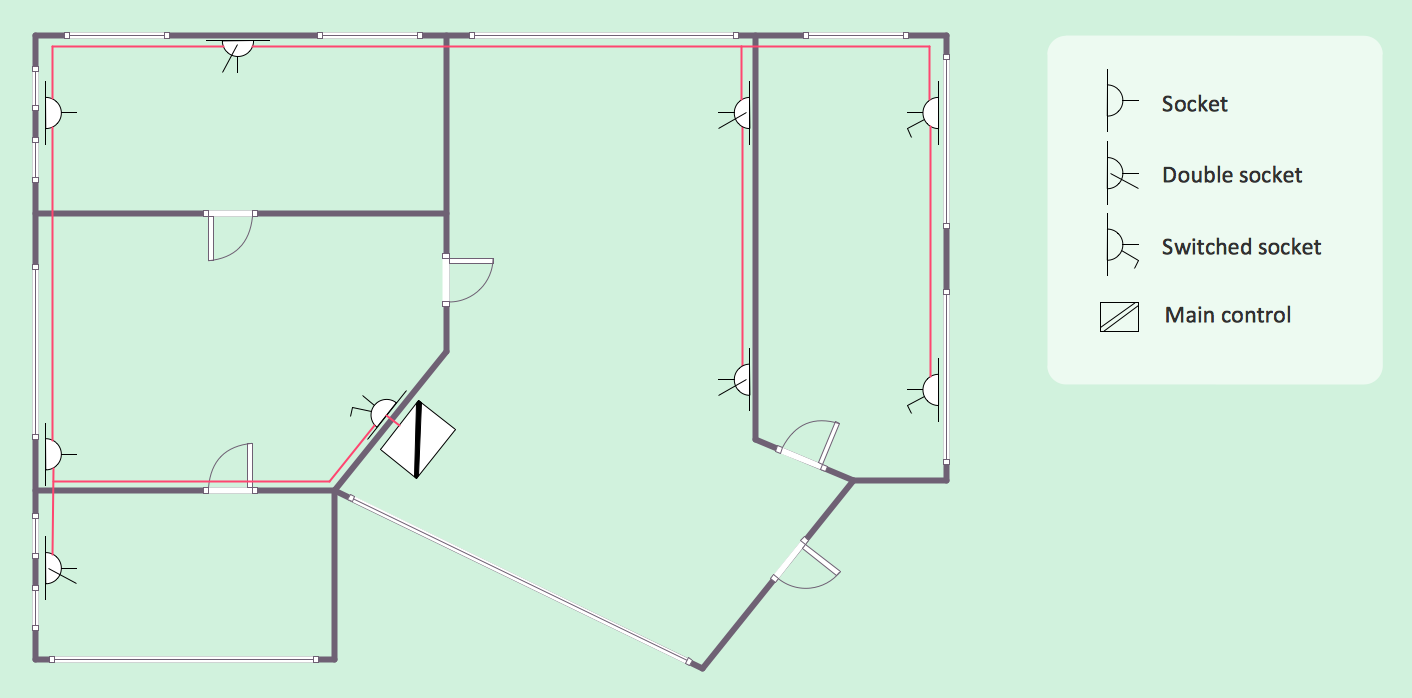
Picture: Residential Electric Plan
Related Solution:
Event-Driven Process chain Diagrams for improvement throughout an organisation.
ConceptDraw DIAGRAM - software that reduces the time needed to create a business process model.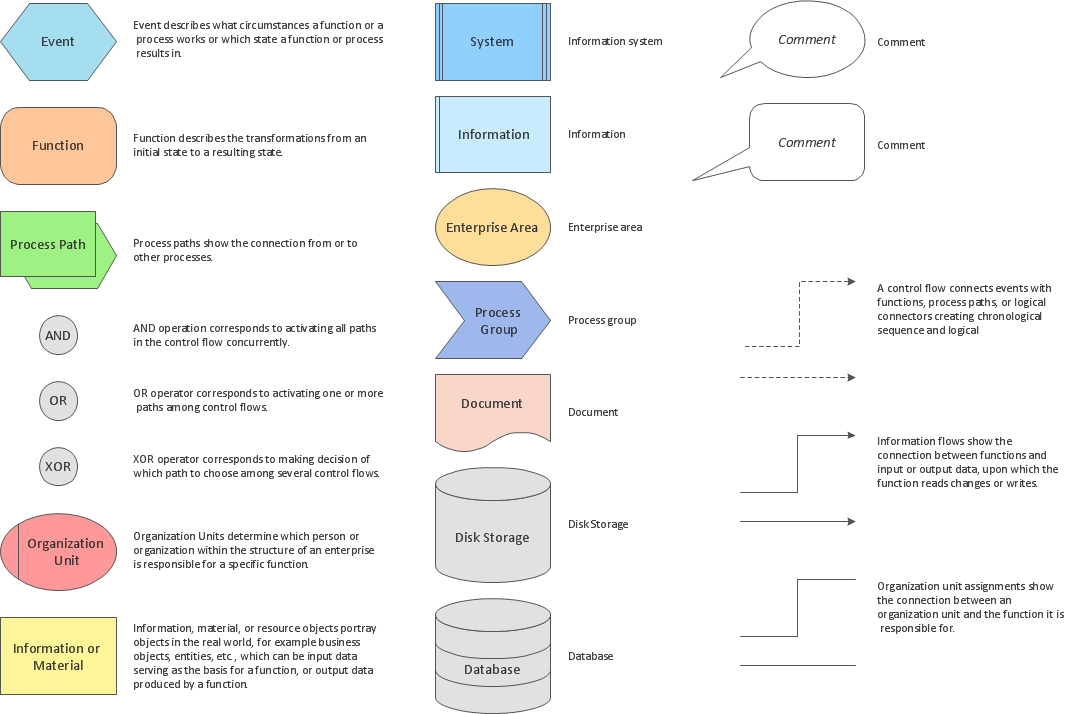
Picture: Software for Drawing EPC Diagrams
Related Solution:
Process mapping helps with sharing business results and reorganizing workflow. In almost every case, after creating a sales process flowchart the steps that are redundant become obvious for a manager. It's easy to find a flowchart examples that will help in developing one for your business.
This sales process flowchart consists of a sequence of steps that represent a simple sale process. Each step is shown graphically by a rectangle representing processing steps or an activity, or a diamond representing a decision. These rectangles are linked by arrows, that indicate the direction of the sales workflow. ConceptDraw Sales Flowcharts solution delivers a the full set of classical flowchart notation symbols, along with sales-related icons and pictograms.
Picture:
Sales Process Flowchart
Flowchart Examples
Related Solutions:
It’s very important for any establishment to have a fire exit plan and to train it several times a year. The plan must be put on each floor of the building in a way that it could be easily seen. To make the plan clear and descriptive, you should look through examples and then create one for you your building.
Find out the fire exit plan example created with ConceptDraw DIAGRAM and its Fire and Emergency Plans solution. This plan is a floor plan that shows the ways in which people inside the building can be evacuated in the event of a fire. The location of telephones, fire extinguishers and first aid kits are indicated on the fire exit plan. The Legend in the lower right corner of the plan makes it clear and easy-to-read. Such plan should be placed on the wall on each floor of the building.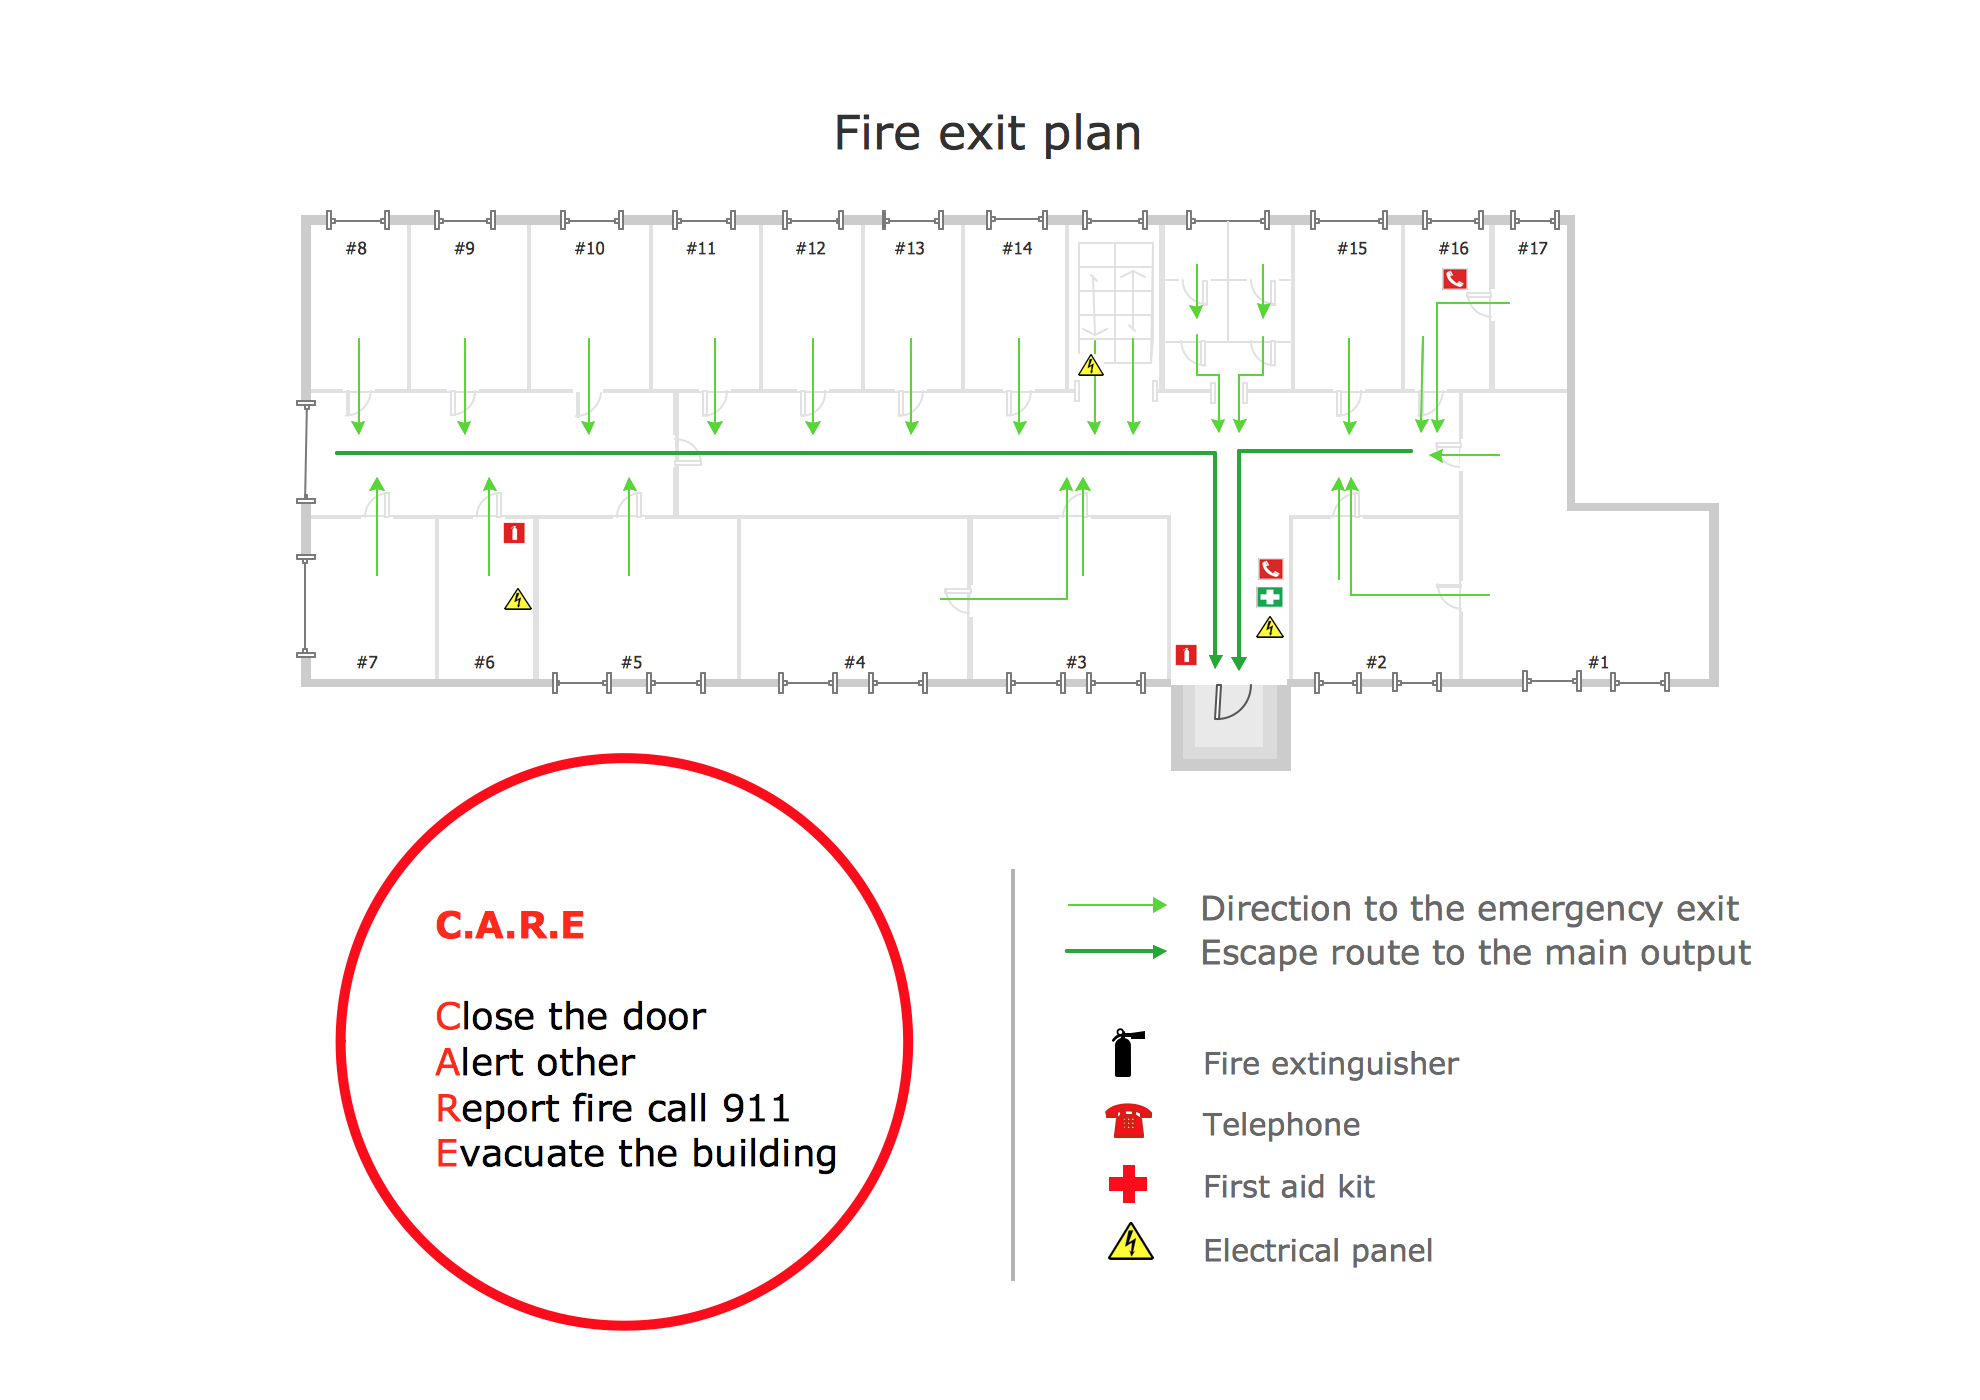
Picture: Fire Exit Plan. Building Plan Examples
Related Solution:
Sample Pictorial Chart - Pictorial Infographics solution provides easy-to-use design infographics drawing tools, large collection of different sample infographics and infograms, sample pictorial chart and templates to be filled in, and 10 libraries with great quantity of predesigned vector pictograms.
Use Pictorial Infographics solution to draw your own design pictorial infographics documents quick and easy.
Picture: Sample Pictorial Chart. Sample Infographics
Related Solution:
A layout is a way that furniture is arranged in some place. It’s not difficult to develop a store layout using software with tons of templates and libraries with vector shapes of furniture, doors, walls etc. Create a plan in five minutes and have more time to implement it.
Designing the floor plan for a new store is very important step for a small business. Well thought out and well-done floor plan is the foundation of the store layout. It should provide a basis through which to make out and organize everything else. Sometimes a small stores have a small floor space, so well thought out arrangement of furniture and commercial equipment is crucial to the success of the business. By using the ConceptDraw Floor Plans solution you can make a floor plan for your store quickly and effortlessly.
Picture: Store Layout Software
Related Solution:
There are many tools to manage a process or to illustrate an algorithm or a workflow. Flowcharting is one of those tools. However, it may be difficult to show complex processes that require multiple attributes or several people in a simple flowchart, so a cross-functional flowchart would be a solution for that situation. To create such flowchart, group processes and steps to labeled rows or columns, and divide those groups with horizontal or vertical parallel lines. It is worth mentioning that there are different types of cross-functional flowcharts, like opportunity or deployment flowchart.
This diagram shows a cross-functional flowchart that was made for a trading process. It contains 14 processes, distributed through 5 lines depicting the participants who interact with the process. Also there are connectors that show the data flow of information between processes. The cross-functional flowchart displays a detailed model of the trading process, as well as all participants in the process and how they interact with each other. The lines in the flowchart indicates the position, department and role of the trading process participants.
Picture: Cross-Functional Flowchart
Related Solution:
Food courts are one of the most rapidly developing areas of the restaurant business. ConceptDraw DIAGRAM diagramming and vector drawing software offers a Food Court solution from the Food and Beverage area with wide capabilities for planning, design, developing and advertising of a Food Court.
Picture: Food Court
Related Solution: