Flowcharting Software
Introduction to Flowcharting
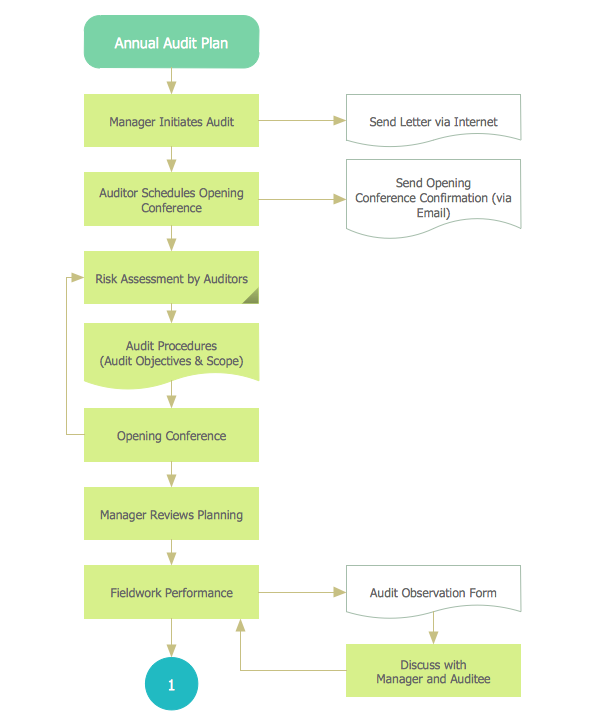
Creating a Flowchart, which is known as a type of diagram that represents some algorithm, some process, or some workflow, may be a challenge for those who have never had any experience in doing it before. Having such a useful tool as the ConceptDraw DIAGRAM diagramming and drawing software makes it as easy as possible. Having an opportunity to use the Flowcharts solution from the ConceptDraw STORE application, it is worth taking advantage of.
By showing the steps of any process, workflow, or algorithm in a way of the boxes of many different kinds that are connected to each other with arrows, it is possible to make any needed Flowchart. The mentioned diagrammatic representation is very commonly used in designing, documenting, managing, and analyzing any processes or programs in various fields of business activity to illustrate some solution model to a given problem.
Why Flowcharting is Essential
A Flowchart is a useful type of diagram quite popular in many areas of science and business. Used in designing and documenting some simple processes or programs, Flowcharts are also known to be one of the types of diagrams that help visualize what is going on. With the help of Flowcharts it becomes much simpler to understand any process, finding the flaws, the bottlenecks as well as other less-obvious features within it. There are a lot of different types of Flowcharts, each of which has its own repertoire of boxes as well as the notational conventions.
The most commonly used type of boxes that are used within the Flowcharts is a decision, which is known to be usually denoted in a way of a diamond, and a processing step (called an “activity”) that is denoted as a rectangular box.
Any Flowchart can be described as "cross-functional" in case the page is divided into different swimlanes. Describing the control of different organizational units, the swimlanes are often the essential part of any Flowchart diagram. Any symbol that appears in a particular "lane" is known to be within the control of this particular organizational unit. The described technique allows the author to locate any needed responsibility for making a decision or performing an action correctly, showing the responsibility of each of the organizational units for different parts of some single process.

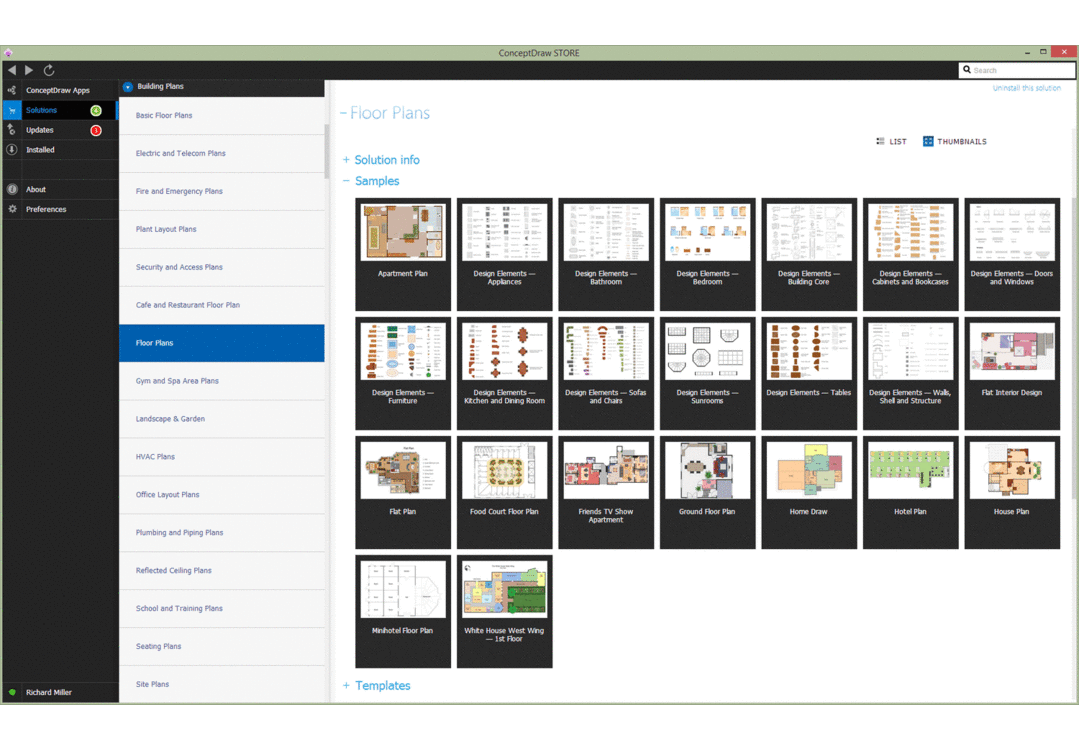
Example 1. Flowcharting Software in ConceptDraw STORE
The Role of Flowcharting in Process Improvement
Flowcharts are used for depicting certain aspects of processes being usually complemented by other types of diagrams. Flowcharts were also defined as one of the seven basic tools of quality control, and in UML (a standard concept-modeling notation that is used in any software development), the activity diagram (known to be a type of a Flowchart) is known to be one of many different diagram types.
Being an alternative notation for process flow, both Drakon-charts and Nassi-Shneiderman diagrams are also widely used but Flowcharts still have more popularity nowadays. The other common alternative names include Flow chart, Process flowchart, Process map, Process chart, Functional flowchart, Functional process chart, Business process model, Process flow diagram, Work flow chart, Process model, Business flow chart, and other. Such terms as "flow chart" and "flowchart" are used interchangeably being identical.
The underlying graph structure of any Flowchart is a flow graph. Such a flow graph abstracts away all the node types, their contents as well as other ancillary information.
Types of Flowcharts
Flowcharts could be also suggested to be modeled from the perspective of different user groups, such as system analysts, managers, clerks, etc. Also, it was stated that there are only four general types of Flowcharts. Those four types include:
- document flowcharts,
- data flowcharts,
- system flowcharts,
- program flowcharts.
Document flowcharts are usually used for showing the controls over some document flow through some system. Data flowcharts are widely used for showing the controls over some data flow in a system, system flowcharts show controls at some resource or physical level and program flowcharts show the controls in some program within a system.
Although there are several of these classifications such as Andrew Veronis named three basic types of Flowcharts: general flowchart, detailed flowchart, and system flowchart. The very same year Marilyn Bohl stated that in practice there are two kinds of Flowcharts that are used in solution planning: system flowcharts and program flowcharts.
More recently Mark A. Fryman stated that there are even more differences, defining the decision flowcharts, logic flowcharts, systems flowcharts, process flowcharts, and product flowcharts being just a few of the different types of Flowcharts that are commonly used in both government and business.

Example 2. The Best Application for Flowcharts — ConceptDraw DIAGRAM
Step-by-Step Guide to Creating Flowcharts with Software
There are many techniques available nowadays for creating Flowcharts or diagrams similar to them but carrying some other name, including UML activity diagrams. Any drawing program can be used for creating Flowchart diagrams, but the best one seems to be the ConceptDraw DIAGRAM flow diagram program as it helps to make the needed drawings within a very short period of time, such as only a couple of minutes.
ConceptDraw DIAGRAM diagramming and vector graphic software extended with Flowcharts solution from the Diagrams area of ConceptDraw Solution Park is the ideal flowcharting software with powerful tools that assist in easily making a Flow chart, in representing the flowchart steps and describing the flowchart processes, in realizing the flowchart constructions, creating the process flow models, designing the Data Flow Diagrams, and many other flowcharting-related diagrams of different types and directions.
Offering special support for Flowchart drawing, the Flowcharts solution was developed by the specialists of CS Odessa making it simpler to create the needed Flowchart with the aid of the pre-made templates as well as the design symbols that can always be used within any Flowchart drawing. Thus, flowcharting may be a fun process in case the right tools are used while creating it, such as the ConceptDraw DIAGRAM flow chart application and the ConceptDraw STORE.

Example 3. Basic Flowchart Template
Flowcharting Software for Non-Technical Users
Professional flowcharting software is a useful tool even for beginners, people with little technical experience, and non-technical users to organize their ideas, plan projects, and visualize processes. Being user-friendly the best flowchart maker simplifies extremely the flowcharting process, making it accessible for everyone, regardless of his experience. Such tools as an intuitive drag-and-drop interface, ready-made shapes corresponding to flowcharting standards, time-saving easy-customized pre-built templates, collaboration features, and export options to many formats are indispensable. Built-in tutorials and customer support also have great value in guiding users without prior technical knowledge to cope with their tasks perfectly.
Business companies can use Flowcharts as a business strategy tool to assess new product opportunities, evaluate market entry strategies, make more informed decisions about resource allocation and growth, etc. Project managers use them to decide on project priorities, adjust strategies, evaluate timelines, and assess potential delays or bottlenecks. HR specialists can use Flowcharts to visualize the steps of the hiring process, evaluate candidates for a job position while ensuring that all necessary criteria are evaluated fairly, and weigh such factors as qualifications, experience, cultural fit, and others. Flowcharts are also useful for making personal decisions, organizing time and budget, planning activities, making preferences, etc.
ConceptDraw DIAGRAM software is the best assistant for both technical and non-technical users. It offers a variety of benefits and includes all listed above tools and functions, which save time and effort and simplify complex ideas and processes, help to break them down and create clear visual representations, as well as include wide export capabilities to improve communication and collaboration. Users enjoy the flowcharting process with the intuitive interface of the user-friendly ConceptDraw DIAGRAM flow diagram maker. Don't miss your chance also to try this.
Advantages of Flowcharting for Business and Education
Flowcharting offers numerous advantages for both business and education, in particular, it:
- visualizes and simplifies complex information;
- visually breaks down processes into smaller steps;
- enhances clarity of complex processes and makes them easier to understand;
- provides consistency in representation processes and systems;
- improves communication of ideas, processes, workflows, procedures, etc.;
- simplifies collaboration and information exchange among team members;
- increases productivity;
- enhances overall efficiency;
- streamlines workflow analysis, problem-solving, and decision-making;
- helps identify inefficiencies and mistakes early;
- assists in error reduction;
- provides customizability and flexibility in drawing and representing processes;
- ensures effective documentation.

Example 4. Flowcharting on Mac
Common Mistakes to Avoid When Using Flowchart Software
When creating a Flowchart and using flowchart software, it’s essential to follow best practices to ensure the simplicity, clearness, and effectiveness of your charts, and improve understanding and communication. Strive to follow the next tips:
- make your diagram simple and focused on the key steps or processes;
- avoid overcomplicating or overwhelming the diagram;
- avoid inconsistent, incorrect, or non-standard use of symbols;
- test your Flowchart and make sure that all elements are connected logically using arrows;
- use the alignment and distribution tools to ensure that a diagram is strict and clear;
- use colors, but make your Flowchart stylish avoiding excessive use of many different colors;
- use clear fonts and concise text to ensure clarity and avoid overloading with information.
Conclusion
Flowcharts are an essential tool to visualize all types of processes and workflows. They provide clarity, structure, and insight, and are efficient in decision-making, help individuals and teams assess risks, evaluate options, and make informed choices. Flowcharting is an efficient and systematic approach that leads to better outcomes in business, project management, or personal issues.
Best program for Flowcharts ConceptDraw DIAGRAM facilitates maximally the drawing process by means of included predesigned vector objects, which only need to be dragged to your ConceptDraw document from the corresponding library and connected with smart connectors. This way it makes creating Flowcharts for both simple and complex processes and procedures equally easy.