Unified Modeling Language (UML) is a language of graphic description for object modeling in the field of software engineering. UML was created for definition, visualization, designing of software systems. UML is an open standard that uses graphic notations for creating visual models of object-oriented software systems.
Two types of diagrams are used in UML: Structure Diagrams and Behavior Diagrams. Behavior Diagrams represent the processes proceeding in a modeled environment. Structure Diagrams represent the elements that compose the system.
There are seven types of Structure Diagrams that must be present in any modeled system:
UML Class Diagram is a type of Structure Diagrams that shows the classes of a system, attributes, operations, and the relationships between them.
Package Diagrams
UML Package Diagram is a type of Structure Diagrams that represents the packages of the model and dependencies between them.
Object Diagrams
UML Object Diagram is a type of Structure Diagrams that shows the objects of the system and attributes, and relations between the objects at a certain moment of time.
Use Case Diagrams
UML Use Case Diagram is a type of Behavior Diagrams that displays the dependencies between the actors and use cases.
UML Use Case Diagram displays the system on the conceptual level.
Sequence Diagrams
UML Sequence Diagram is a type of Interaction Diagrams that describes the interactions between objects and classes that are involved in the scenario and the sequence of messages exchanged between them.
Collaboration Diagrams
UML Communication Diagram in UML 2.0 (Collaboration Diagram in UML 1.x) is a type of Interaction Diagrams that displays the interactions of objects using the sequenced messages.
Activity Diagrams
UML Activity Diagram is a type of Behavior Diagrams that graphically describes decomposition of the some activity on the components.
Component Diagrams
UML Component Diagram is a type of Structure Diagrams that shows how components are connected to larger components or software systems, and shows the dependencies among these components.
Deployment Diagrams
UML Deployment Diagram is a type of Structure Diagrams that shows the physical deployment of information generated by the software programs.
State Machine Diagrams
UML State Machine Diagram is a type of Behavior Diagrams that displays the finite state machine with states and state transitions.
Timing Diagrams
UML Timing Diagram in the UML 2.0 is a specific type of Interaction Diagrams that describes the timing constraints.
UML Timing Diagrams describes the behaviors of the objects during a certain period of time.
Interaction Overview Diagrams
UML Interaction Overview Diagram is a type of Interaction Diagrams that describes an overview in which the nodes represent interaction diagrams.
Composite Structure Diagrams
UML Composite Structure Diagram is a type of Structure Diagrams that shows the internal structure of a class and the interactions of elements of the internal structure of the class.
Example 1. UML Class Diagram. AbstractFactory pattern
All libraries for creating UML diagrams are available inside the ConceptDraw DIAGRAM Templates and samples are located in the Rapid UML section of ConceptDraw STORE.
If we divide computer networks by scale, we get several main categories. The smallest network is PAN, as it connects personal devices themselves, and as the number of users grows, a local area network can be recognized, and campus area networks (CAN) connects several local networks located within some area like a university or a corporation. Computers connected to CAN share public educational materials and list of CAN network examples includes such prestigious universities like Stanford and Carnegie Mellon.
This is an example of a computer network diagram created for a campus area network. It was created using using ConceptDraw solution for the Computer and Network diagramming. The specific of this sample campus network is its distribution. It is rather broad to embrace a big campus territory. This diagram can be applied as a template for designing custom area network topology diagram for a particular educational institution.
Picture: Campus Area Networks (CAN). Computer and Network Examples
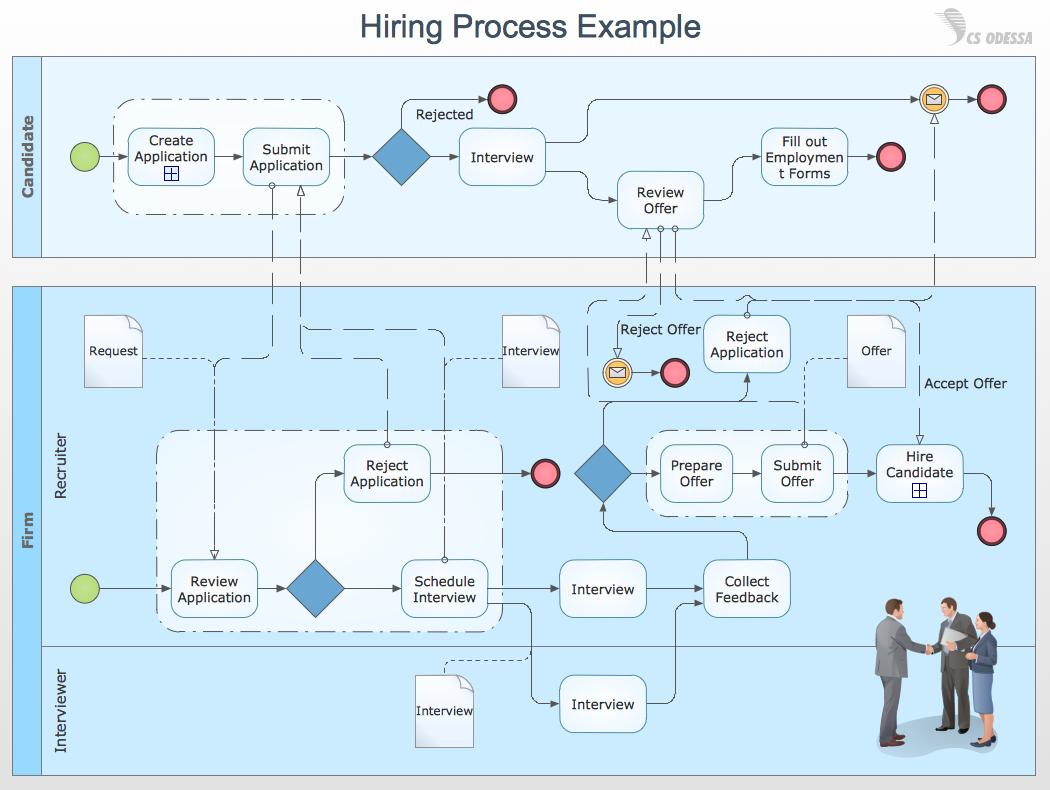
Business Process Modeling Notation -BPMN- is a set of standard symbols that allow you to create a graphical view of a business process. The symbols were developed to help users develop standard, unified structure of processes, and any messages shared between these processes. This is business process improvement tools.
Picture: Business Process Modeling with ConceptDraw
The behavior of worker in organization is influences organizational effectiveness. A simple block diagram made with ConceptDraw Block diagrams solution can improve the understanding of expectations of workers regarding what they l contribute to organization and what they wait to obtain. Making block diagram depicting the individual behavior in organization is used in HR management to obtain an optimal and positive overall contribution to the organization.
The behavior of worker in organization is influences organizational effectiveness. A simple block diagram made with ConceptDraw Block diagrams solution can improve the understanding of expectations of workers regarding what they l contribute to organization and what they wait to obtain. Making block diagram depicting the individual behavior in organization is used in HR management to obtain an optimal and positive overall contribution to the organization.
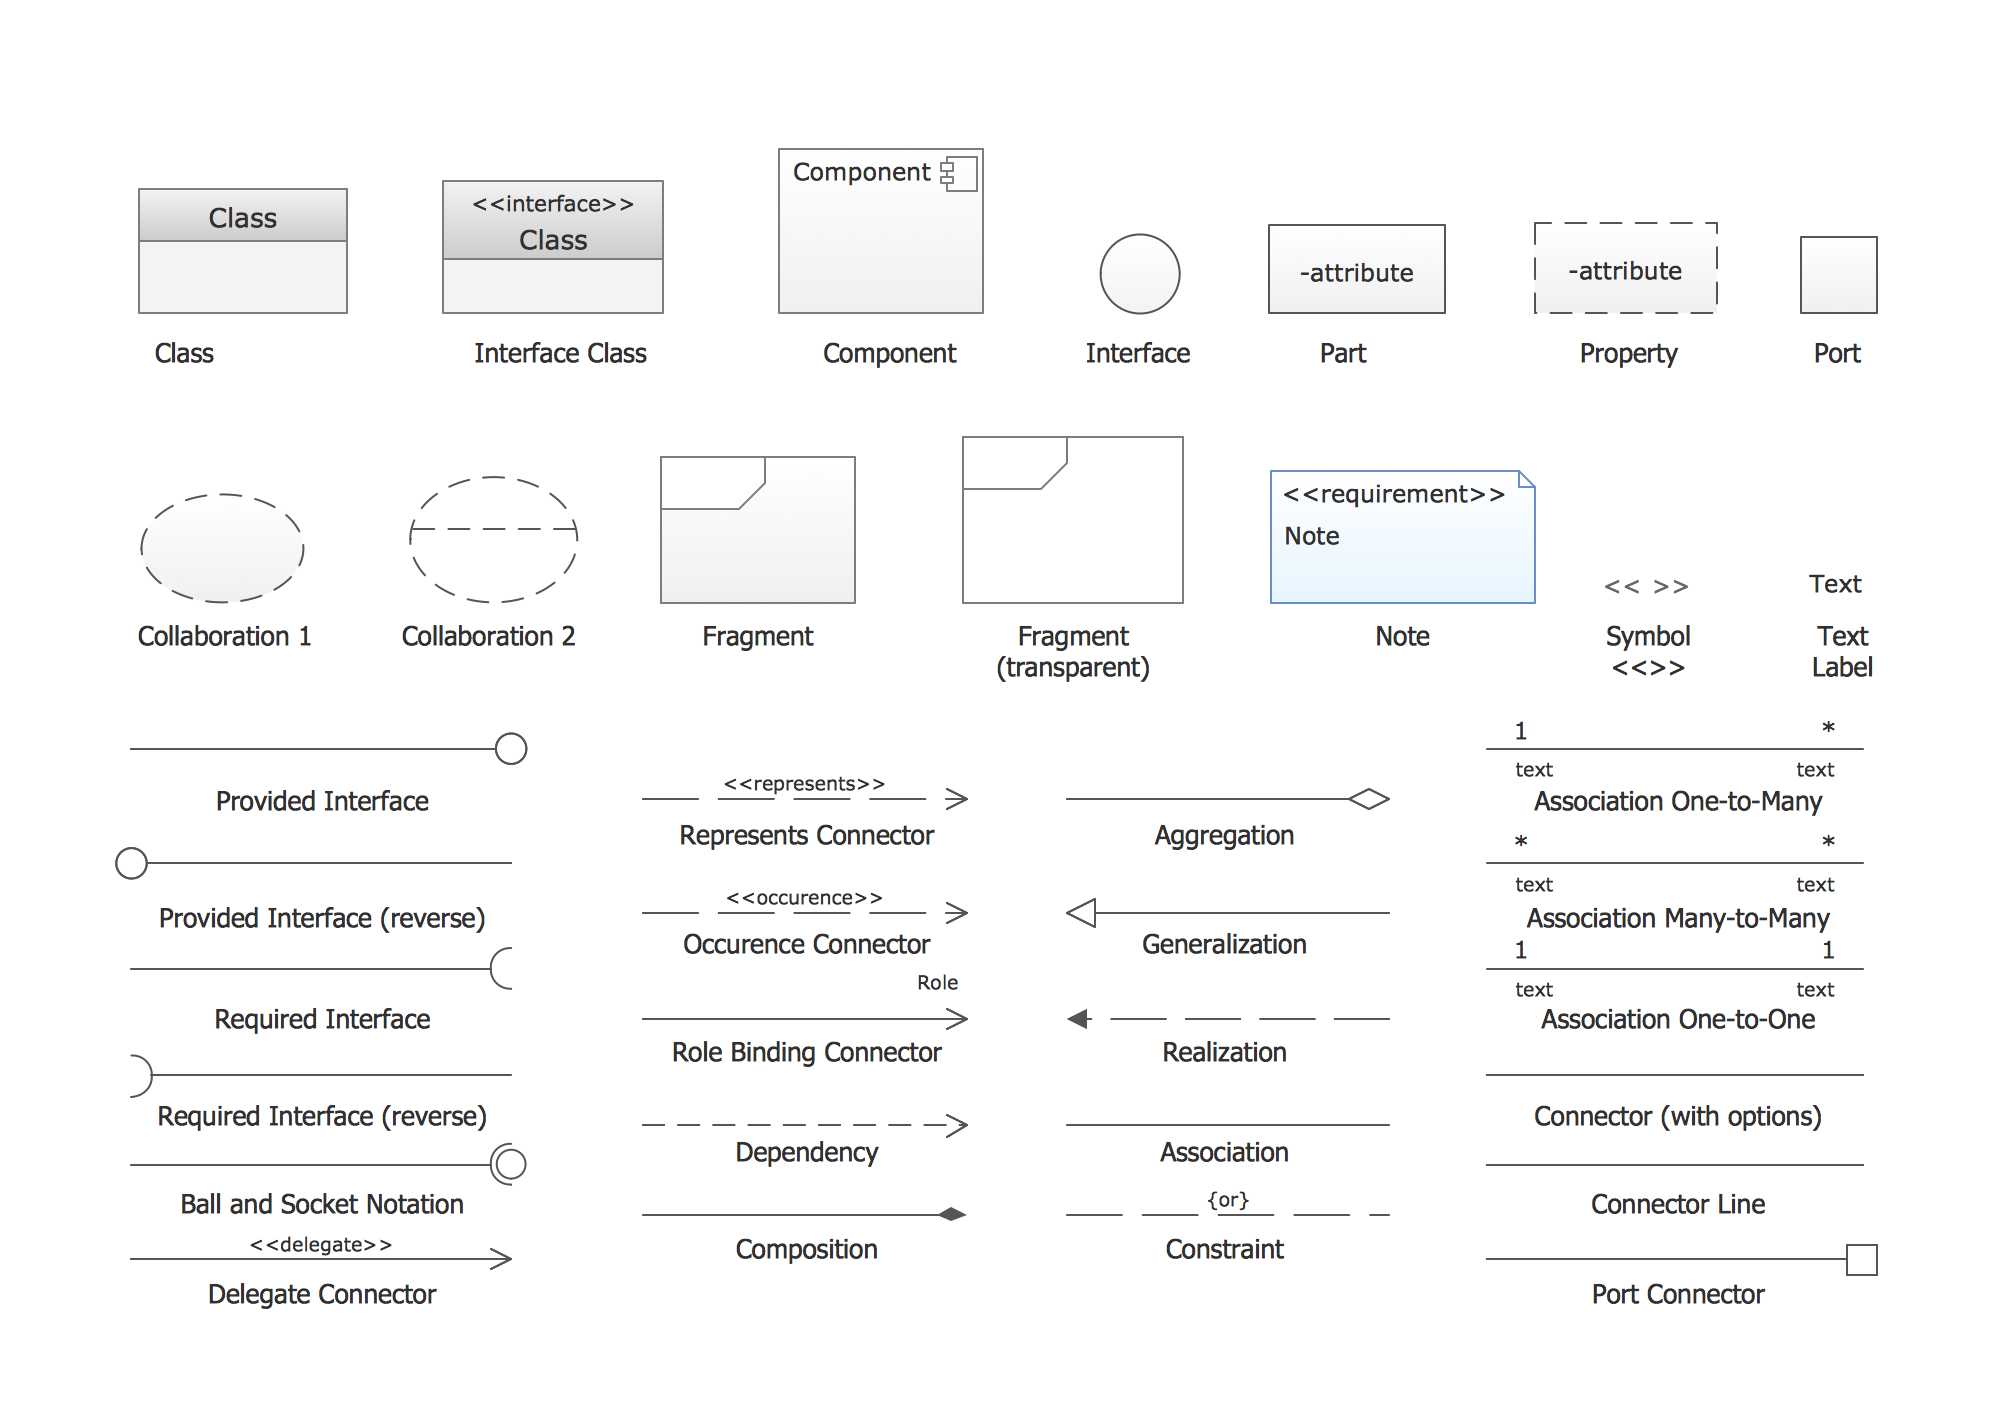
UML Composite Structure Diagram shows the internal structure of a class and the possible interactions at this structure.
ConceptDraw has 393 vector stencils in the 13 libraries that helps you to start using software for designing your own UML Diagrams. You can use the appropriate stencils of UML notation from UML Composite Structure library.
Picture: UML Composite Structure Diagram. Design Elements
ConceptDraw DIAGRAM software extended with Fishbone Diagrams solution from the Management area of ConceptDraw Solution Park is perfect for Cause and Effect Diagram creating. It gives the ability to draw fishbone diagram that identifies many possible causes for an effect or a problem. Causes and Effects are usually grouped into major categories to identify these sources of variation. Causes and Effects in the diagram show relationships among various factor. Fishbone diagram shows factors of Equipment, Process, People, Materials, Environment and Management, all affecting the overall problem.
Matrix organizational structure is one of the main forms of structures which is actively used by organizations to carry forth the functions of a company visually and effectively.
Now we have ConceptDraw DIAGRAM diagramming and vector drawing software extended with 25 Typical Orgcharts solution from the Management area of ConceptDraw Solution Park which will help easy represent matrix organizational structure of any degree of complexity.
UML Activity Diagram illustrates the business and operational step-by-step workflows of components in a system and shows the overall flow of control. You can use the appropriate stencils of UML notation from UML Activity library with 37 objects. ConceptDraw is ideal for software designers and software developers who need to draw UML Activity Diagrams.
Use ConceptDraw DIAGRAM diagramming and vector drawing software enhanced with Rapid UML solution from ConceptDraw Solution Park to create your own UML activity diagrams that show the business and operational workflows of components and overall flow of control in your systems. Such software provides coloring UML diagrams for various purposes and simplifying work of the engineers.
Network Security Architecture Diagram visually reflects the network's structure and construction, and all actions undertaken for ensuring the network security which can be executed with help of software resources and hardware devices. You dream to find powerful software for easy designing Network Security Architecture Diagram? We recommend to use ConceptDraw DIAGRAM extended with Network Security Diagrams Solution from the Computer and Networks Area of ConceptDraw Solution Park.
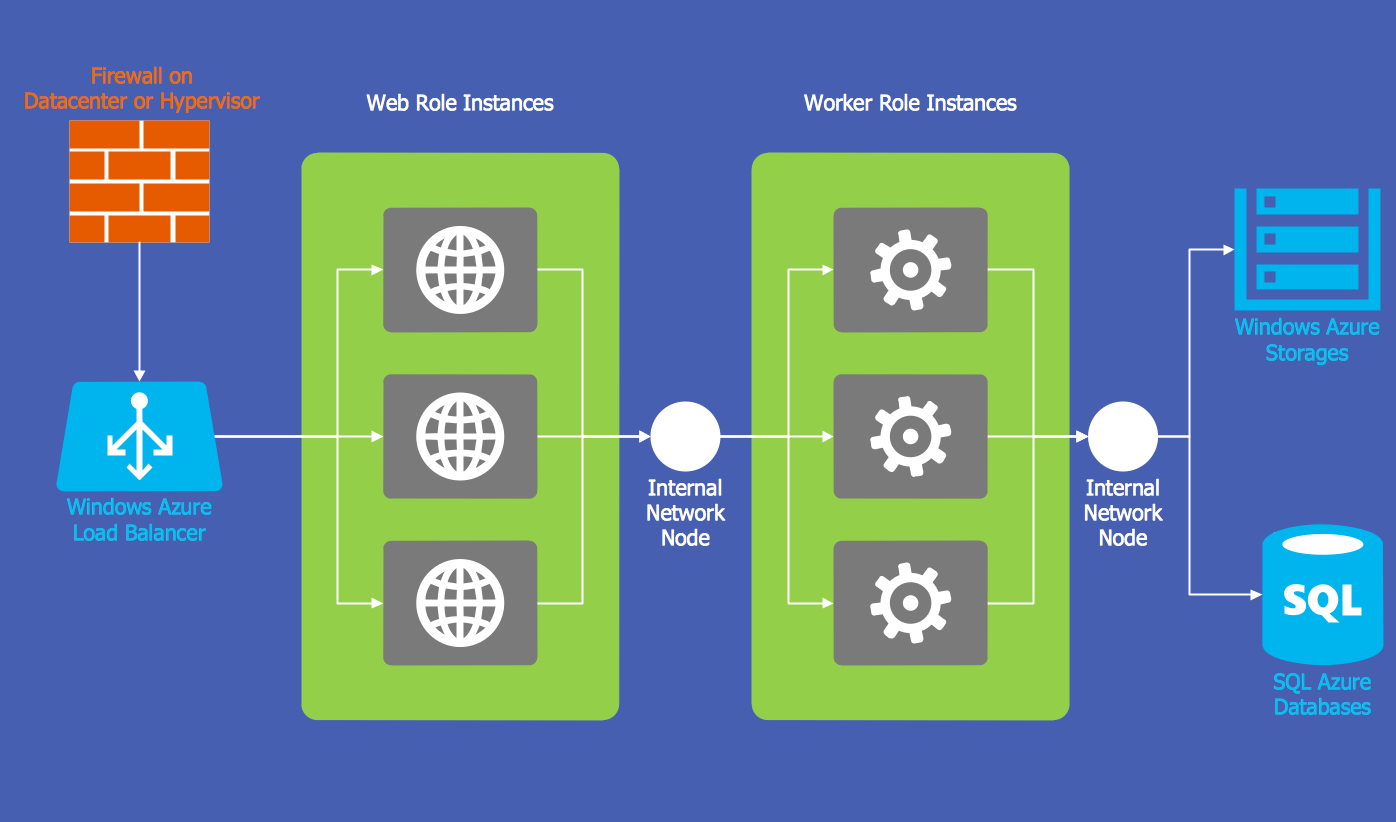
The Microsoft Windows Azure platform is a highly flexible cloud-based solution with variety of services which supports not only the execution of.NET applications, but also allows developers to use programming languages like Java, PHP, Node.js, or Python.
ConceptDraw DIAGRAM diagramming and vector drawing software provides the Azure Architecture Solution from the Computer and Networks area of ConceptDraw Solution Park with a lot of useful tools which make easier: illustration of Windows Azure possibilities and features, describing Windows Azure Architecture, drawing Azure Architecture Diagrams, depicting Azure Cloud System Architecture, describing Azure management, Azure storage, documenting Azure services.
The Venn diagram example below shows sustainable development at the confluence of three constituent parts.
Create your Venn diagrams for problem solving in environmental social science using the ConceptDraw DIAGRAM software.