SSADM Diagram
SSADM’s full name is “Structured Systems Analysis and Design Method”. This method is known to be a “waterfall” one, which means that it is a non-iterative design process, used in the different development processes of software, having the progress as a flowing steadily downwards, reminding a “waterfall”. These “downwards” go through the phases of initiation, design, analysis, conception, construction, production, testing, maintenance and implementation. SSADM is used in the design and analysis of different information systems, representing a pinnacle of the rigorous document-led approach, contrasting with more contemporary so-called “agile” methods (for example, “Scrum” one or “DSDM”). This method is basically a particular implementation and it helps build the work of different schools of the analysis, development methods, design and so on.
"Structured Systems Analysis and Design Method" or "SSADM" has its principles in use, which stages of the development started in 1980, when the “Central Computer and Telecommunications Agency” evaluated the analysis and the design methods in order to end up using exactly this one. In 1981 the consultants from “Learmonth and Burchett Management Systems” developed the first version of SSADM, followed by the second in 1984 and the third in 1986. Already in 1990 the fourth one was launched, followed by 4+ and 4.2 in 1995. Thus, SSADM got more and more popular, being renamed in 2000 as simply the "Business System Development" method. The leading techniques, which make this method so special, include the process of identifying, modelling and documenting data moving all around an information system. This process was called “Data Flow Modelling”, examining the processes as well as the external entities, and also the data flows. The second feature of using the Structured Systems Analysis and Design Method is that it involves the process of identifying, modelling as well as documenting the data requirements of the system, which is being designed. The result of such manipulation is a data model, which contains the entities, attributes (which can be facts about the mentioned entities) and relationships between different entities.
There is another process, involved in a Structured Systems Analysis and Design Method, known as a “two-stranded” one. This process includes the “Entity Behaviour Modelling”, which is identifying, modelling and documenting the events, which affect each of the existing entities as well as the sequence. It also involves the “Event Modelling”. In general, the “SSADM” method is known to be involving the application of a sequence of analysis, design tasks and documentation appearing. All of the stages go one by one, including the determination of whether or not a given project is feasible, answering the questions of if the project is technically possible, can the business afford to carry out such project, is there any impact on the new system, being socially acceptable and will the new system be compatible with the existing practices. Thus, “SSADM” specifies the sections that the study should contain, including any preliminary models, being constructed as well as the details of the rejected options.
On the second stage of conducting the SSADM we should understand that in almost all of the cases there is some form of the current system existing, even if it is composed of only paper and people. Thus, in a way of combining the circulating questionnaires, the interviewing employees, the existing documentation as well as the observations, we can understand the system much better. After investigating the current system, we have to decide which design of the new system we want to have. Once we do, we should develop a set of business system options, in which the new system could be produced. The answers to the questions, which we have to ask ourselves, have to include the needed degree of automation, the distribution of the system, the cost and so the benefit, the impact of the new system and many more.
Next stage provides developing a full logical specification of what the new system must do and the way it should be implemented. Such specification should not include any ambiguity or inconsistency, although there is also no need to mention in detail the way the system will be implemented but to describe what this system is meant to be doing. To make such analysis, it is better to build the required logical models for both the DFDs, which are “data flow diagrams” and the LDM, which is a “Logical data Model”. Going through this stage, you will end up having the updated data catalogue as well as the requirements one, the processing specification, the user function matrix as well as the function definitions, the entity life-histories, the logical data model and the effect correspondence diagrams.
Getting to the next stage, you should be prepared to conducting a physical implementation of the new system, as lots of options for the implementation of the new system should be generated by now. The outputs of the next stage are known to be an “implementation-independent” as well as concentrate on the requirements for the human computer interface. It ends with getting the product of the logical design, made up of data catalogue, the required logical data structure, the logical process model, etc. On the final stage all of the logical specifications of the system should be already converted to descriptions of the system, taking into consideration the real hardware and software. This stage is known to be a very technical as a total simple overview should be presented here.
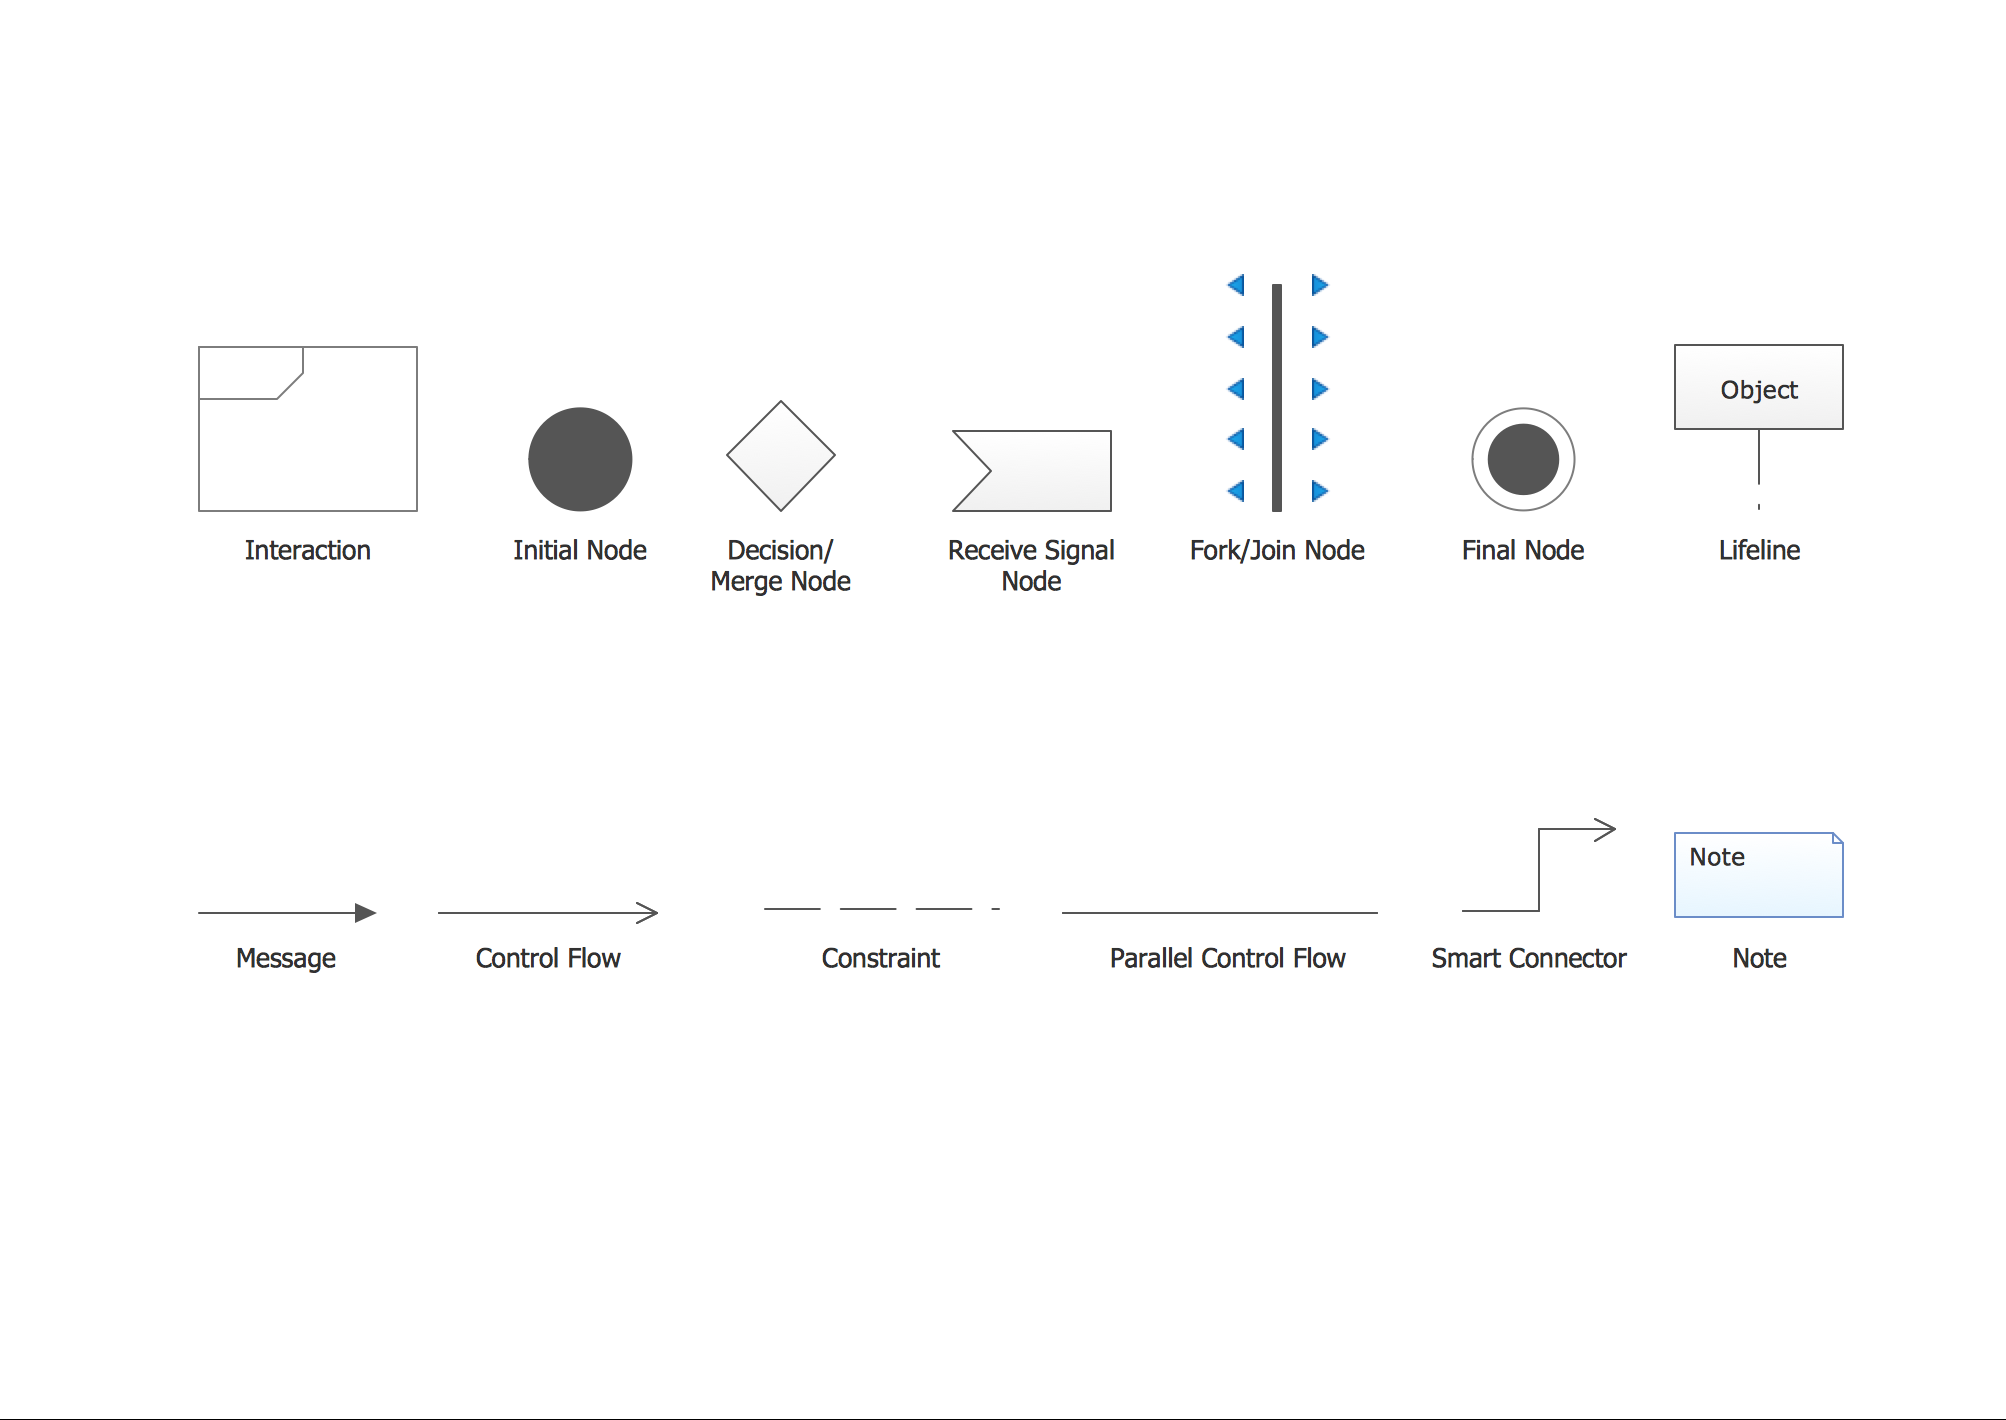
Going through the stages in order to get the needed result, you can make a diagram, mentioning all of the needed data while conducting your Structured Systems Analysis and Design Method. With the help of ConceptDraw DIAGRAM it is much simpler to create any needed diagram, including the SSADM one. Having the vector stencils library “SSADM” from the solution named as the “Systems engineering”, which contains the specific symbols for making the “SSADM diagram” looking simply amazing, which includes it to be looking smart and professional, you can achieve the needed result. The ConceptDraw DIAGRAM software will be there for you providing all of the needed tools, including the “Systems engineering solution”, which can be found in the “Software Development area” of ConceptDraw Solution Park on this site or in ConceptDraw STORE.
Use the Systems engineering solution to draw SSADM diagrams for your business documents, presentations and websites.

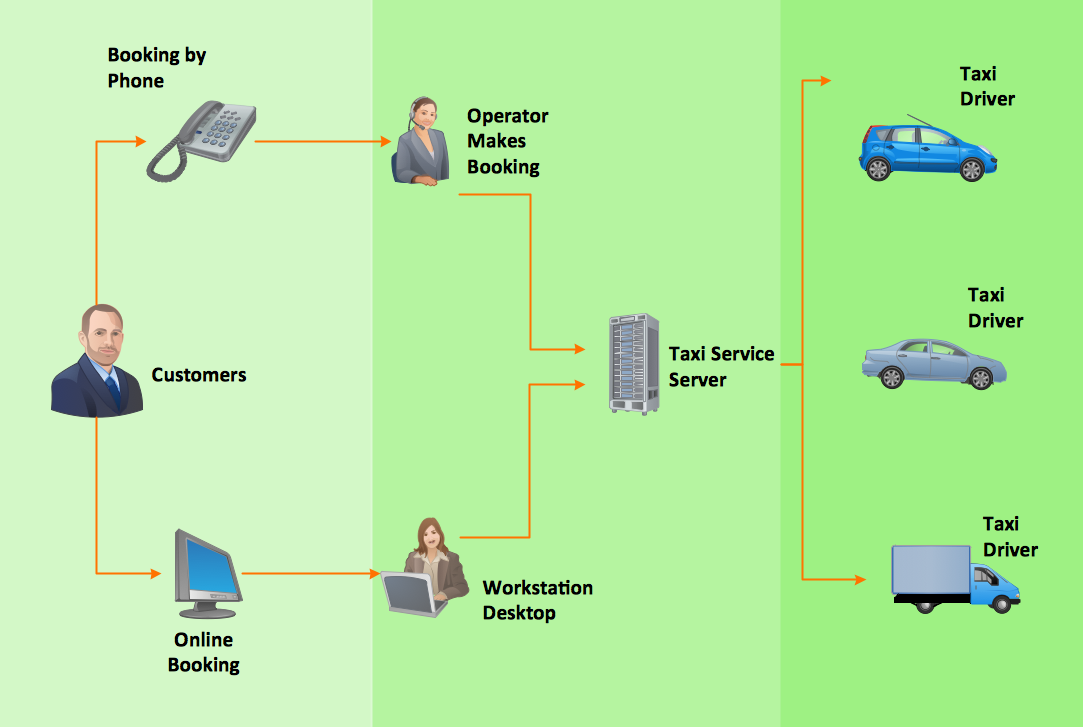
Example 1. SSADM Diagram — Systems Development Lifecycle
The example above illustrates the waterfall model used in SSADM. This model involves 5 stages of developing a product such as requirements specification and its' analysis, design, coding and testing.
ConceptDraw DIAGRAM is a perfect tool for:
- Designing and planning tasks such as:
- Jacobson Use Cases Diagram
- Yourdon and Coad Diagram
- Command OLE Diagram
- Block Diagrams
- Data Modeling Diagram
- SysML Diagram
- Chen RED Diagram
- Martin RED Diagram
- IDEF0 Diagram
- Booch OOD Diagram
- Gane Sarson Diagram
- Memory Object Diagram
- Data Flow Diagram
- FlowCharts
- Graphic User Interface (GUI)
- UML Diagram
- Program Structure Diagrams
- ORM Diagram
- Developing Visualization Solutions
- Project Planning (Gantt Charts, Timelines, Project Schedules)