Flowchart Software: A Comprehensive Guide
Introduction to Flowcharts
A flowchart is a simple diagram, map, or graphical schematic representation of a process. It is a simple mapping tool that shows the sequence of actions within a process and is ideal for displaying how a process currently flows or can function ideally.
Flowcharts allow defining the steps and boundaries of a process, and uncovering problems or miscommunications. They are widely used in education, software development, business, economics, business process modeling, and other fields. Thanks to their visuality, Flowcharts are ideal for presentations and reports, in particular, they help the audience to visualize the content of economic presentations better or to find flaws in flow chart process. They assist in visualizing workflows, identifying bottlenecks, and ensuring that processes run smoothly and efficiently.
Flowcharts are perfect for use at conferences, can help to see whether the steps of a process are logical, uncover problems or miscommunications, define the boundaries of a process, and develop a common base of knowledge about a process. Flowcharts include:
- Basic Flowchart,
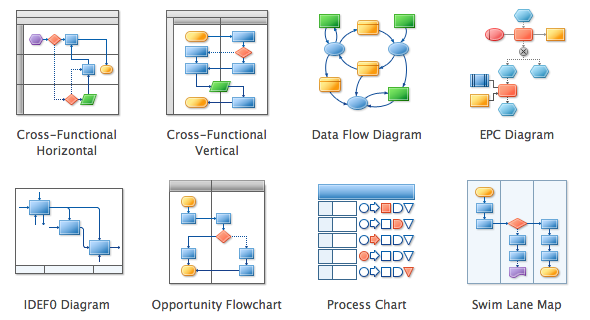
- Cross-functional flowchart,
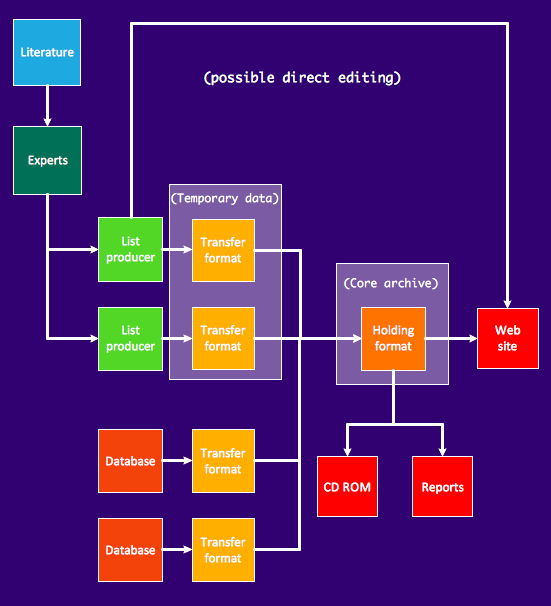
- Data Flow Diagram,
- Business process flowchart,
- IDEF flowchart,
- Workflow
- SDL diagram, and other types.
Understanding the Basics of Flowcharts
Flowcharts are visual diagrams used to represent processes, systems, or algorithms. They are also a very good way to get a new idea explained in a presentation. Flowcharts use standardized symbols to represent specific elements of the process, help to break down complex tasks into simple and sequential steps, create a clear and structured overview of the process, and make it easier to understand and analyze the flow of information or actions. The key elements include rectangles for processes, ovals to show the start and end, diamonds for decisions, and arrows to show the direction.
By understanding the basics of flowchart symbols and structure, you can easily map out and communicate processes to others. ConceptDraw DIAGRAM flowchart software has some new great tools for creating a visually appealing flowchart, workflow, and business process quickly and easily. To create Flowchart efficiently, it is best to start from the flowchart example or template and use the pre-made elements.
Key Symbols Used in Flowcharts
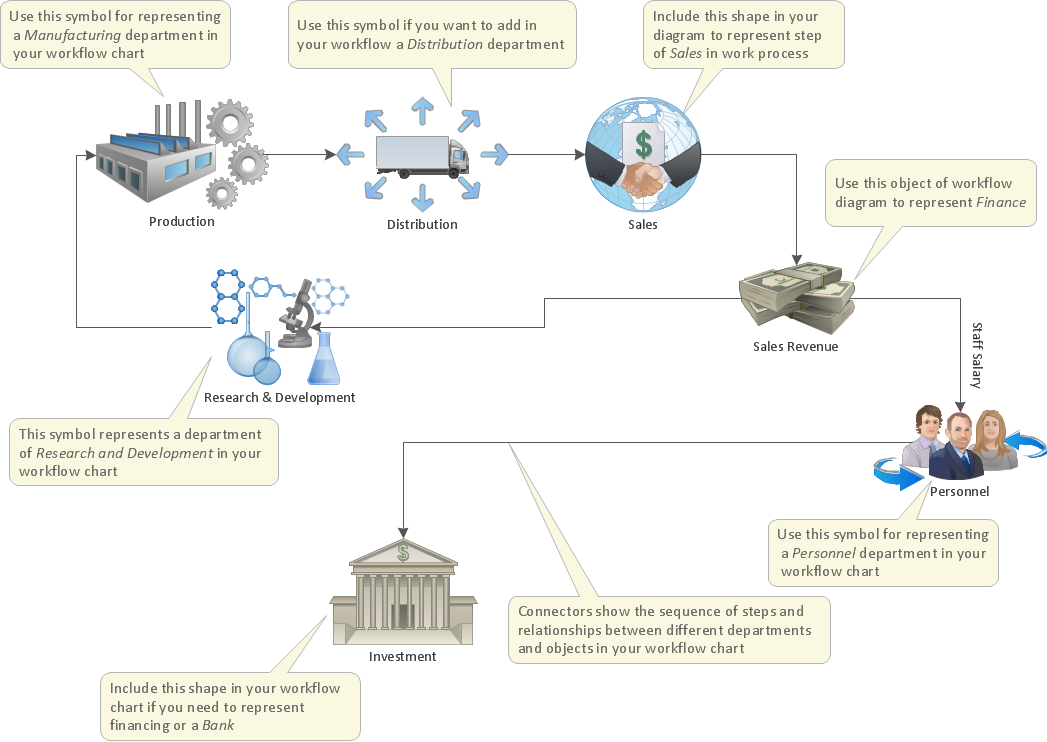
While creating your Flowchart using ConceptDraw DIAGRAM software and Flowcharts solution, we recommend you take into consideration and use the following objects:
- rectangle or box (the most often used symbol) to represent an activity or a step;
- rounded box or oval, usually containing the word "Start" or "End";
- diamond to represent the decision point and usually involving the branching Yes/No;
- circle to represent the point of connection the Flowchart to another process;
- parallelogram to represent the Input/Output.
Knowing and noting this information will help you to plan your drawings in advance and so to have the final result looking truly smart and professional.
")
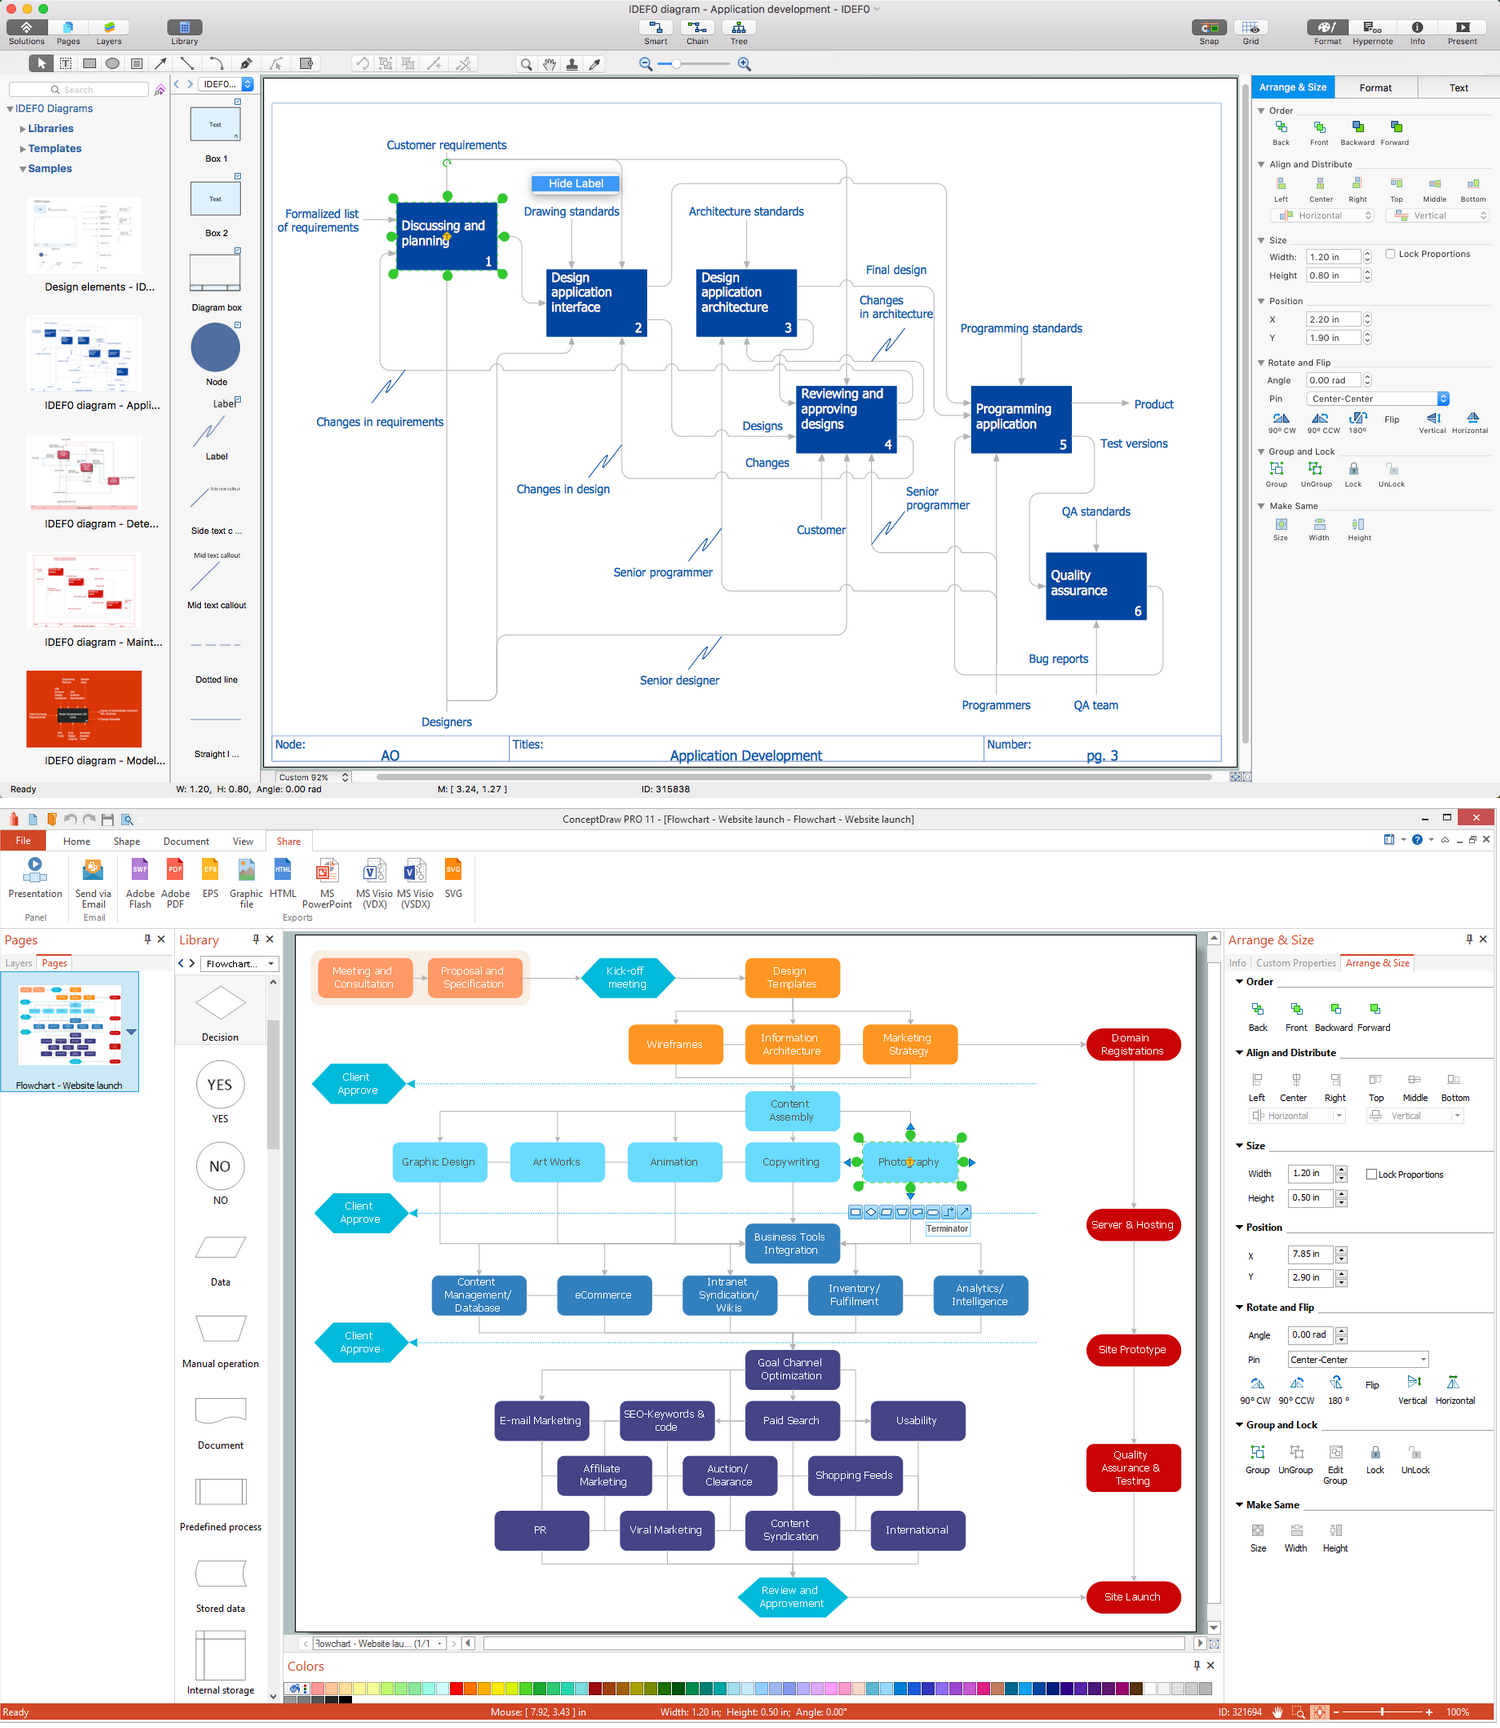
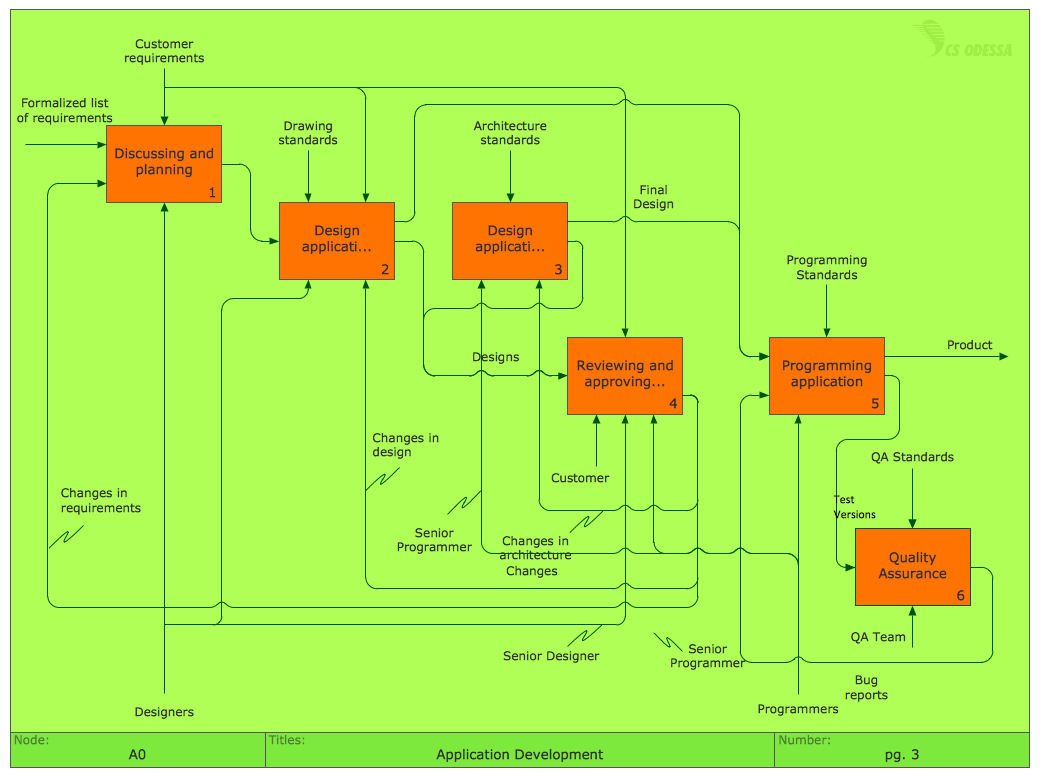
Example 1. Professional Flowchart Maker ConceptDraw DIAGRAM
Apple macOS™ and Microsoft Windows™
Software Tools for Creating Flowcharts
If you are facing difficulty in creating Flowcharts or a workflow is slowing you down, then consider using flowchart program with pre-drawn flowchart symbols to enhance your productivity and speed. ConceptDraw DIAGRAM is a professional flowchart software and feature-rich flowchart maker software, being enhanced with Flowcharts solution with professional flowchart objects, free examples and templates that allow you to simply make a Flow diagram and make it professional-looking.
ConceptDraw DIAGRAM assists you in drawing your Flow charts with minimal effort and makes it very easy for beginners to draw professional-looking Flowcharts. It includes suitable connectors and styles or designs to ease the process of creating complex Flowcharts. Free flowchart templates, vector stencils, and examples will help to make Flowchart, Workflows, NS Diagram, BPMN Diagram, Cross-functional flowcharts, Data Flow Diagrams, Highlight flowcharts, and other new Flowcharts quickly. Numerous colors, fonts, shapes, styles, and symbols for each object in your Flowchart are available to create your own templates that can be saved for future use. Then drawing does not need to start anew.
|
Cross-Platform Compatibility |
|
Free flowchart examples, shapes and templates |
|
Free technical support |
Flowchart Design Best Practices
Having a huge variety of samples and templates for making your unique great-looking Flowcharts, any type, size, color, and shape, seems to be a good thing to get. Planning a new project, representing some algorithm or some process, illustrating a solution to a given problem, representing process operations, analyzing, designing, documenting, and managing a process in various fields is always better to do in a way of Flowchart. The types of flowcharts and diagrams are numerous, and Flowcharts meaning is wide.
Define and document basic work and data flows, financial, production, and quality management processes to increase the efficiency of your business with the help of ConceptDraw DIAGRAM app for drawing Flowchart. It contains libraries and templates for Audit flowcharts, Data Flow Diagrams, Cause & Effect diagrams, Cross-functional flowcharts, and more. And making any needed Flowchart is always possible in a very short period of time as long as you have all the needed libraries full of stencil elements in order to make the final result looking smart, professional, sophisticated, and unique.
 |
 |
 |
| Basic Flowchart | Workflow Diagram | Process Flowchart |
Steps to Create a Flowchart Quickly and Easily
ConceptDraw DIAGRAM is a professional flowchart creator and feature-rich diagram flowt maker, that supports Mac OS X and Windows. A rich set of stencils and professional flowchart symbols for design from ConceptDraw Solution Park allow the simple creating professional-looking Flowcharts based on thousand free flowchart templates, colored symbols, and examples.
Just drag the ready-made shapes from the library pane and drop them on your page. Done. Drawing couldn't be easier than with this the best tool for flowchart.
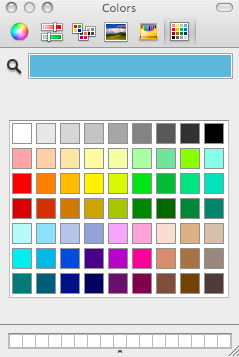
Once you have the basic Flowchart complete, it's time to change the theme effect to everything. Here are a few shots of what you can do. This is the different colors you can make the shapes.
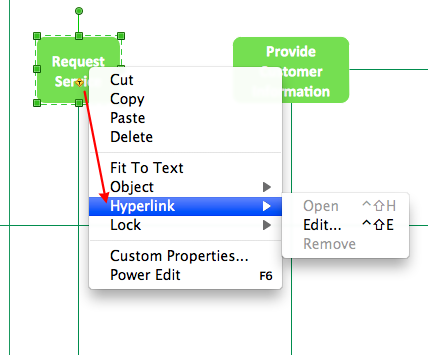
You do not need to be a graphic design expert to insert professional-looking content. Another feature is inserting hyperlinks and defining data. This allows you to navigate the Flowchart easier.
A good way to help the Flowchart stand out better is to change the background of the document and insert a clipart. There are some simple flowchart examples made with the steps and different options shown above.
ConceptDraw DIAGRAM Flowchart Software Features
- ConceptDraw DIAGRAM is a vector-based flowcharting software, which facilitates the rapid creation of flowcharts, workflows, process flowcharts, and more.
- ConceptDraw DIAGRAM is a 3 times cheaper alternative to MS Visio available for both Mac and PC. This full-featured business and technical diagramming application can take care of Visio files within OS X easily.
- ConceptDraw DIAGRAM is cross-platform. Due to this bonus, you can work on a document in both Mac OS X and Windows, skipping Visio entirely.
- ConceptDraw DIAGRAM is easy to learn and easy to use. Create your professional diagrams with minimal effort and time.
- Powerful functions and no artistic skill required: what you see is what you get.
- Predesigned libraries of vector shapes.
- Connecting with smart connection lines that maintain flow and relationships easily.
- Rich pre-drawn templates: basic Flowcharts, Organizational charts, Business charts, HR diagrams, Work flowcharts, Programming flowcharts, Process flowcharts, Network design diagrams, etc.
- The storehouse of typical examples to collect and manage various kinds of works of excellence.
- Beautiful style. Provides abundant arrows, line styles, gradient fills, and textures for each object. Predefined color schemes and styles give you more creativity. Automatically aligns and arranges everything to look great.
- Easy work with other programs. Import to Word, Excel, equation files with a single button-click, or inserting your ConceptDraw charts into other documents in just seconds.
- Save in many common graphic formats and print exactly what you see. Enhanced export features include BMP, JPEG, PDF, SVG, HTML, XML, Multiply TIFF, and SlideShow.
- Live update: you will be notified when a new version or new templates are available for download. You can download the new version directly from ConceptDraw STORE.
Conclusion
Once you need to create Flowchart, such as a basic Flowchart, Cross functional flowchart, Business process flowchart, IDEF flowchart, Workflow flowchart or diagram, as well as Data Flow Diagram, SDL diagram or any other charts, flowcharts, schemes, diagrams or plans, then ConceptDraw DIAGRAM is the one, truly unique software, which is for you feel free to download and start using.
Use a variety of drawing tools, smart connectors, and shape libraries to create Flowcharts of easy or complex processes, procedures, and information exchange. Representing your company's structure and detailed staff information as a single or multi-page Org chart, supporting multi-page documents allows to create very complex and detailed charts, connected with hyperlinks, which can be then exported to HTML for use on the corporate Website, or in PowerPoint Presentation for presenting to colleagues. Network diagrams, building plans, business presentations, and other diagrams can be also created with ConceptDraw flowchart software.
All of this is possible in short terms in case you are well prepared for this fun process of creating something special using the special application. Create professional-looking Flowcharts, Block diagrams, and Data Flow Diagrams, and share them with colleagues immediately!

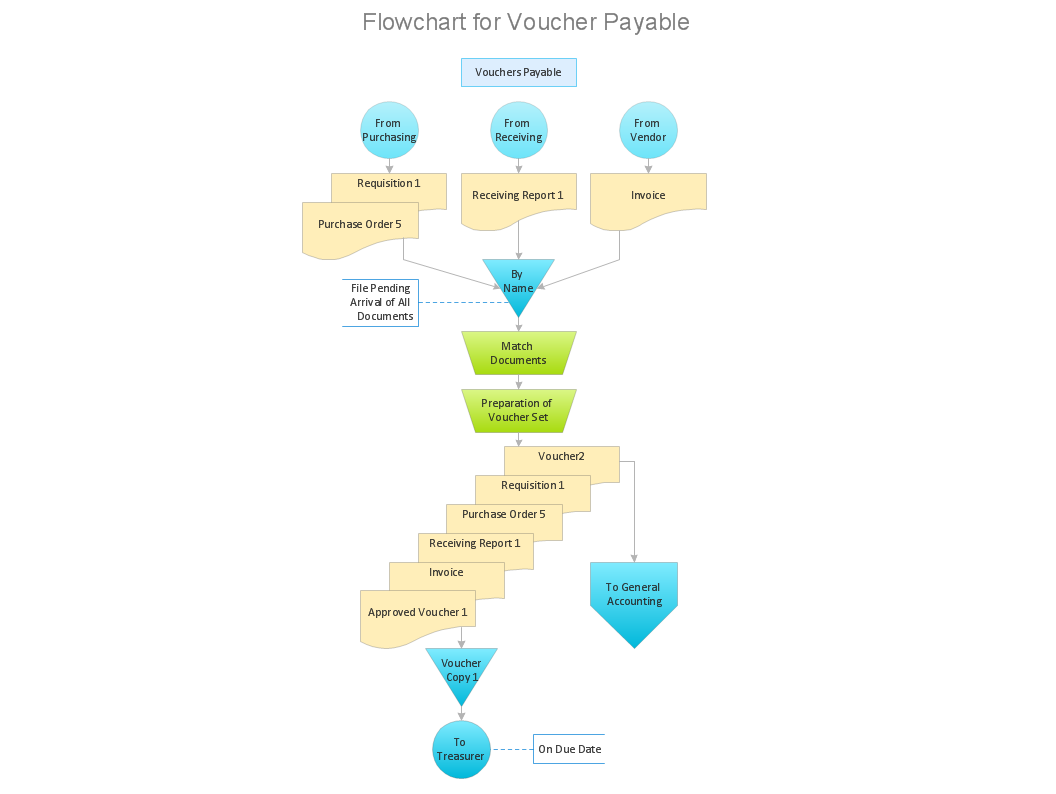
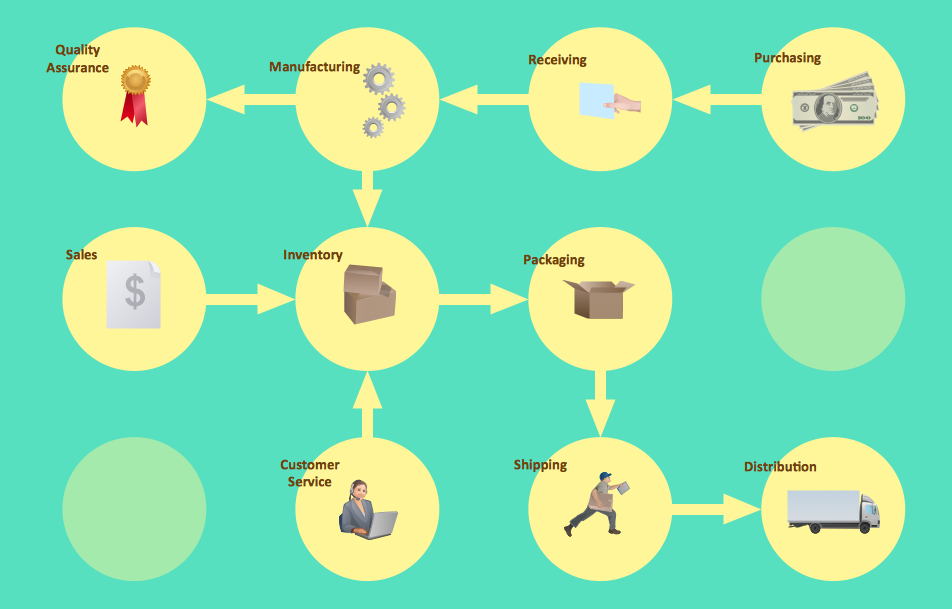
Example 2. Process Flowcharts
No Other Flowchart Software Gives You All This
Design and document using a wide range of pre-drawn flowchart shapes and smart connectors.
Great value for the money, only $199 dollars.
Free technology support.
Free examples and built-in templates to help you draw flowcharts rapidly.