What Is a Flowchart? Definition, Symbols, Examples and How to Create One
A flowchart is a diagram that represents a process, workflow, or algorithm using standardized symbols connected by arrows.
In short: A flowchart shows how a process works step by step.
- Shows process steps and actions
- Uses standardized diagram symbols
- Represents decision logic visually
- Helps analyze and improve workflows
This guide explains what a flowchart is, how it works, and how to use it in real processes.
On this page: definition, symbols, examples, benefits, applications, creation steps, best practices, common mistakes, diagram types, comparisons, history, standards, tools, related guides, and FAQ.
Why it matters: These diagrams help teams document procedures, clarify decision paths, standardize workflow logic, and improve communication across operational and technical processes.
View full-size flowchart example
This visual illustrates the core structure of a flowchart, including sequential steps, directional arrows, and a decision point that changes the execution path.
What Is a Flowchart?
A flowchart is a structured process diagram used to visualize workflows, algorithms, and decision logic step by step. It helps teams document procedures, clarify execution paths, and improve communication.
Flowcharts are widely used in business analysis, system documentation, process modeling, and algorithm design.
They are commonly used alongside workflow diagrams and process maps to document operational logic in different ways.
To understand how flowcharts work in practice, the next step is to examine the standard symbols used to build them.
This page provides a broad overview of flowcharts, while related guides cover symbols, detailed examples, design principles, and software in more depth.
Key Flowchart Symbols
Flowcharts rely on standardized symbols that represent actions, decisions, inputs, outputs, and connectors within a process. Consistent symbol usage makes a flowchart easier to read, review, and maintain.
- Process — shows an action or task.
- Start/End — marks the beginning or end of a process.
- Decision — shows a branching point in the logic.
- Input/Output — represents data entry, output, or interaction.
- Connector — links parts of a diagram for continuity.
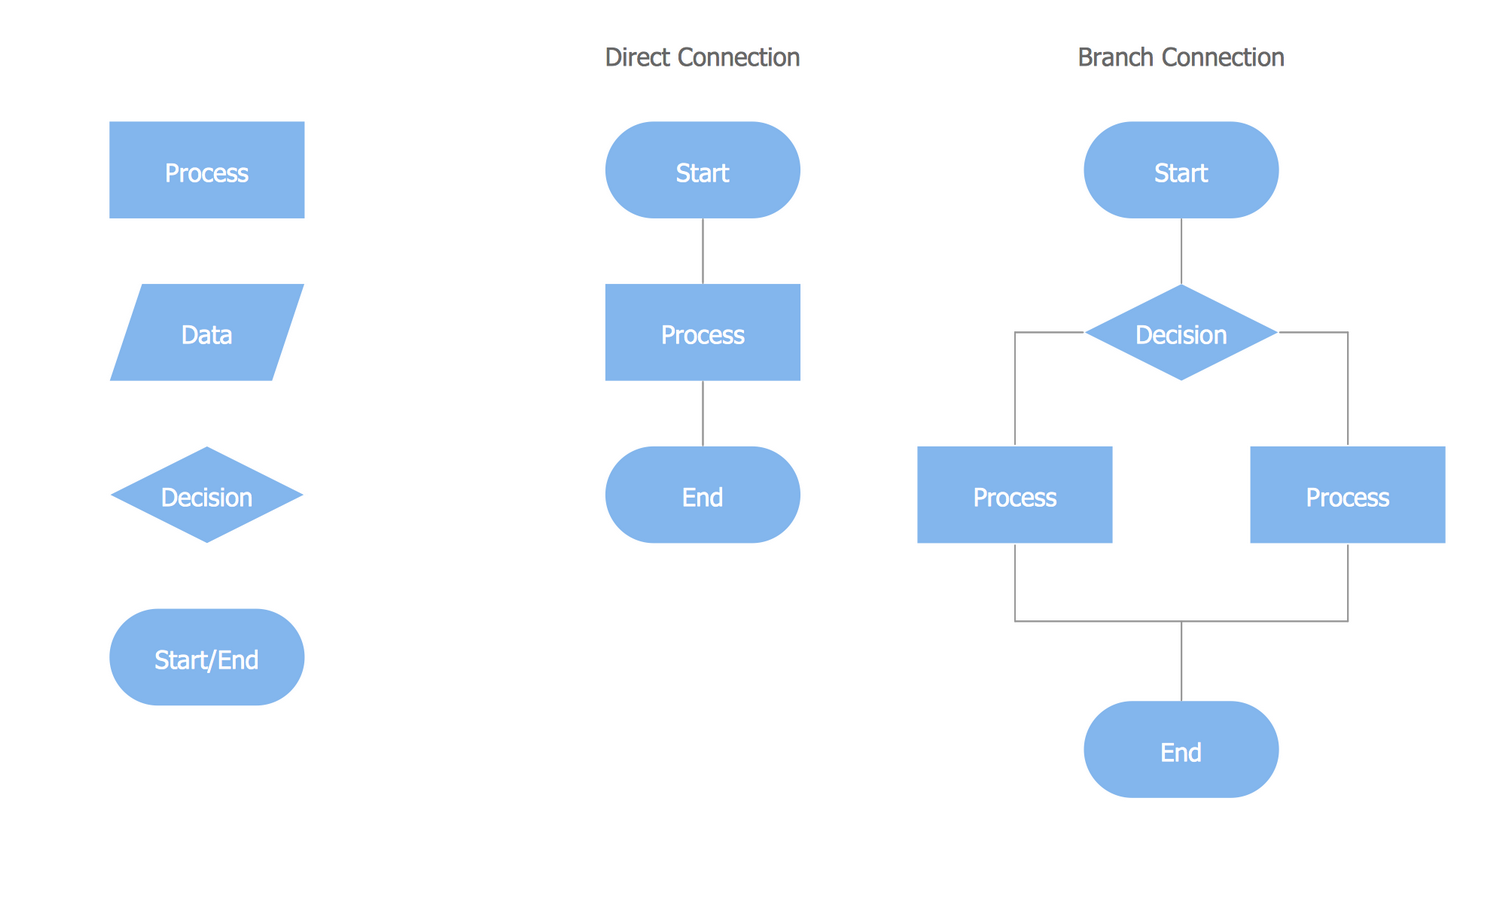
View full-size flowchart symbol overview
This visual shows the standard symbol set used to build clear process diagrams and interpret flowchart structure consistently.
For full symbol meanings, usage rules, and examples, see the flowchart symbols guide.
More advanced flowcharts may also include predefined process, document, database, and delay symbols, especially in complex system diagrams and enterprise workflows.
For most business and operational diagrams, however, a compact symbol set is enough: start/end, process, decision, input/output, and connectors.
Once the basic symbols are clear, the next step is to see how they work together in real process diagrams.
Flowchart Diagram Examples
Each example below highlights a different use case: simple step sequencing, business workflows, advanced branching, and cross-functional responsibility mapping.
Simple Process Flowchart
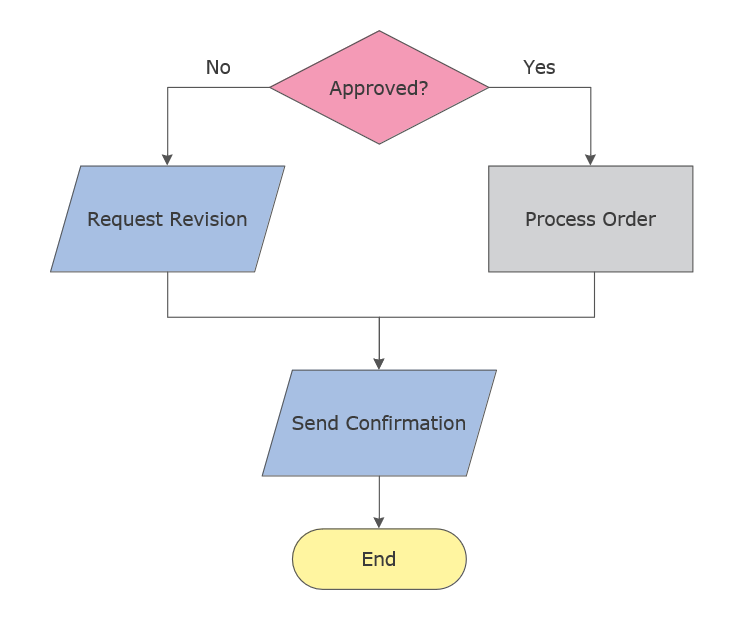
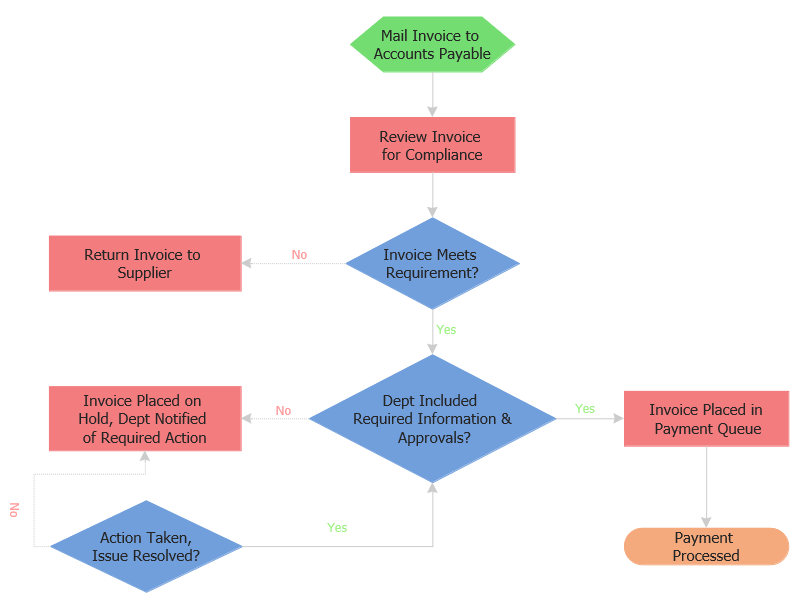
Use case: A basic operational process showing step sequence and decision branching.
View full-size simple process flowchart
This example demonstrates the basic logic of a flowchart using a clear sequence, directional arrows, and a simple branching point.
Business Process Flowchart
Use case: Used for operational efficiency analysis and cross-department coordination.
View full-size business process flowchart
This visual illustrates how a flowchart can be used to organize a larger operational process with multiple steps and coordination points.
Advanced Operational Flowchart
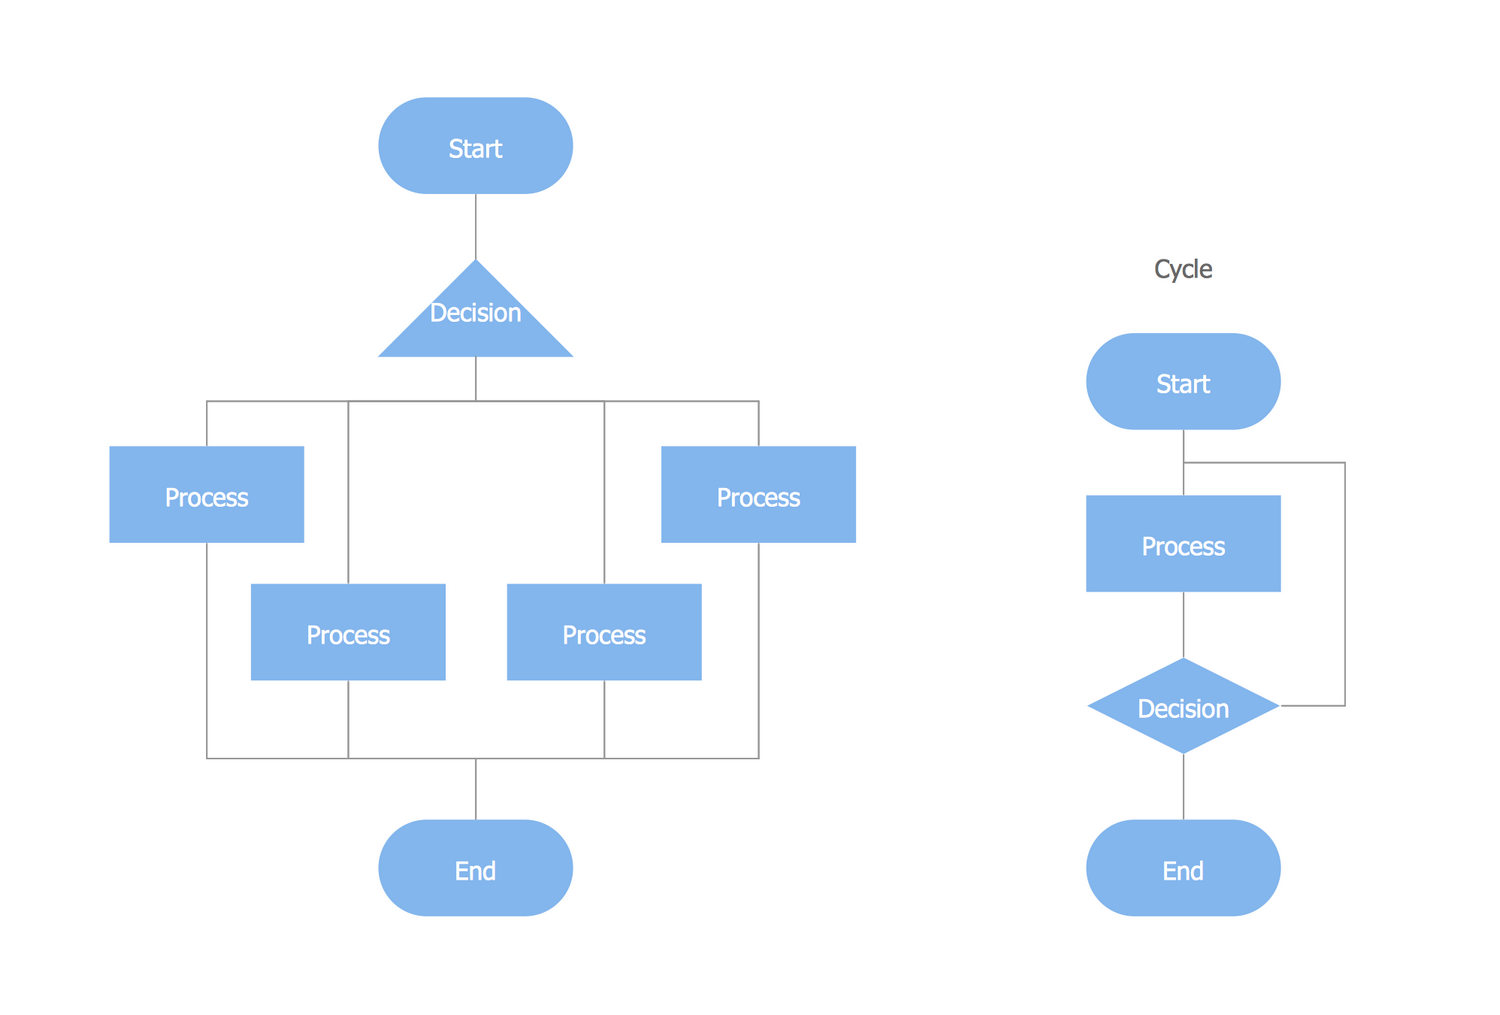
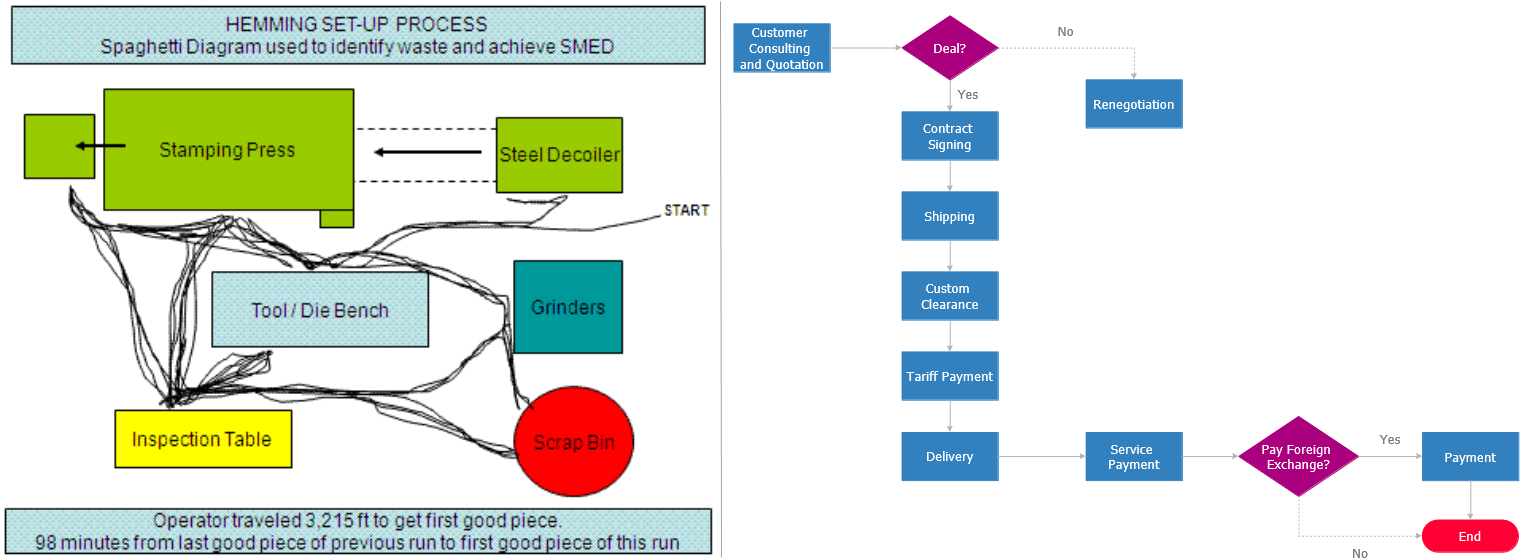
Use case: Illustrates multi-level decision paths and structured execution flow.
View full-size advanced operational flowchart
This example shows how flowcharts scale to more complex processes that require multiple branches, conditions, and decision-driven paths.
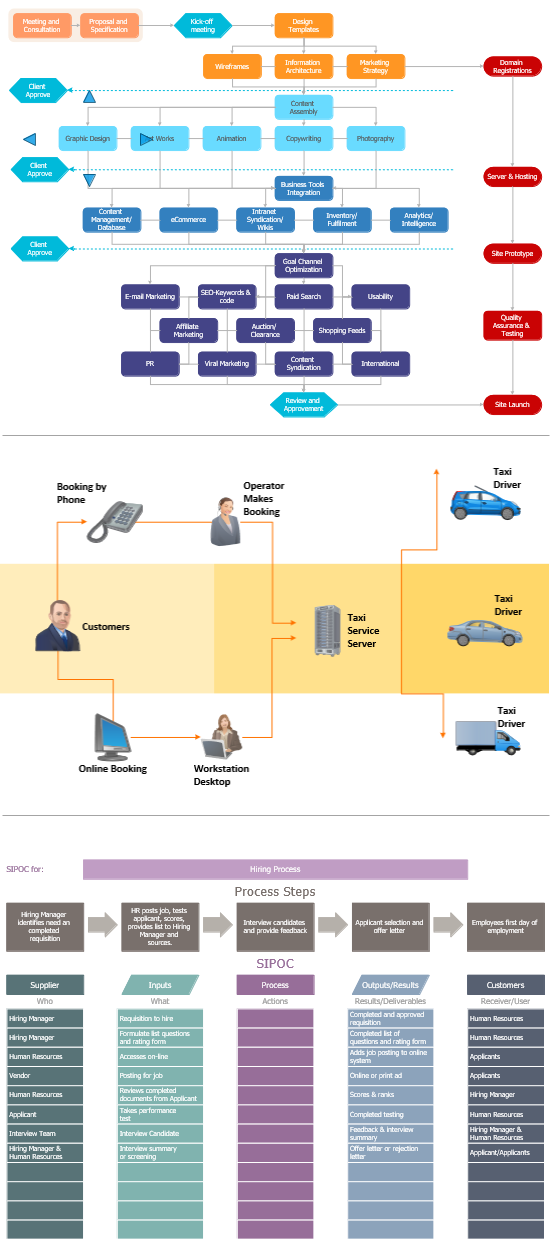
Swimlane Flowchart
Use case: Highlights responsibility distribution across roles or departments.
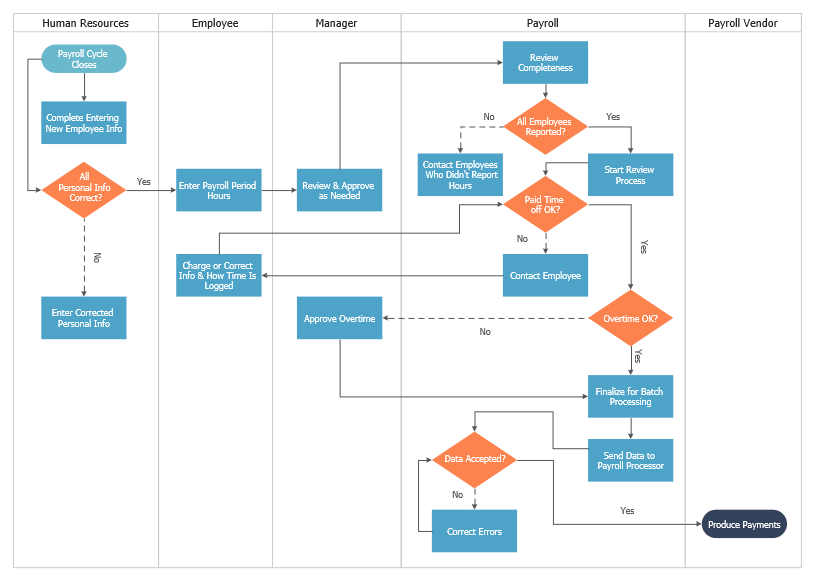
View full-size swimlane flowchart
This visual demonstrates how swimlane flowcharts separate responsibilities by participant, role, or department within the same workflow.
These examples provide a high-level view of how flowcharts are used in different situations, from simple task flows to structured business operations.
For more detailed use cases and additional diagram samples, see our Flowchart Examples guide.
Benefits of Using Flowcharts
Flowcharts are valuable because they simplify complex processes, improve process visualization, make decision paths easier to follow, and enhance communication across teams working with structured workflows.
- Improved operational efficiency
- Clear system documentation
- Decision visibility and control flow transparency
- Standardized SOP design
- Process optimization and audit readiness
They make workflows easier to communicate, analyze, standardize, and improve over time.
Because of this, flowcharts are widely used in environments that depend on structured workflows and repeatable procedures.
Applications Across Industries
Flowcharts support business process modeling, system architecture documentation, internal audit workflows, manufacturing procedures, software logic design, and other forms of structured process visualization and control flow analysis.
Flowcharts in Business Operations
Used for SOP documentation, compliance mapping, approval workflows, and audit preparation.
Flowcharts in Software Development
Used for algorithm design, logic structuring, and system modeling.
Flowcharts in Manufacturing
Support quality control workflows, repeatable production procedures, and process optimization.
They are particularly effective for workflow optimization, compliance process documentation, operational analysis, and structured decision-making.
Understanding where flowcharts are applied is only the first step. The next step is learning how to create a clear and effective diagram.
How to Create a Flowchart
Most process diagrams can be created in a few clear steps.
- Define process scope
- Identify execution steps
- Map decision logic
- Select standardized symbols
- Arrange using logical control flow
- Review for clarity and optimization
In more advanced diagrams, additional considerations include handling loops, managing parallel processes, labeling decision branches clearly, and ensuring that all paths lead to a defined end point.
This structured approach ensures scalable process design and clear execution logic.
Download a Free Flowchart Template
Use this ready-to-use template to quickly map processes and decision logic.
Download Flowchart Template (PDF)
Includes a structured example, blank template, checklist, and related flowchart resources.
Professional diagramming software simplifies scalable process mapping.
Creating a flowchart is only the first step. To make the diagram effective in practice, the layout, alignment, and visual hierarchy must also support readability.
Best Practices for Designing Flowcharts
- Maintain consistent notation standards
- Minimize crossing lines
- Use structured layout alignment
- Keep decision branches concise
- Follow a consistent top-to-bottom or left-to-right reading direction
Core flowchart rules: keep one clear start point, label decision branches explicitly, avoid unnecessary line crossings, use consistent symbols throughout the page, and ensure that each path leads to a defined outcome.
These flowchart rules improve readability, reduce ambiguity, and make process diagrams easier to review, share, and maintain over time.
In practice, these rules act as basic flowchart conventions for keeping diagrams readable, consistent, and easy to interpret across teams.
View full-size flowchart best-practice comparison
This visual highlights how layout, alignment, and clear reading direction improve the readability of a process diagram.
Effective flowcharts maintain visual hierarchy, directional clarity, and consistent flow logic across all steps and decision points.
For complex systems, it is recommended to modularize diagrams into smaller logical segments rather than compressing all steps into a single visual. This improves readability and long-term maintainability.
Pro Tip: Keep each flowchart focused on a single process to maintain clarity and reduce cognitive overload.
For deeper guidance on layout, readability, alignment, and visual structure, see our flowchart design guide.
Following best practices improves readability, but avoiding common structural mistakes is just as important for making a flowchart useful in real working environments.
Common Flowchart Mistakes to Avoid
Even a well-intended diagram can become difficult to read if structure and labeling are inconsistent.
- Overloading diagrams with excessive detail
- Using inconsistent symbol notation
- Creating unclear decision branches
- Ignoring stakeholder readability
- Failing to define clear start and end points
Different flowchart types also influence how diagrams are structured and interpreted in practice, which is why choosing the right format matters as much as avoiding common design mistakes.
Types of Flowcharts
Flowcharts appear in several variations depending on the type of process being documented, the audience, and the level of detail required.
Different types of flowcharts are used depending on whether the goal is to show simple process steps, cross-functional responsibilities, task movement, data flow, or broader workflow structure.
Teams may also distinguish between high-level overview flowcharts and detailed operational flowcharts. The first is useful for quick explanation, while the second is better for analysis, training, and standardization.
Specialized forms such as system flowcharts, document flowcharts, and process flow diagrams are used when a standard process flowchart is not specific enough.
- Process diagram (flowchart) — used to visualize a sequence of operational steps.
- Business process flowchart — used to document workflows and improve coordination.
- Cross-functional (swimlane) flowchart — shows responsibilities across teams or roles.
- Data flow diagram — focuses on data movement rather than process control logic.
- Workflow diagram — emphasizes task progression and handoffs.
Choosing the right type of flowchart depends on the complexity of the process, the number of participants involved, and whether the focus is on decision logic, task movement, or system structure.
Quick rule of thumb: Use a basic process flowchart for step-by-step logic, a swimlane flowchart for ownership, and a data flow diagram when the focus is on how information moves rather than how tasks are performed.
Because flowcharts are often confused with related diagram types, it helps to compare them directly with workflow diagrams and process maps before choosing the best format for a given use case.
When to Use a Flowchart
Flowcharts are most useful when a process has defined steps, decisions, handoffs, or repeatable logic that needs to be documented, explained, or improved clearly.
- Standardizing operational procedures
- Mapping approval paths and decision logic
- Explaining workflows to new team members
- Analyzing bottlenecks and optimization opportunities
They are less useful for highly dynamic systems, open-ended brainstorming, or cases where a simple checklist is enough.
They work especially well for approval flows, standard operating procedures, onboarding processes, algorithm logic, and operational reviews.
Use a flowchart when the goal is to explain process logic, visualize decisions, or standardize repeatable workflows across teams.
Choose a workflow diagram instead when the main priority is task handoff and operational movement. Choose a process map instead when the goal is to show a broader high-level view rather than detailed step-by-step logic.
Avoid using a flowchart when sequence is not the main idea, when relationships matter more than process order, or when a simple checklist explains the work more clearly.
Flowchart vs Workflow vs Process Map
Although these diagrams all visualize processes, they focus on different aspects of how work moves through a system, from decision logic to task movement and broader operational structure.
| Criteria | Flowchart | Workflow Diagram | Process Map |
|---|---|---|---|
| Main Focus | Decision logic and control flow | Task flow and handoffs | High-level process structure |
| Best used when | You need to model decisions, branching logic, or step-by-step execution | You need to show how work moves between people or systems | You need a simplified overview of a process without detailed logic |
| Typical output | Structured process logic with decision paths | Sequence of tasks across roles or systems | Simplified visual map of a process |
| Typical use cases | Algorithms, approvals, system processes | Operations, coordination, task tracking | Process documentation, training, overview diagrams |
| Complexity | Medium to high (depends on decision depth) | Medium (depends on number of participants) | Low to medium (focus on clarity) |
| Quick example | “If approved → continue, else → reject” | “Task moves from sales → finance → support” | “Order → processing → delivery” |
Understanding these distinctions helps organizations choose the right visualization method based on whether they need to model decision logic, task flow, or overall process structure.
View full-size flowchart comparison visual
This comparison helps show when a flowchart is best suited for decision logic and structured process flow rather than broader mapping or task movement alone.
In practice, the right choice depends on whether the main need is decision logic, task movement, or a simplified overview of a broader process.
Brief History
Flowcharts originated in industrial engineering and later became fundamental for algorithm visualization and system documentation in computer science.
Early structured process diagrams were popularized in the early 20th century as organizations looked for clearer ways to document and optimize work. With the rise of computer science, flowcharts became a practical method for representing program logic, decision flow, and system behavior.
Flowchart methods were later formalized through documentation standards and adopted in engineering, business process modeling, software development, and technical documentation.
Today, flowchart notation remains a practical method for modeling workflows, documenting procedures, and explaining decision-driven systems.
Flowchart Standards and Conventions
Flowchart standards and conventions are associated with standardized documentation practices used in engineering, software development, and process analysis. One widely cited reference is ISO 5807, which defines symbols and conventions for data, program, and system flowcharts.
In practice, many business and software teams use a simplified subset of these conventions: start/end symbols, process rectangles, decision diamonds, input/output shapes, and connectors. Using consistent notation improves readability, collaboration, and long-term maintainability.
Even when teams do not apply a formal standard in full, following a stable symbol system helps keep a flowchart easy to interpret across departments and projects.
After understanding structure, symbols, standards, and use cases, the next practical step is choosing the right tool.
Tools and Software
Once a process has been defined clearly, software helps turn it into a clean, editable, and scalable visual diagram.
Why Software Helps When Creating Flowcharts
- Pre-built symbol libraries
- Automatic alignment tools
- Export to PDF, PNG, SVG
- Scalable enterprise workflow modeling
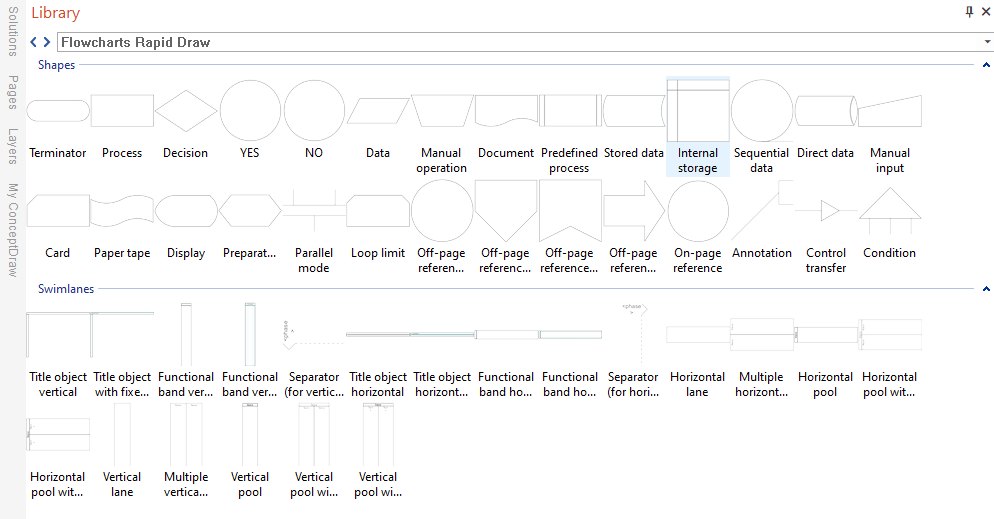
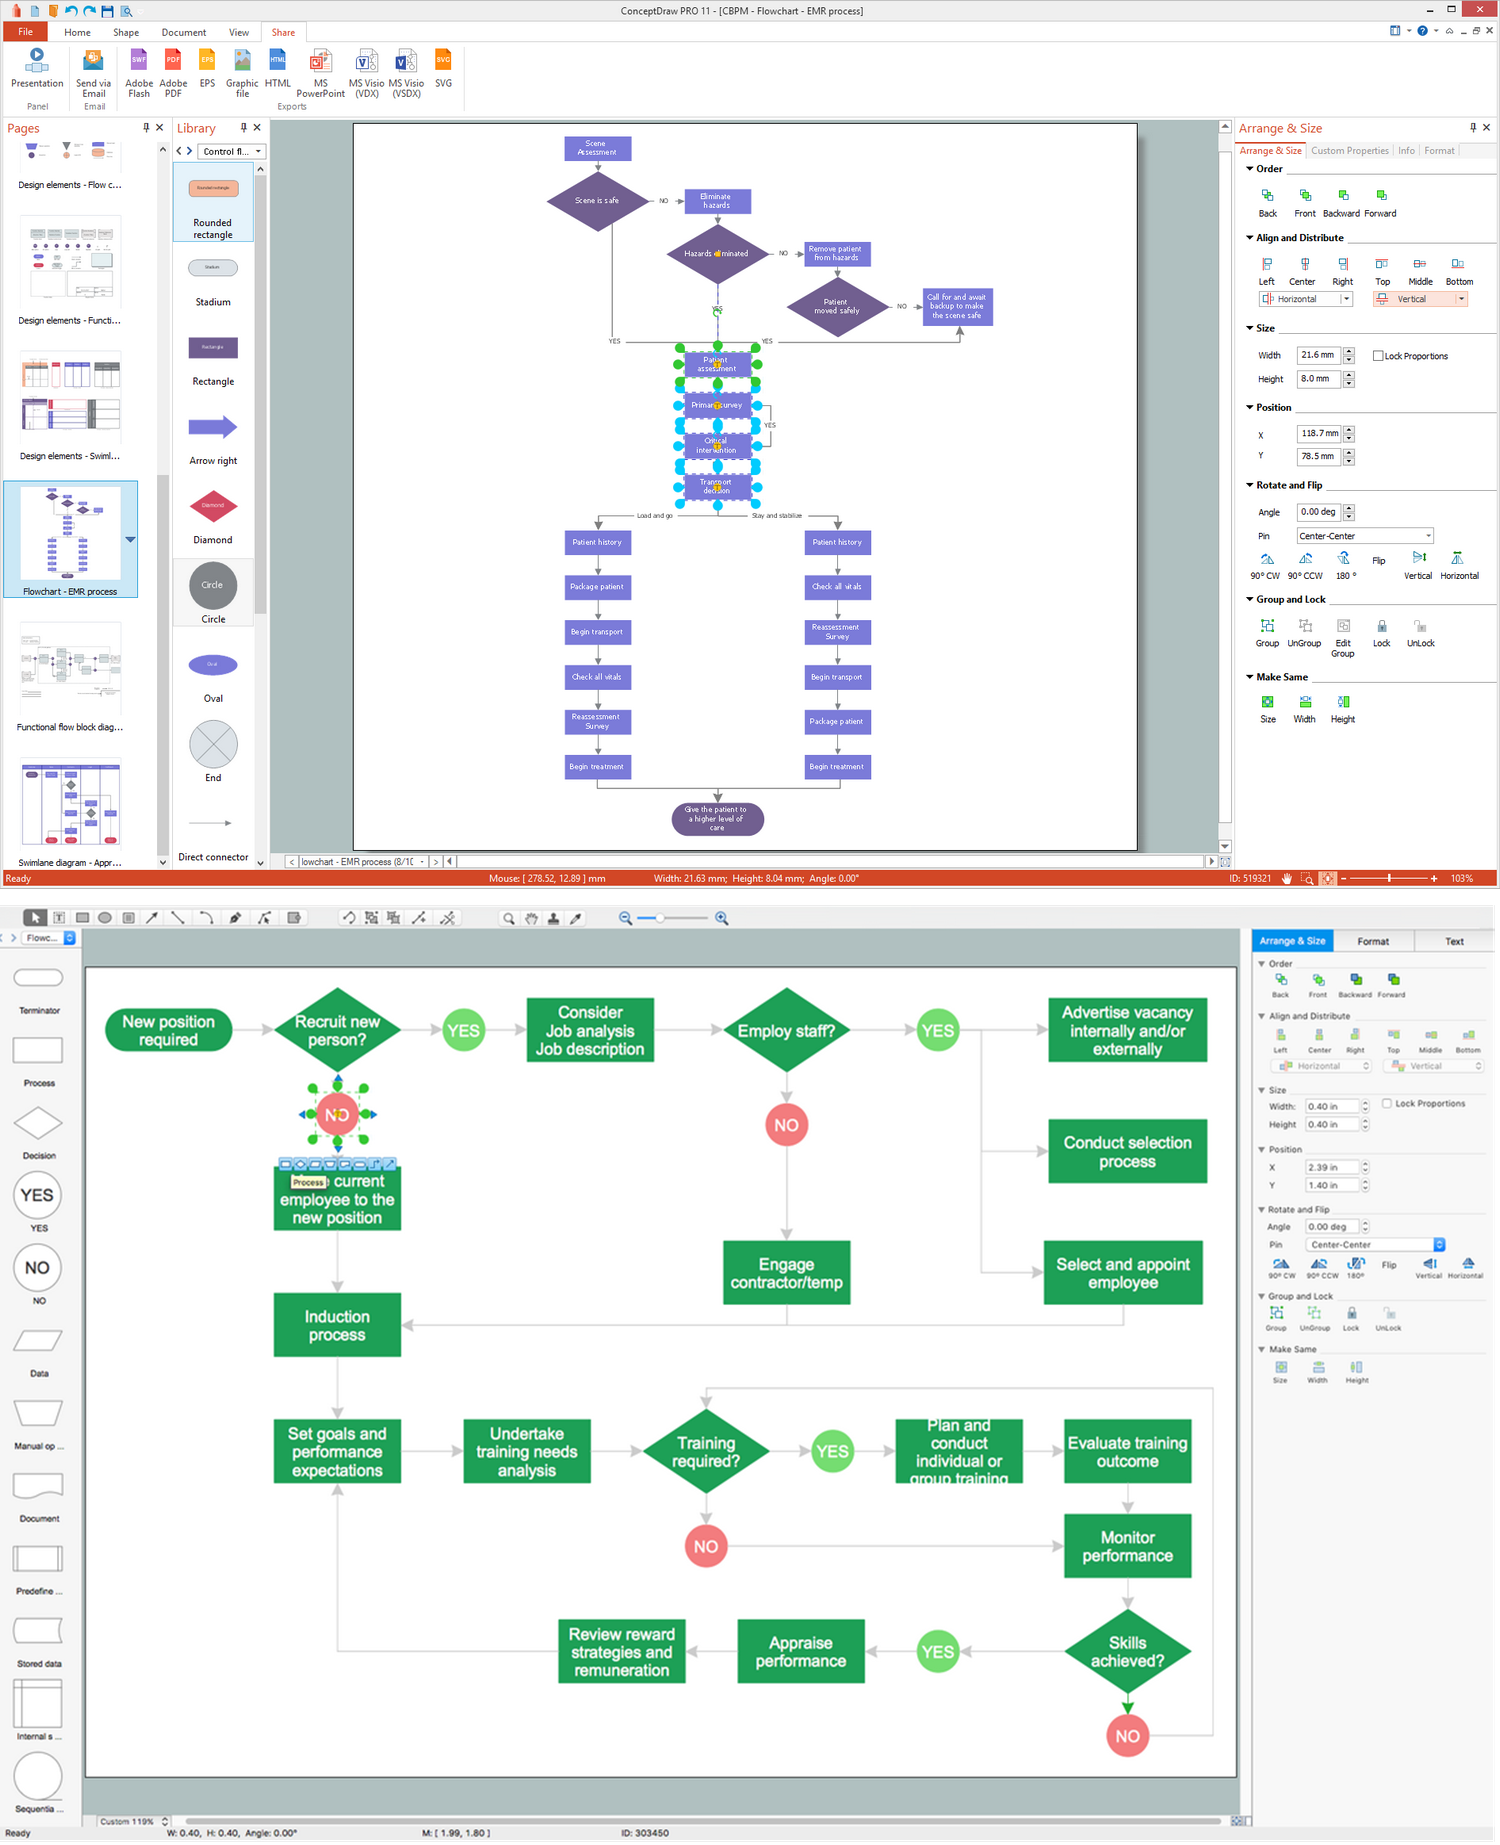
View full-size flowchart symbol library
This visual shows how standard flowchart symbols are organized inside the drawing environment for faster diagram creation.
ConceptDraw DIAGRAM with the Flowcharts Solution supports professional-grade process diagrams and workflow documentation.
For a more detailed overview of features, use cases, and software selection criteria, see our flowchart software guide.
FAQ
For detailed symbol meanings, usage rules, and shape-by-shape explanations, see the flowchart symbols guide.
These answers cover common questions about flowcharts, symbols, terminology, and practical usage.
What is a flowchart?
Answer: A flowchart is a visual process diagram that represents a workflow, procedure, or algorithm using standardized symbols connected by arrows to show the direction of flow.
How do you create a flowchart?
Answer: Define the process steps, choose the correct symbols, arrange them in logical order, and connect them with arrows to show the direction of flow.
What is a process flow diagram?
Answer: A process flow diagram is a type of flowchart used to represent operational processes, task sequences, and decision points in a structured visual form.
What is a swimlane flowchart?
Answer: A swimlane flowchart is a flowchart divided into lanes to show responsibility across roles, teams, or departments.
What makes a good flowchart?
Answer: A good flowchart is clear, logically structured, visually consistent, and easy for the intended audience to follow, with readable labels, consistent symbols, and well-defined start and end points.
What is the difference between a flowchart and a workflow diagram?
Answer: A flowchart focuses on decision logic and process structure, while a workflow diagram focuses more on task movement, handoffs, and operational progression.
When should flowcharts be used?
Answer: Flowcharts should be used when documenting, analyzing, explaining, or improving structured processes that include clear steps, decisions, and repeatable logic.
Are flowcharts still relevant?
Answer: Yes, flowcharts are still widely used in modern business, software engineering, operations, training, and process improvement.
Can flowcharts improve business efficiency?
Answer: Yes, flowcharts can improve business efficiency by helping teams identify bottlenecks, clarify responsibilities, and optimize workflows.
When should you not use a flowchart?
Answer: A flowchart is not the best choice when the process changes constantly, when relationships matter more than sequence, or when a short checklist can explain the task more efficiently.