
Example 1. Microsoft Azure
Azure Architecture Solution provides for ConceptDraw DIAGRAM users incredibly large quantity of predesigned vector design element, icons, symbols, logos for drawing attractive Microsoft Azure illustrations without efforts. All they are represented in 6 libraries.
Azure Architecture Solution offers also variety of predesigned samples and examples, and 5 different templates. Each of these templates provides a perfect base for self-dependent drawing and greatly facilitates drawing process.

Example 3. Microsoft Azure StorSimple Architecture
The samples you see on this page were created in ConceptDraw DIAGRAM using the Azure Architecture Solution for ConceptDraw Solution Park. These Microsoft Azure illustrations successfully demonstrate solution's capabilities and professional results you can achieve. An experienced user spent 15 minutes creating every of these samples.
Use the tools of Azure Architecture Solution for ConceptDraw DIAGRAM software for quick and easy creating your own professional looking illustrations and diagrams designed to document complex Microsoft Azure cloud system.
All source documents are vector graphic documents. They are available for reviewing, modifying, or converting to a variety of formats (PDF file, MS PowerPoint, MS Visio, and many other graphic formats) from the ConceptDraw STORE. The Azure Architecture Solution is available for all ConceptDraw DIAGRAM or later users.
TEN RELATED HOW TO's:
3D Network Diagrams are very popular diagrams in the field of network technologies. They have more visual, clear, attractive and understandable look than 2D. ConceptDraw DIAGRAM gives the opportunity to draw the professional looking 3D Network Diagrams easy, quick and effective.
This example shows the 3D Network Diagram. It was created in ConceptDraw DIAGRAM using the 3D network elements from the Computer and Networks solution from the Computer and Networks area of ConceptDraw Solution Park.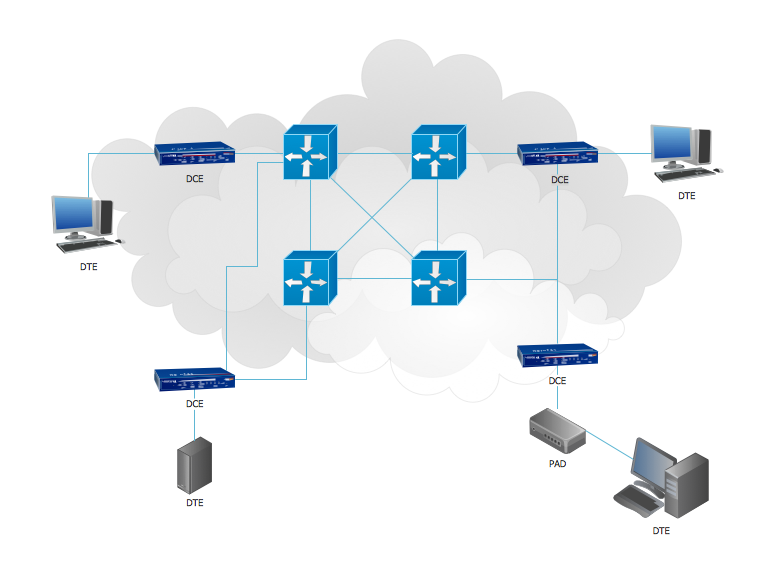
Picture: 3D Network Diagrams. Computer and Network Examples
Related Solution:
Working with disordered network data can be quite exhausting. Sometimes it's necessary to find a network diagramming software to design Cisco network diagrams that would be easy to use and would be able to export diagrams to various graphic formats. ConceptDraw DIAGRAM is a great diagramming tool that is able to perform all these tasks easily.
This vector library represents a set of 26 objects depicting the manufacturer - standard equipment of Cisco switches and hubs. This is only a small part of the vector graphic objects of Cisco equipment that comprise the Cisco Network Diagrams solution. In full the ConceptDraw Cisco Network Diagrams solution has 15 libraries, containing more then 500 objects to create a Cisco network diagrams. They can be used by IT specialists and corporative IT divisions, system and network administrators to make the visual documentation of Cisco networks topology.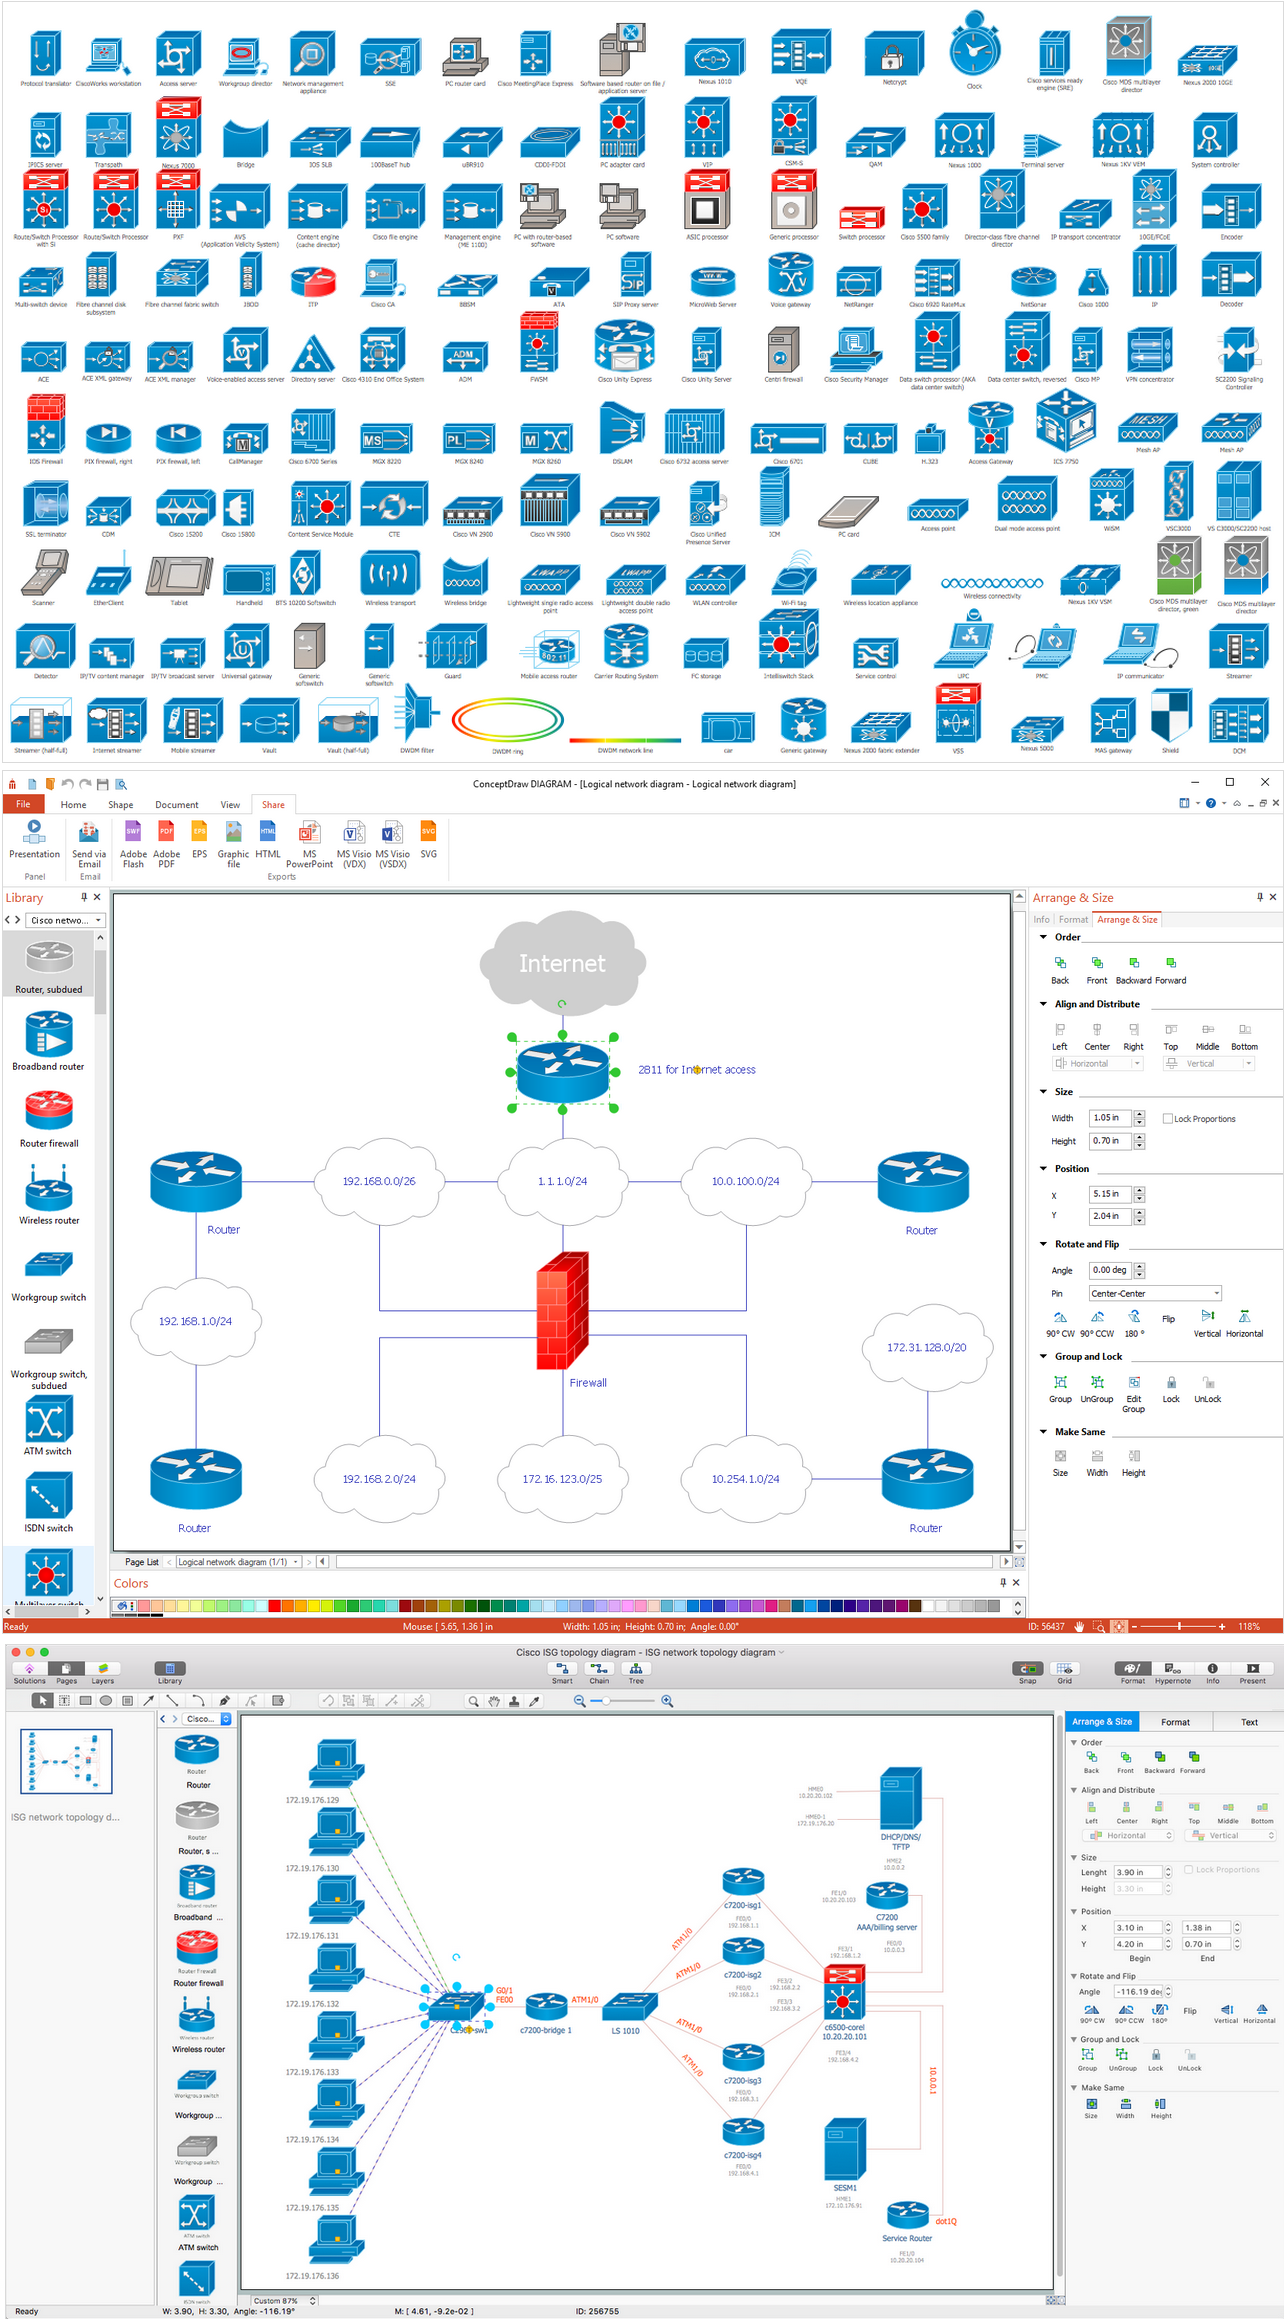
Picture: Network Diagramming Software for Design. Cisco Network Diagrams
Related Solution:
Chemical and Process Engineering solution contains variety predesigned process flow diagram elements relating to instrumentation, containers, piping and distribution necessary for chemical engineering, and can be used to map out chemical processes or easy creating various Chemical and Process Flow Diagrams in ConceptDraw DIAGRAM.
Picture: Process Flow Diagram Symbols
Related Solution:
Storage icons - Amazon AWS pro diagrams - AWS diagrams are part of architecturing tools provided with ConceptDraw Solution Park.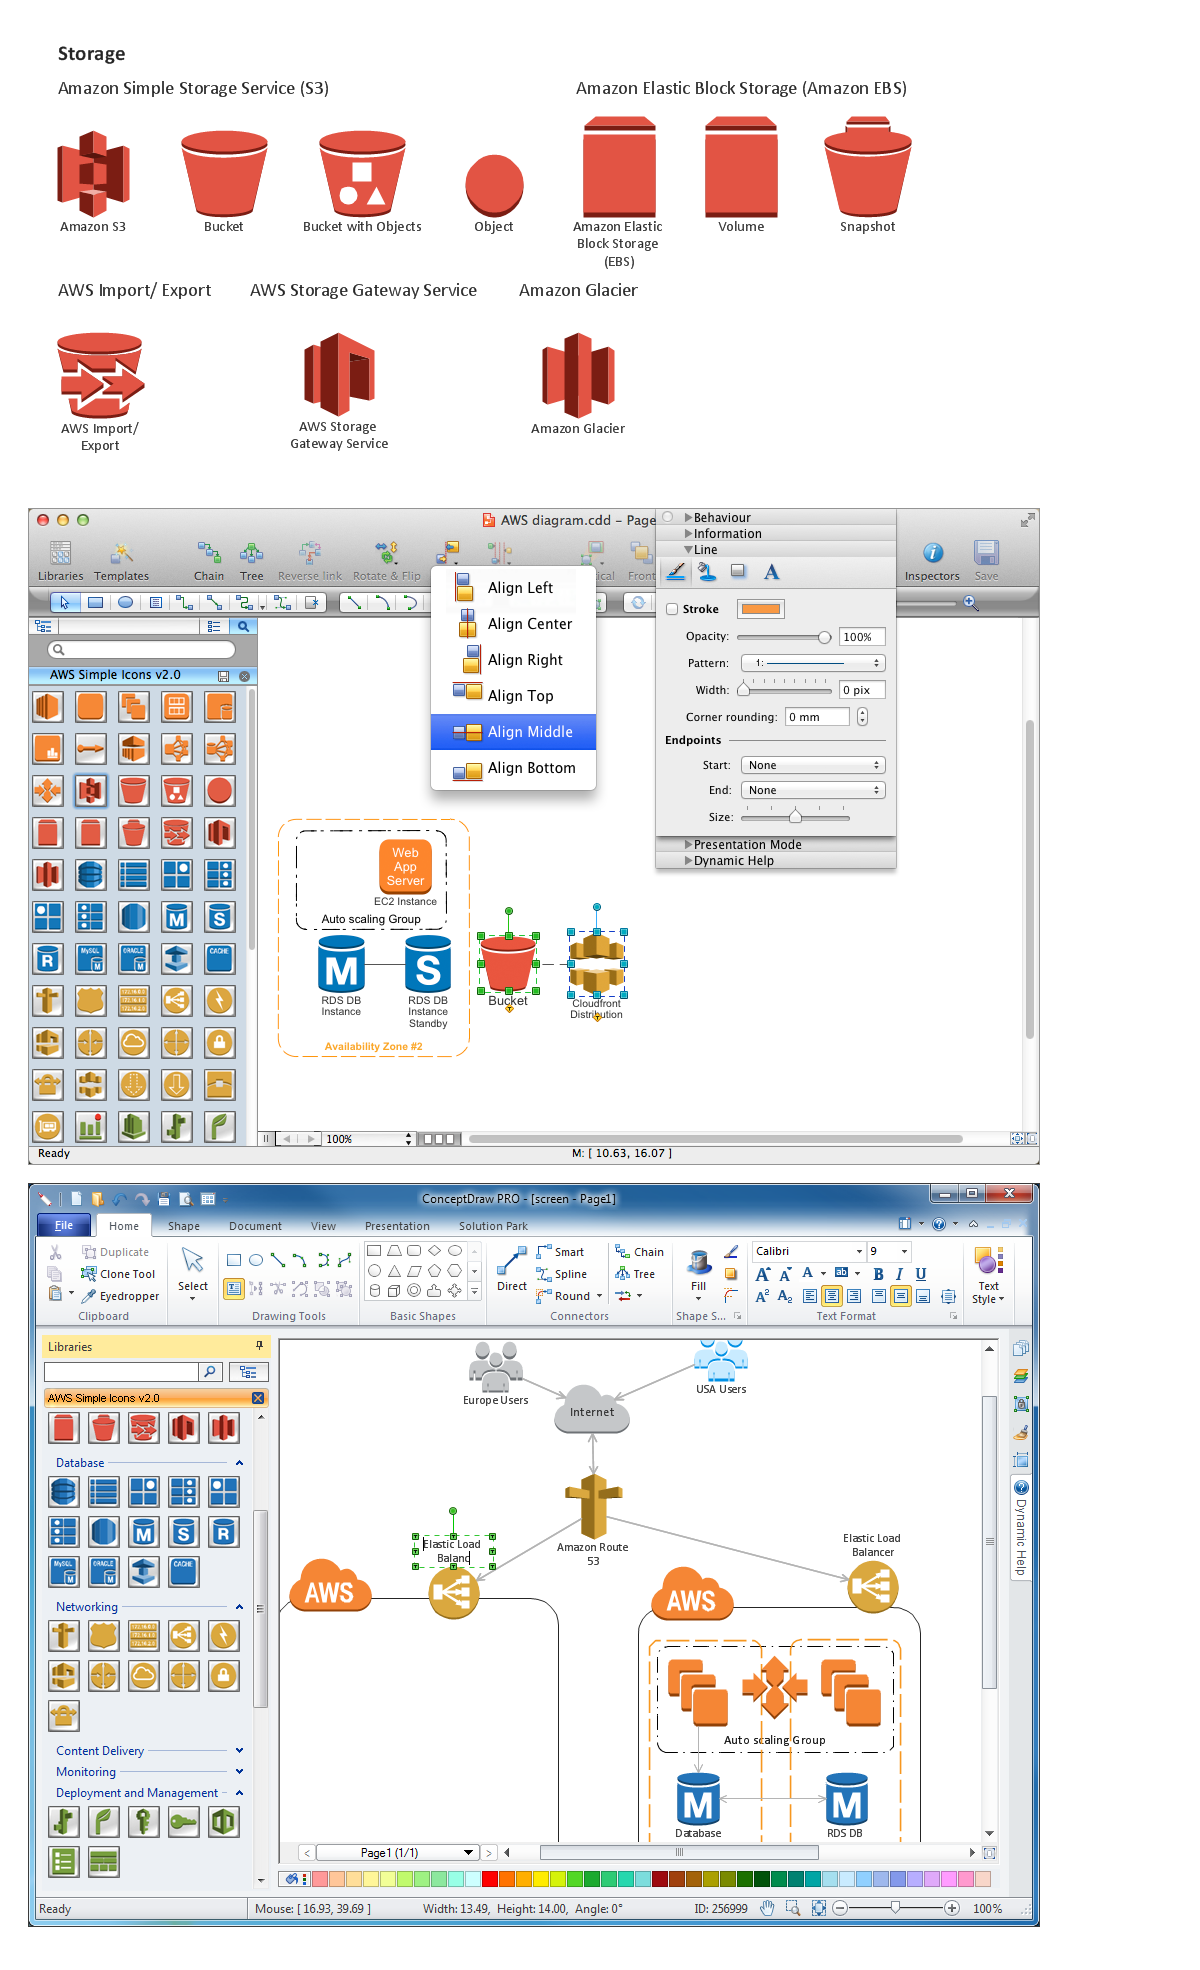
Picture: Diagramming software for Amazon Web Service icon set: Storage
Studying informatics demands knowledge in the area of computer networks as well. The most famous world network, Internet, is an example of wide area network (WAN) topology that connects devices spread on any distance. Unlike other smaller networks that are limited to a building or to a campus, WAN is almost limitless.
This WAN (wide area network) diagram was created in ConceptDraw DIAGRAM. It shows a telecommunication network that covers a large geographical area connecting several settlements. This type of networks is commonly used by business and government institutions. Using the WANs enables them quickly communicate information between remote geographical points. To reproduce this network diagram, you will need the means, provided by ConceptDraw Computer and Network Diagrams solution.
Picture: Wide area network (WAN) topology. Computer and Network Examples
Related Solution:
The purchase or purchasing funnel is a consumer focused marketing model which illustrates the theoretical customer journey towards the purchase of a product or service.
Picture: Pyramid Diagram
Related Solution:
The ConceptDraw DIAGRAM Planogram Software and Retail Plan Software offers powerful tools of Enterprise Architecture Diagrams Solution for visualization the market analysis and easy making successful Retail Plans and Planograms with useful detailed recommendations about placing products and optimization the shelf space.
Picture: Planogram Software and Retail Plan Software
Related Solution:
ConceptDraw DIAGRAM diagramming and vector drawing software extended with Sales Flowcharts solution from the Marketing area of ConceptDraw Solution Park offers the set of extensive tools for quick and easy drawing professional looking Sales Process Flowcharts.
Picture: Sales Process Flowcharts
Related Solution:
How To Make a Floor Plan? Usually drawing of Floor Plans is quite complex and time-taking process. But now thanks to the ConceptDraw DIAGRAM diagramming and vector drawing software extended with Floor Plans Solution from the Building Plans area of ConceptDraw Solution Park this process became quick and simple.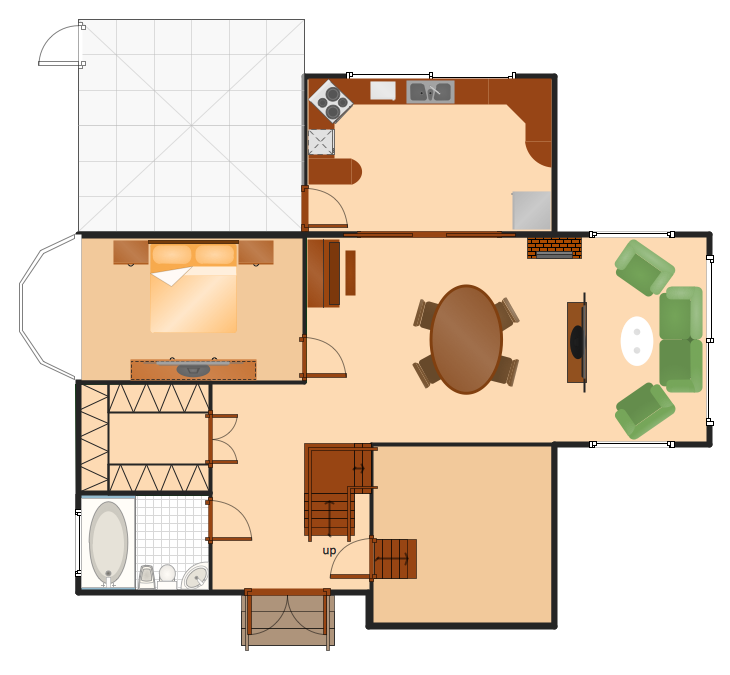
Picture: How To Make a Floor Plan
Related Solution:
Today, we can’t imagine our lives without daily data exchange. To call a set of devices that can be connected with each other a computer network, we must be sure that these devices support appropriate protocols to transfer data. A network consisting of personal devices is private, and global computer networks, for example, Internet, connects network nodes worldwide.
This diagram represents a computer telecommunication network. The network depicted on the current diagram is featured with networked communication devices that provide data exchange through Internet. The network interconnections and connections between Internet nodes are settled using the cable media and wireless media. The nodes are the network workstations (terminals). and host computers. This network diagram was drawn with ConceptDraw DIAGRAM and its Computer and Networks Diagrams solution.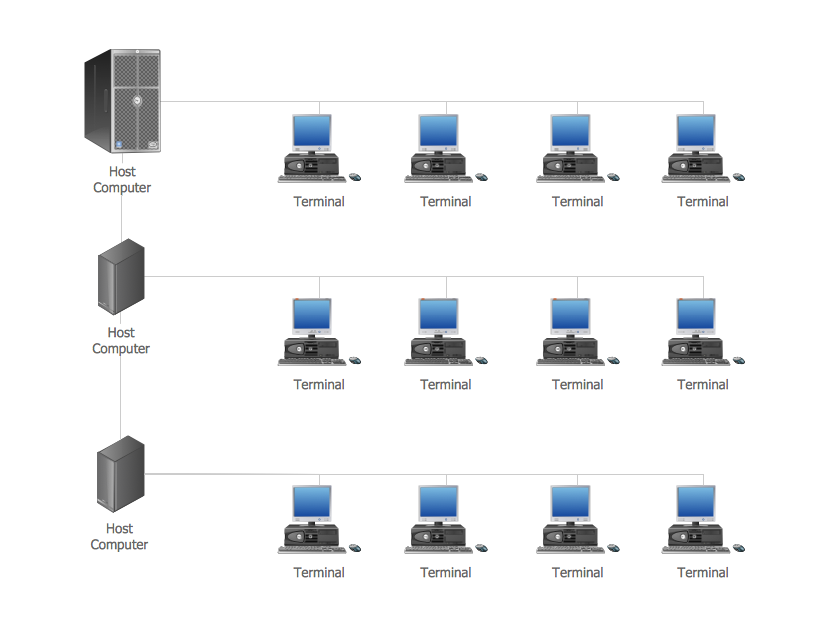
Picture: Computer Network. Computer and Network Examples
Related Solution:


