JSD - Jackson system development
Jackson System Development (JSD) is a linear method of system development created by Michael A. Jackson and John Cameron in the 1980s. It comprises the whole software life cycle directly or providing a framework for more specialized techniques.
The main principles of JSD's work are:
- JSD method lets describe and model the real world, not specifies and not structures the function performed by the system.
- The time-ordered world must be time-ordered itself, JSD depicts the progress in the real world that models it.
- The implementation of the system is based on transformation of specification into efficient set of processes.
Jackson System Development includes three main stages, each of those is divided into steps and sub-steps:
- Modelling stage (analysis) - includes the entity/action step and entity structures step; on this stage is created a set of Entity Structure Diagrams (ESDs) and are identified the entities in the system, the actions, and the attributes of the actions and entities.
- Network stage (design) - contains the initial model step, function step, and system timing step; on this stage is developed a System Specification Diagram (SSD) or a Network Diagram which use rectangles to depict the processes and diamonds to represent their relationships. This stage defines the simulation of a real world, adds the executable operations and processes, and provides the synchronization among processes and introduces the constraints.
- Implementation stage (realization) consists of the implementation step which converts an abstract network model into a physical system and represents it as a System Implementation Diagram (SID).
When implementing the Jackson System Development method and designing JSD diagrams, you can succesfully use the powerful and helpful tools of ConceptDraw DIAGRAM software extended with Entity-Relationship Diagram (ERD) solution from the Software Development area of ConceptDraw Solution Park.

Example 1. JSD in ConceptDraw DIAGRAM software
Entity-Relationship Diagram (ERD) solution offers a lot of predesigned examples, samples and templates, and 2 libraries:
- ERD Chen's Notation library
- ERD Crow’s Foot Notation library
with numerous collection of ready-to-use vector objects for designing diagrams in minutes.

Example 2. Jackson system development - JSD
This sample was created in ConceptDraw DIAGRAM diagramming and vector drawing software using the Entity-Relationship Diagram (ERD) solution from the Software Development area of ConceptDraw Solution Park and shows the Jackson system development (JSD).
Use the predesigned objects, templates and samples of the Entity-Relationship Diagram (ERD) solution for ConceptDraw DIAGRAM to create your own professional ERD and JSD diagrams quick and easy.
All source documents are vector graphic documents. They are available for reviewing, modifying, or converting to a variety of formats (PDF file, MS PowerPoint, MS Visio, and many other graphic formats) from the ConceptDraw STORE. The Entity-Relationship Diagram (ERD) Solution is available for all ConceptDraw DIAGRAM or later users.
TEN RELATED HOW TO's:
Use Case Diagrams describes the functionality provided by a system in terms of actors, their goals represented as use cases, and any dependencies among those use cases.
Picture: Diagramming Software for Design UML Use Case Diagrams
Computer networks nowadays are spread all across the world. The large number of parameters, such as geographic scale or communication protocols, can divide networks. One of the most common types of networks is called local area network (LAN). It convenient to represent network examples by means of diagrams.
This local area network (LAN) diagram provides an easy way to see the way the devices in a local network are interacted. The diagram uses a library containing specific symbols to represent network equipment , media and the end-user devices such as computers (PC, mac, laptop) , network printer, hubs, server and finally a modem. There are two types of network topologies: physical and logical. The current diagram represents precisely a physical type of LAN topology because it refers to the physical layout of a local network equipment.
Picture:
What is a Local Area Network?
Examples of LAN Diagrams
Related Solution:
ConceptDraw DIAGRAM is a powerful tool for drawing business communication ideas and concepts, simple visual presentation of numerical data in the Mac environment.
Picture: Best Multi-Platform Diagram Software
Related Solution:
The ER diagram is constructed from the specific ERD graphic elements. There are used 2 types of ERD notations: Chen and Crow's Foot.
A complete set of work flow shapes, notation & symbols for ERD, entity relationship stencils, included in Entity-Relationship Diagram (ERD) solution for ConceptDraw DIAGRAM software, makes drawing diagrams based on ERD notation as smooth as possible.
Picture: Notation & Symbols for ERD
Related Solution:
You can use many tools to create a representation of a system behavior or a scheme of objects relationships. Some of them are quite abstract and useless, and some, like UML tools help clarifying both the structure and the behavior of a system. There are various types of uml diagrams and tons of examples explaining the difference between them.
UML 2.2 specification has many kinds of diagrams. They are divided into two groups( structure and behavior diagrams). This class diagram shows the hierarchical structure of UML 2.2 specification. Class diagram - the most suitable tool for this task because it is designed to describe basic structure of a system. This diagram can be use as a visual aid for learning UML.
Picture: UML Tool & UML Diagram Examples
Related Solution:
UML Apartment Plan. This sample was created in ConceptDraw DIAGRAM diagramming and vector drawing software using the UML Class Diagram library of the Rapid UML Solution from the Software Development area of ConceptDraw Solution Park.
This sample show the detailed plan of the apartment and is used by building companies, design apartments, real estate agencies, at the buying / selling of the realty.
Picture: UML Class Diagram Example - Apartment Plan
Related Solution:
The Total Quality Management Diagram solution helps your organization visualize business and industrial processes. Create Total Quality Management diagrams for business process with ConceptDraw software.
Picture: Management Tools — Total Quality Management
Related Solution:
Create professional business process diagram with ConceptDraw Activities library with 34 objects from BPMN.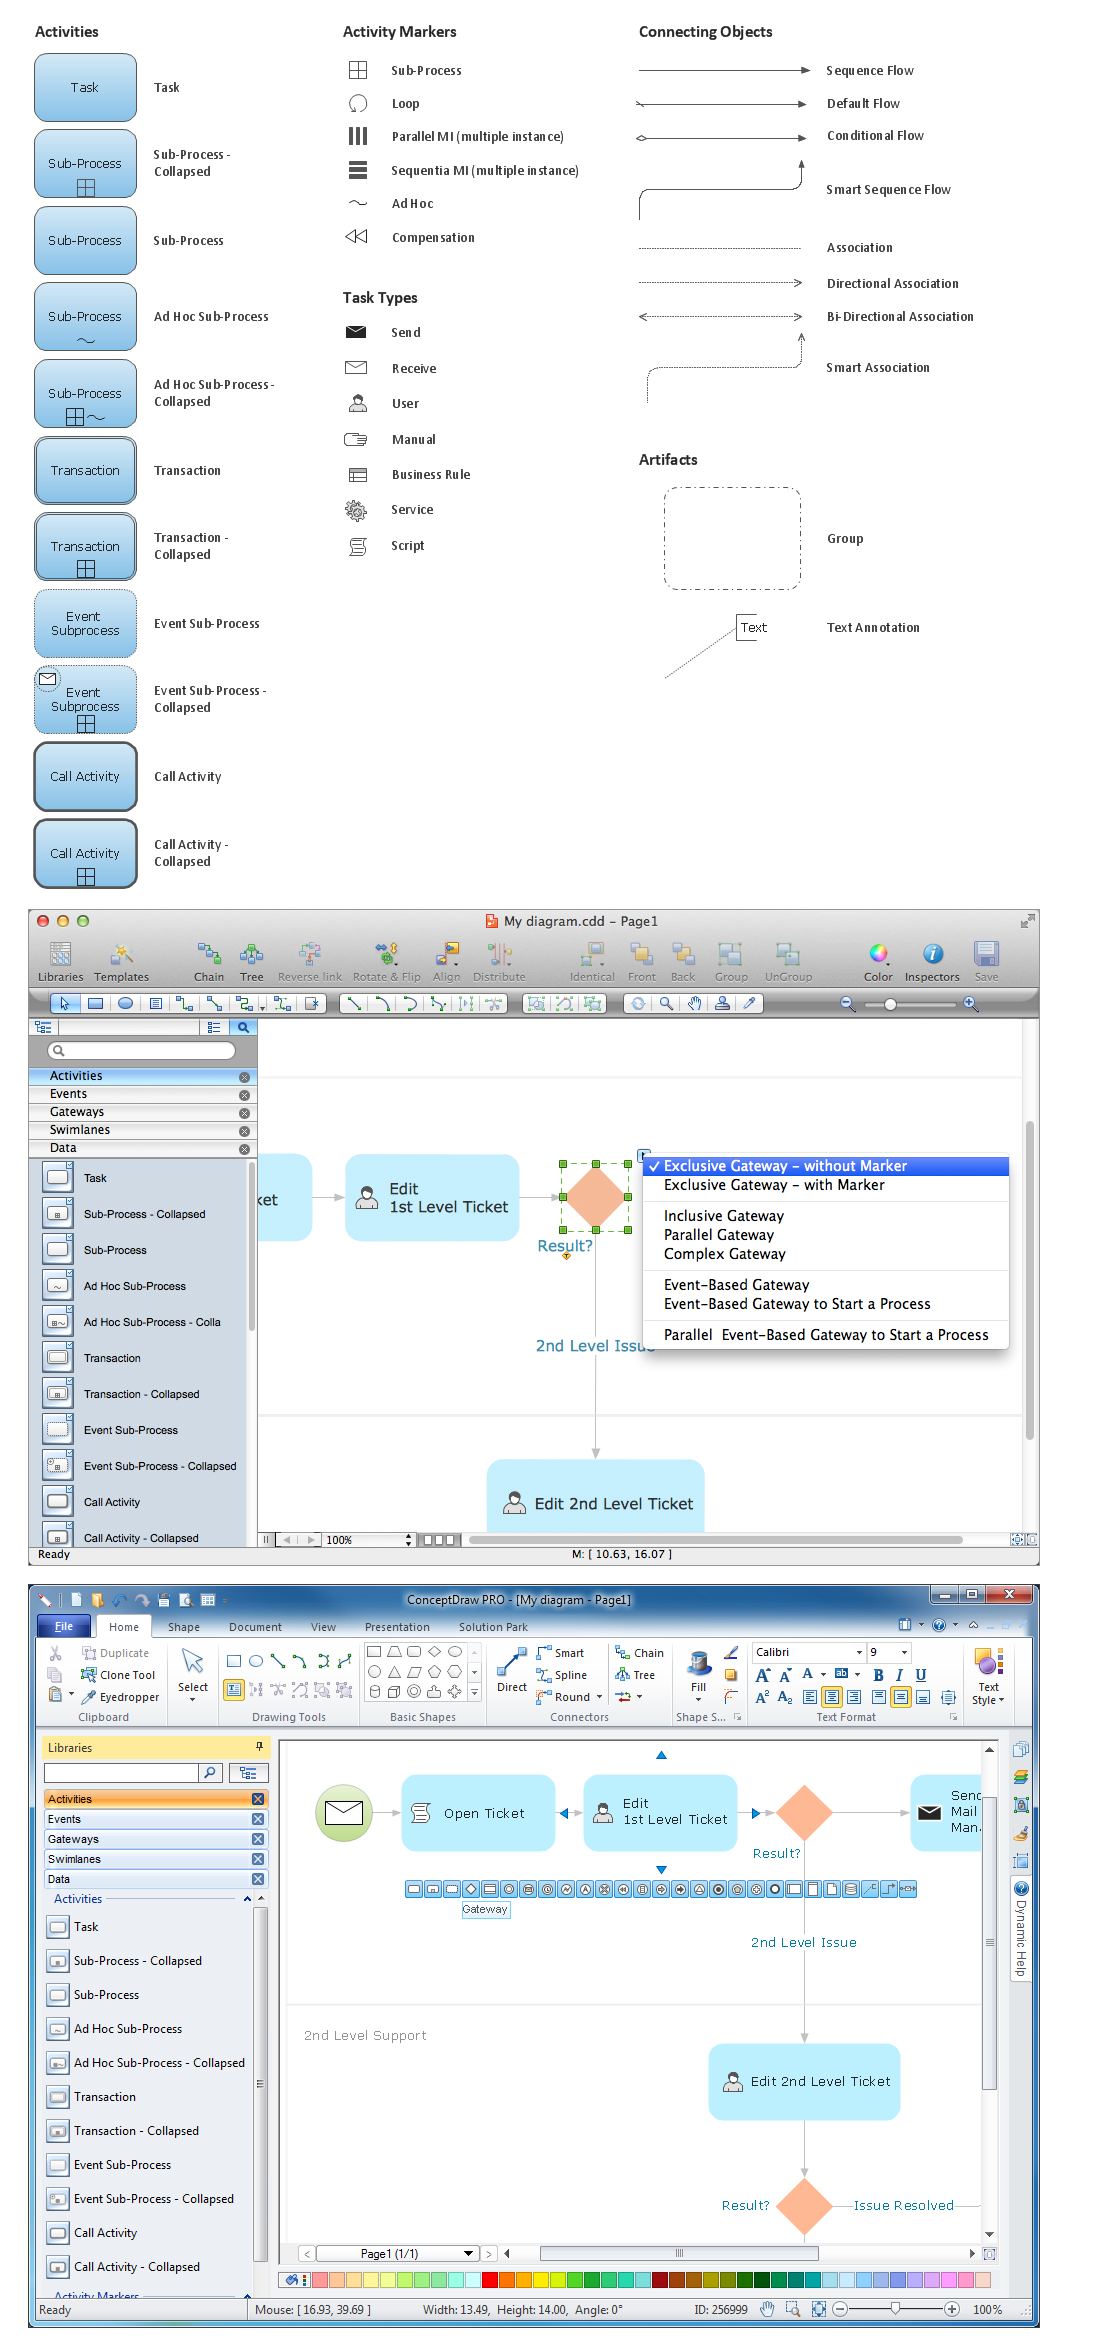
Picture: Diagramming Software for Business Process
What is a Work Flow Chart? It is a chart which visually displays the step-by-step transferring of data, documents and tasks during the work. ConceptDraw DIAGRAM extended with Workflow Diagrams solution from the Business Processes area of ConceptDraw Solution Park is the best software for drawing the Work Flow Chart of any complexity.
Picture: Work Flow Chart
Related Solution:
UML Package Diagram illustrates the functionality of a software system.
ConceptDraw has 393 vector stencils in the 13 libraries that helps you to start using software for designing your own UML Diagrams. You can use the appropriate stencils of UML notation from UML Package library.
Picture: UML Package Diagram. Design Elements
Related Solution:
