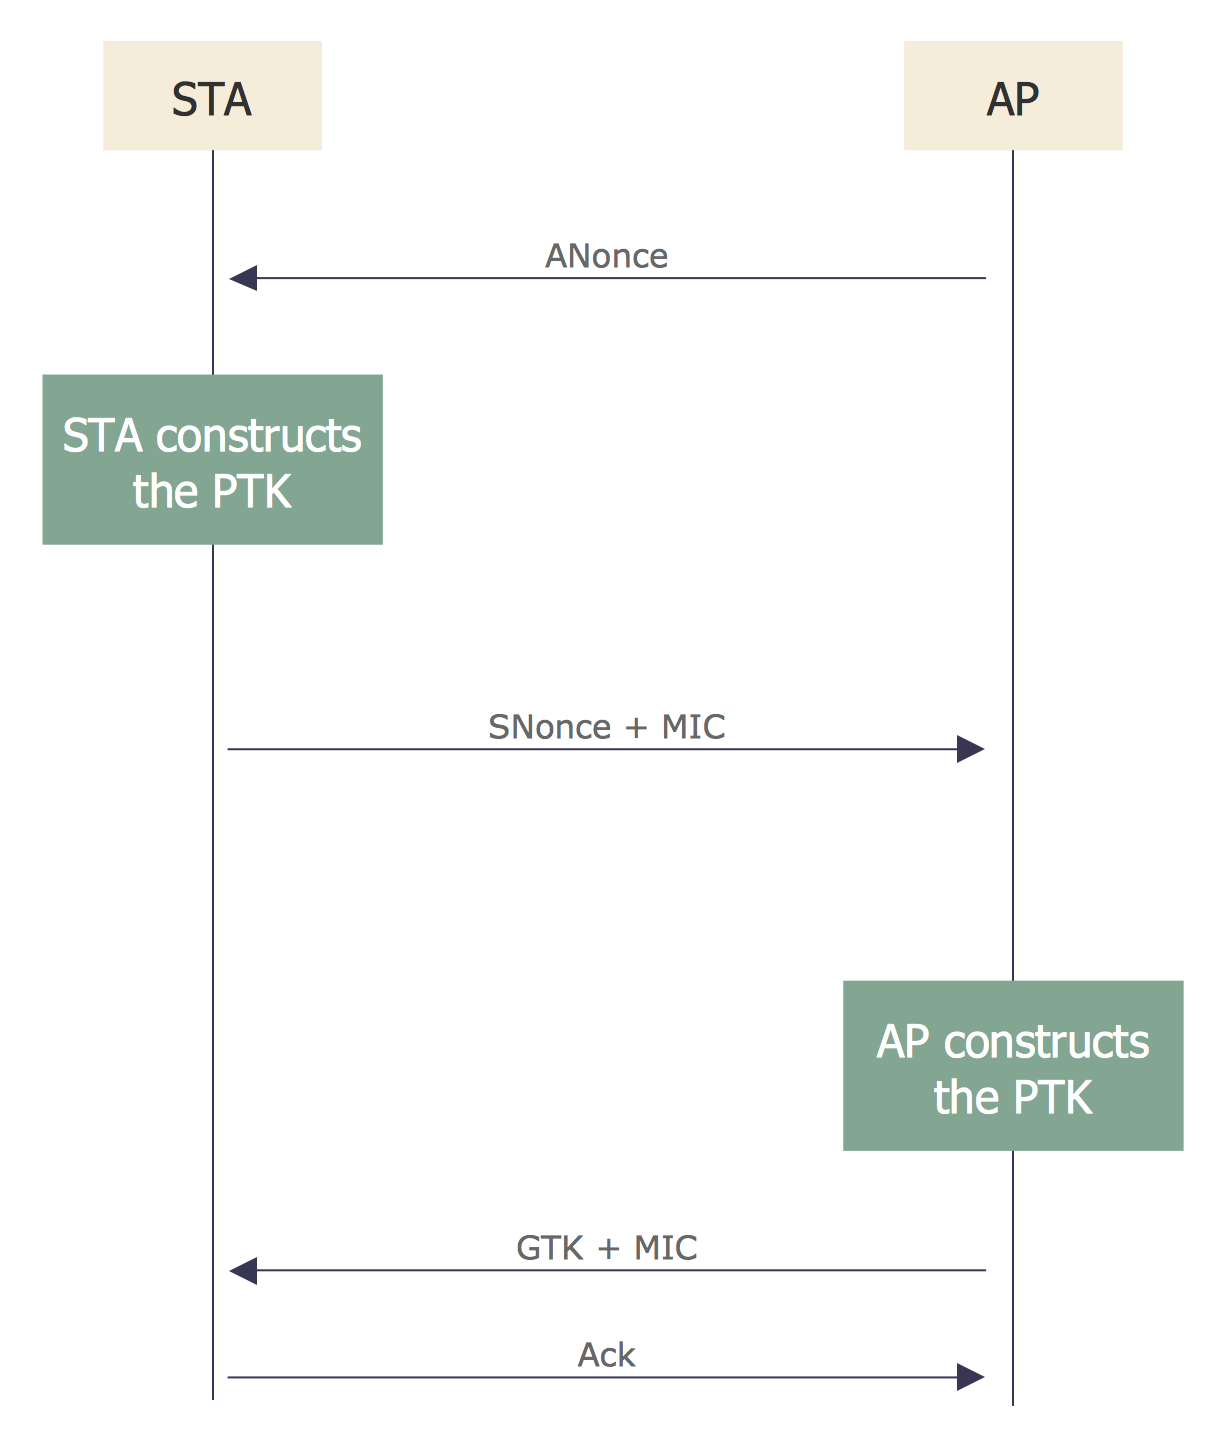
Example 1. Sequence Diagram for Cloud Computing
The Cloud Computing Diagrams Solution is incredibly helpful for easy drawing Cloud computing diagrams and Sequence diagram for cloud computing. Large collection of predesigned samples and variety of libraries with numerous vector objects are included to Cloud Computing Diagrams Solution for ConceptDraw DIAGRAM All them are professionally developed and are available from ConceptDraw STORE which permits to click any preview to open it for editing in ConceptDraw DIAGRAM software.

Example 2. Sequence Diagram for Cloud Computing, Apple OS X and Windows
The sequence diagram you see on this page was created in ConceptDraw DIAGRAM software using the tools of Cloud Computing Diagrams Solution for ConceptDraw Solution Park. An experienced user spent 5 minutes creating this sample.
Use the Cloud Computing Diagrams Solution for ConceptDraw DIAGRAM software to create various types for Cloud computing diagrams, and also ER diagram and Sequence diagram for cloud computing quick, easy and effective.
All source documents are vector graphic documents. They are available for reviewing, modifying, or converting to a variety of formats (PDF file, MS PowerPoint, MS Visio, and many other graphic formats) from the ConceptDraw STORE. The Cloud Computing Diagrams Solution is available for all ConceptDraw DIAGRAM users.
TEN RELATED HOW TO's:
Graphics Technology looks at how to communicate graphically, develop ability to create graphical presentations for varied needs, understand standards and special conventions, develop specific techniques and build an understanding of the impact of graphical presentation on society.
If you want to use effective methods for your work, you may need a tool which may let you represent your ideas and goals in graphic way.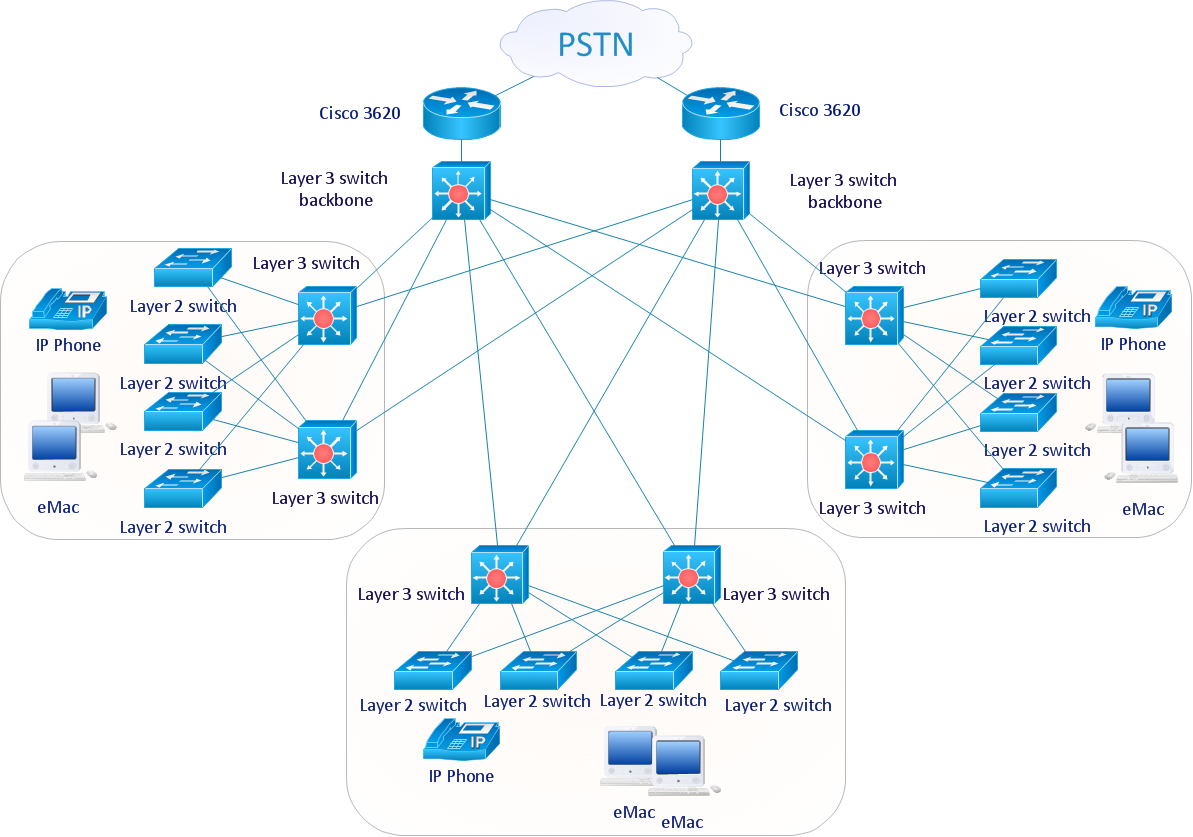
Picture: Graphic Technologies
It is impossible to imagine mechanical engineering without drawings which represent various mechanical schemes and designs. ConceptDraw DIAGRAM diagramming and vector drawing software supplied with Mechanical Engineering solution from the Engineering area of ConceptDraw Solution Park offers the set of useful tools which make it a powerful Mechanical Drawing Software.
Picture: Mechanical Drawing Software
Related Solution:
Network Diagrams visualize schematically the computer networks topology, equipment nodes and different types of their logical and physical connections. They are widely used by IT professionals to visually document the topology and design of computer and telecommunication networks.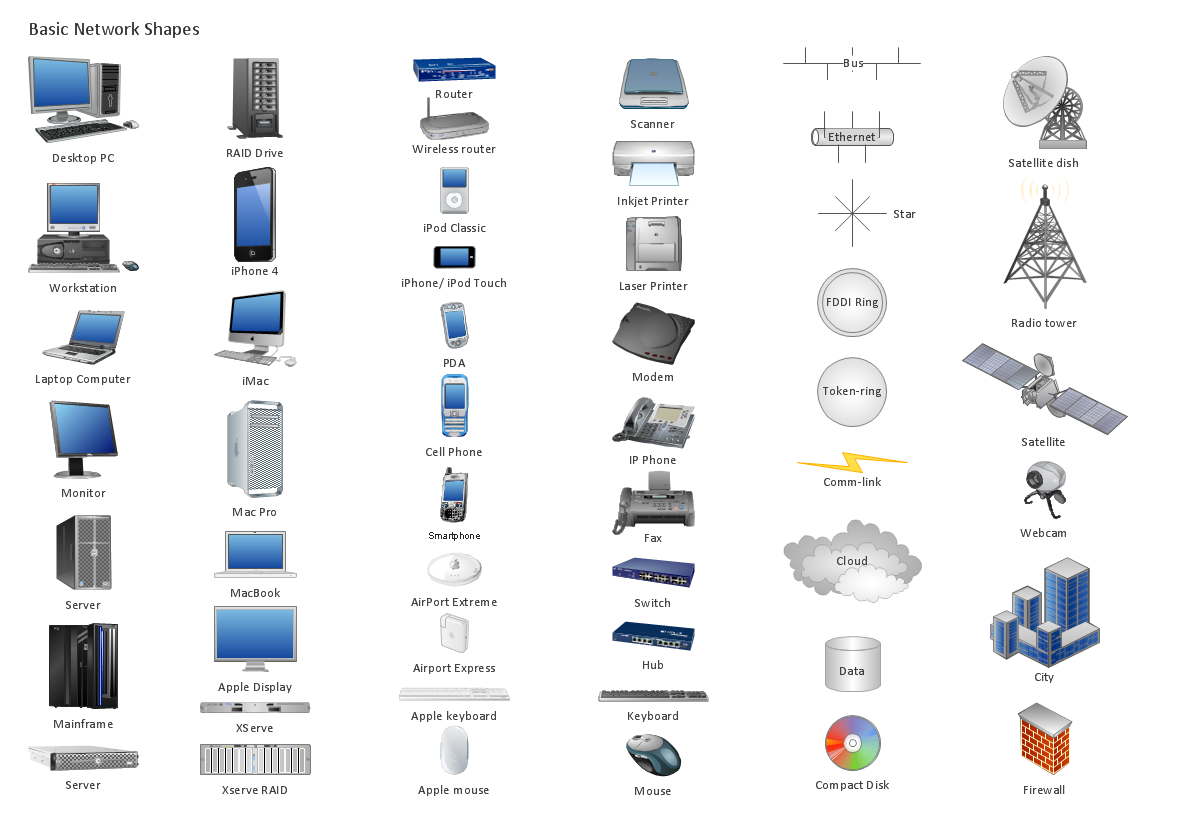
Picture: Computer Networking Tools List
Related Solution:
Any wireless network is some computer network that can use any needed wireless data connections that can be placed between the network nodes. Any wireless networking is known to be one of the methods by which both telecommunications networks and business installations, same as the homes avoid the process of introducing the cables into some building.
Drawing some wireless computer network as it may be a challenge, especially for those who do not have as much experience of doing it. That is why the CS Odessa team has developed the Wireless Networks solution so it can be used for simplifying all the ConceptDraw DIAGRAM users work on the needed diagrams.
Picture: Calculate the cost of creating or updating a wireless computer network
Related Solution:
The Architecture Diagrams are the type of diagrams which help to system designers, system developers, and application developers to visualize the overall high-level structure of the system or application and depict the interactions between software systems, users, external systems, data sources, and services. The ConceptDraw DIAGRAM Architecture Diagrams Software provides the unique Cloud Computing Diagrams solution from the Computers and Network area of ConceptDraw Solution Park with wide set of powerful tools for fast and easy creating various types of Architecture diagrams.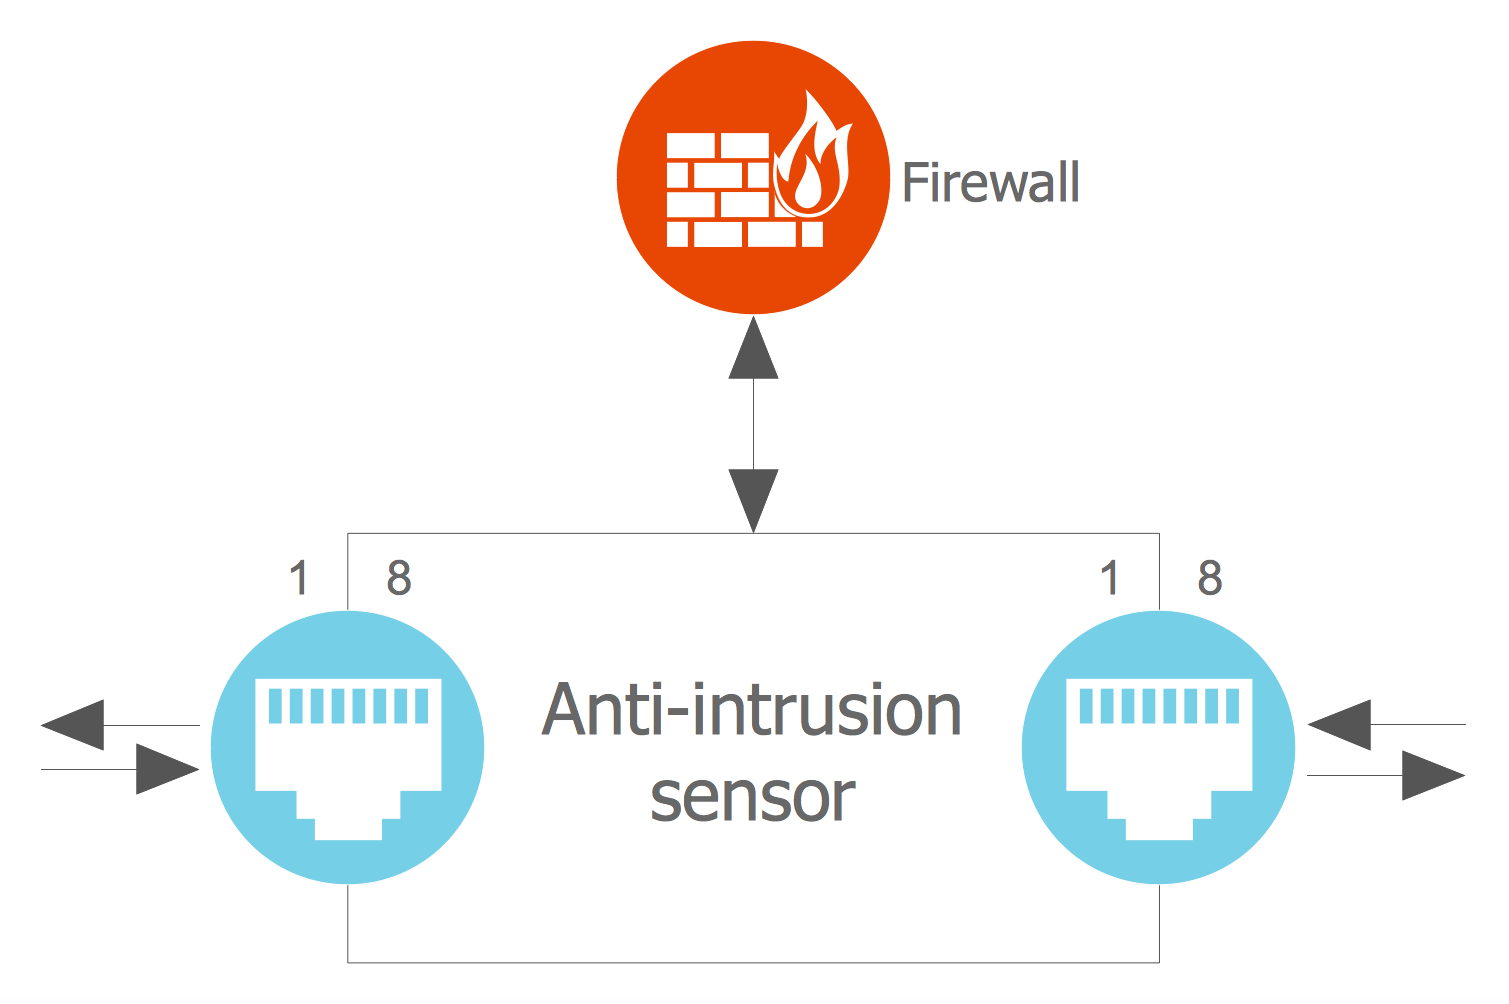
Picture: Architecture Diagrams
Related Solution:
Visual information is easier to perceive. You can teach even a child to make diagrams with a good flowchart example that would be interesting for it. Flowcharts can be fun, it’s not about business processes or programming algorithms.
This flowchart shows step by step process of manufacturing of Nixtamal The product which is obtained by processing maize with calcium hydroxide. We must assume that the Aztecs were very fond of this product, if the recipe of its production came to our times. This flow chart was designed using ConceptDraw DIAGRAM with its solution for designing flowcharts of various types, sizes and purposes. ConceptDraw Flowcharts solution consists from the library of flowchart symbols, containing the set vector objects. Also there are a lot of diverse templates and samples of flow charts.
Picture: Flowchart Examples and Templates
Related Solution:
Website wireframes are convenient and widely used by developers, visual designers, business analysts, and many other people related with projection, development and promotion websites. Usually website wireframes look lacking of brilliance, but they effectively reflect website functionality, content and visually represent its skeletal framework.
ConceptDraw DIAGRAM software offers a unique Website Wireframe solution from the Software Development area with all needed tools for fast and easy drawing professional looking website wireframe with attractive interface design.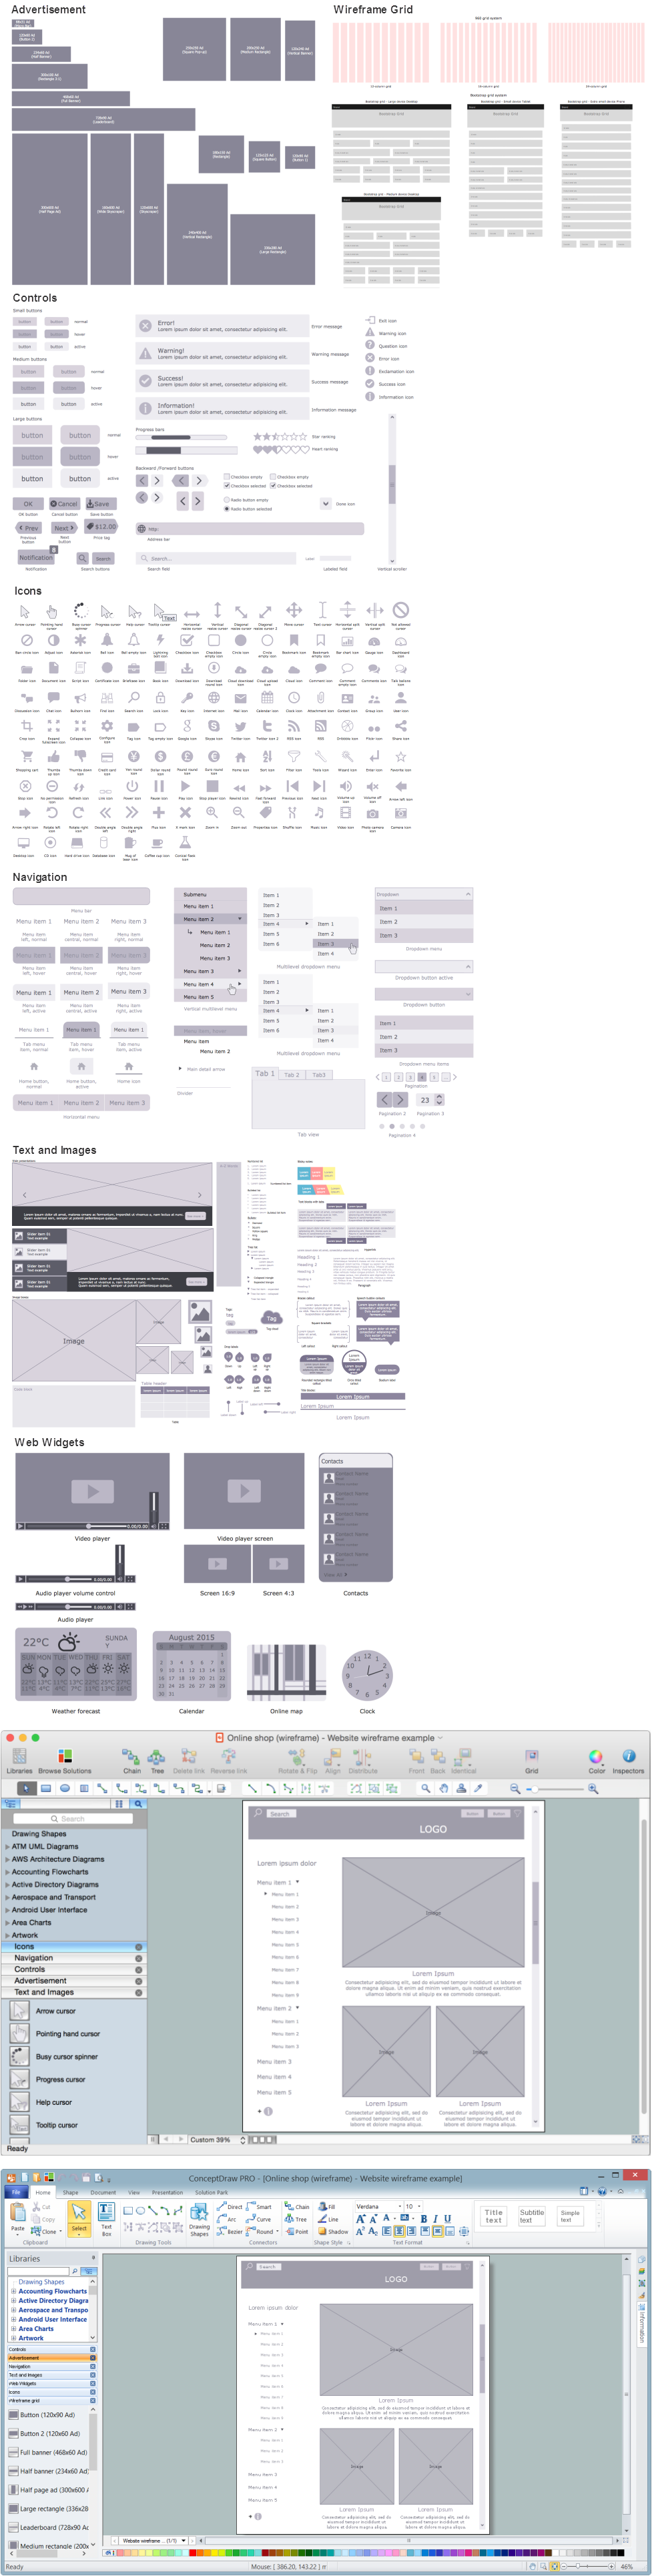
Picture: Interface Design
Related Solution:
When it comes to system construction, a class diagram is the most widely used diagram. UML Class Diagrams is a type of static structure diagram that is used for general conceptual modeling of the systematics of the application. Such a diagram would illustrate the object-oriented view of a system. The object orientation of a system is indicated by a class diagram. It describes the structure of a system by showing the general issues,classes of a system, attributes, operations, interfaces, inheritance, and the relationships between them.
Picture: UML Class Diagram Notation
Related Solution:
Use the set of special professionally developed swim lane flowchart symbols - single, multiple, vertical and horizontal lanes from the Swimlanes and Swimlanes BPMN 1.2 libraries from the Business Process Diagram solution, the Swim Lanes library from the Business Process Mapping solution as the perfect basis for your Swim Lane Flowcharts of processes, algorithms and procedures.
Picture: Swim Lane Flowchart Symbols
Related Solution:
The vector stencils library from the solution Information Model Diagrams contains specific data type symbols of the EXPRESS-G notation such as entity data type symbols, simple data type symbols, enumeration data type symbols, defined data type symbols, select data type symbols and specific attribute symbols for ConceptDraw DIAGRAM diagramming and vector drawing software. The Information Model Diagrams solution is contained in the Software Development area of ConceptDraw Solution Park.
Picture: Express-G Diagram
