UML Class Diagram Generalization Example
UML Diagrams
The Generalization association ("is a") is the relationship between the base class that is named as “superclass” or “parent” and the specific class that is named as “subclass” or “child”.
The UML diagram's Generalization association is also known as Inheritance. The subclass is a particular case of the superclass and inherits all attributes and operations of superclass, but can have your own additional attributes and operations.
In UML is used also the multiple inheritance when the subclass inherits properties and behaviors of more than one superclass.
On the UML Diagram the Generalization association represents as the line with empty triangle that connects superclass and subclass.
Near the Generalization association line can be write in { } any additional properties of this association that display as the constraints.
You can use the following UML keywords as constraints:
- complete – signify that in this generalization association are specified all subclasses and the superclass cannot have another subclasses.
- disjoint – signify that subclasses cannot contain the objects that are the instances of two or more classes at the same time.
- incomplete – signify that on the diagram are not specified all the subclasses
- overlapping – signify that some instances of subclasses can belong to two or more classes at the same time.

Example 1. UML Class Diagram Generalization Example
This sample was created in ConceptDraw DIAGRAM diagramming and vector drawing software using the UML Class Diagram library of the Rapid UML Solution from the Software Development area of ConceptDraw Solution Park.
This sample describes the use of the classes, the generalization associations between them, the multiplicity of associations and constraints.
UML Resource:
TEN RELATED HOW TO's:
UML Component Diagram Online Shopping. This sample was created in ConceptDraw DIAGRAM diagramming and vector drawing software using the UML Component Diagram library of the Rapid UML Solution from the Software Development area of ConceptDraw Solution Park.
This sample shows the concept of the online shopping and is used for the understanding of the online shopping processes, of the online shops working processes, for projection and creating of the online stores.
Picture: UML Component Diagram Example - Online Shopping
Related Solution:
The Rapid UML Solution from the Software Development area of ConceptDraw Solution Park helps you to create the UML Class Diagrams quick and easy using ConceptDraw DIAGRAM diagramming and vector drawing software.
Picture: UML Class Diagram Tutorial
Related Solution:
This pyramid chart example is supplied with the ConceptDraw Pyramid Diagrams solution. This is a model of Information Management Systems classification. It is made in a form of a four-level pyramid. The top level shows the information system developed for an executive management. Below, there is a level depicting the system of decision making process for the managers of the senior level. A schematic representation of the middle management information system, following to logic, is in the middle of the pyramid. And at least, the lowermost level represents an information processing system for employees.
Picture: Pyramid Diagram
Related Solutions:
When deciding to start your own business, you have to take into account a bunch of different aspects. One of the ways to get inspired is to look through various restaurant floor plans samples or interior photos of already known establishments. This will help you, but keep in mind that a really unforgettable establishment must be unique.
This restaurant floor plan diagram was designed using ConceptDraw Cafe and Restaurant Floor Plan solution. It can be used as a sample while considering a custom restaurant design. With the help of this example you can estimate the amount of furniture best for a dining room or kitchen of the restaurant. In addition, this plan would be useful as a check list when you will consider a list of the furniture and equipment needed for all areas of the future restaurant.
Picture: Restaurant Floor Plans Samples
Related Solution:
A workflow diagram is less general notation than a process flow diagram. Workflow as a term can apply to organizational process which involves people, resources, documents, sort of data, for instance; whereas a process is general collection of steps occuring in any sort of activity. That is why process flow diagram can be used as workflow diagram to describe business process, data flow or department interactions.
The fastest way to create a workflow diagram is using pre-designed workflow template. ConceptDraw DIAGRAM with the Workflow Diagrams solution delivers rich set of workflow diagram templates you may start from.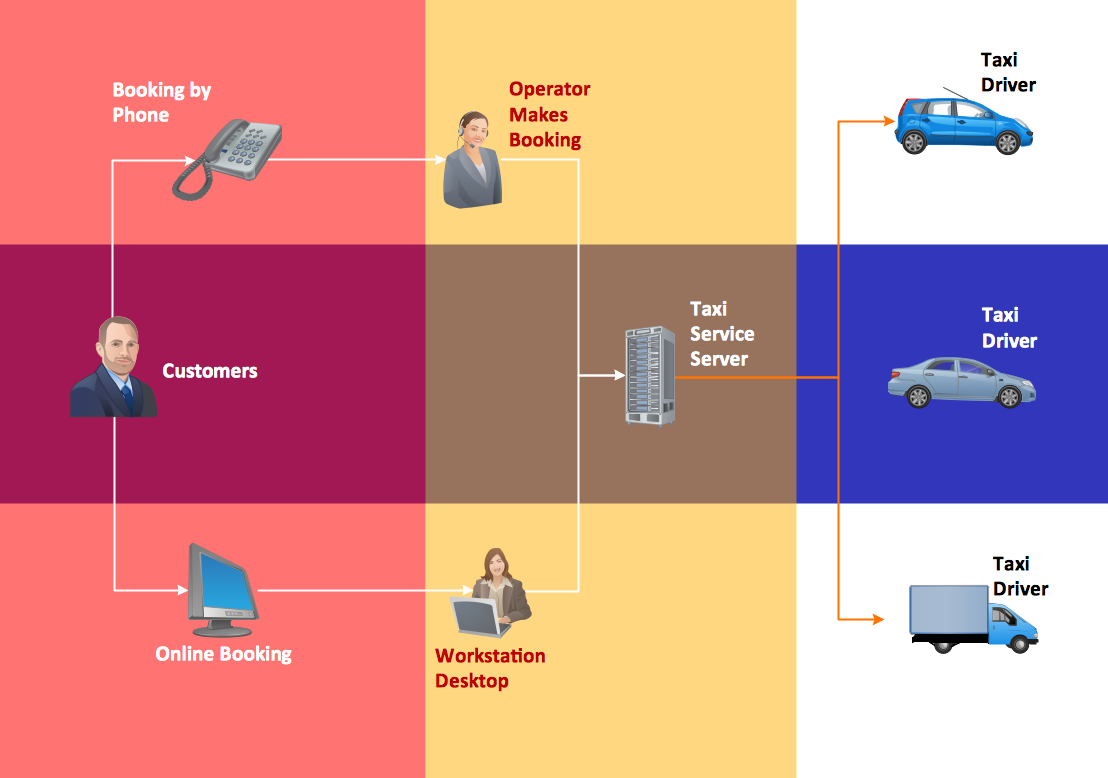
Picture: How To Create a Workflow Diagram
Related Solution:
ConceptDraw DIAGRAM is the best BPMN software for ✔️ modeling business processes, ✔️ graphical documenting processes, ✔️ analysis processes, ✔️ optimization business processes, ✔️ identifying inefficiencies, ✔️ efficient decision-making based on created Business Process Diagrams and Business Process Models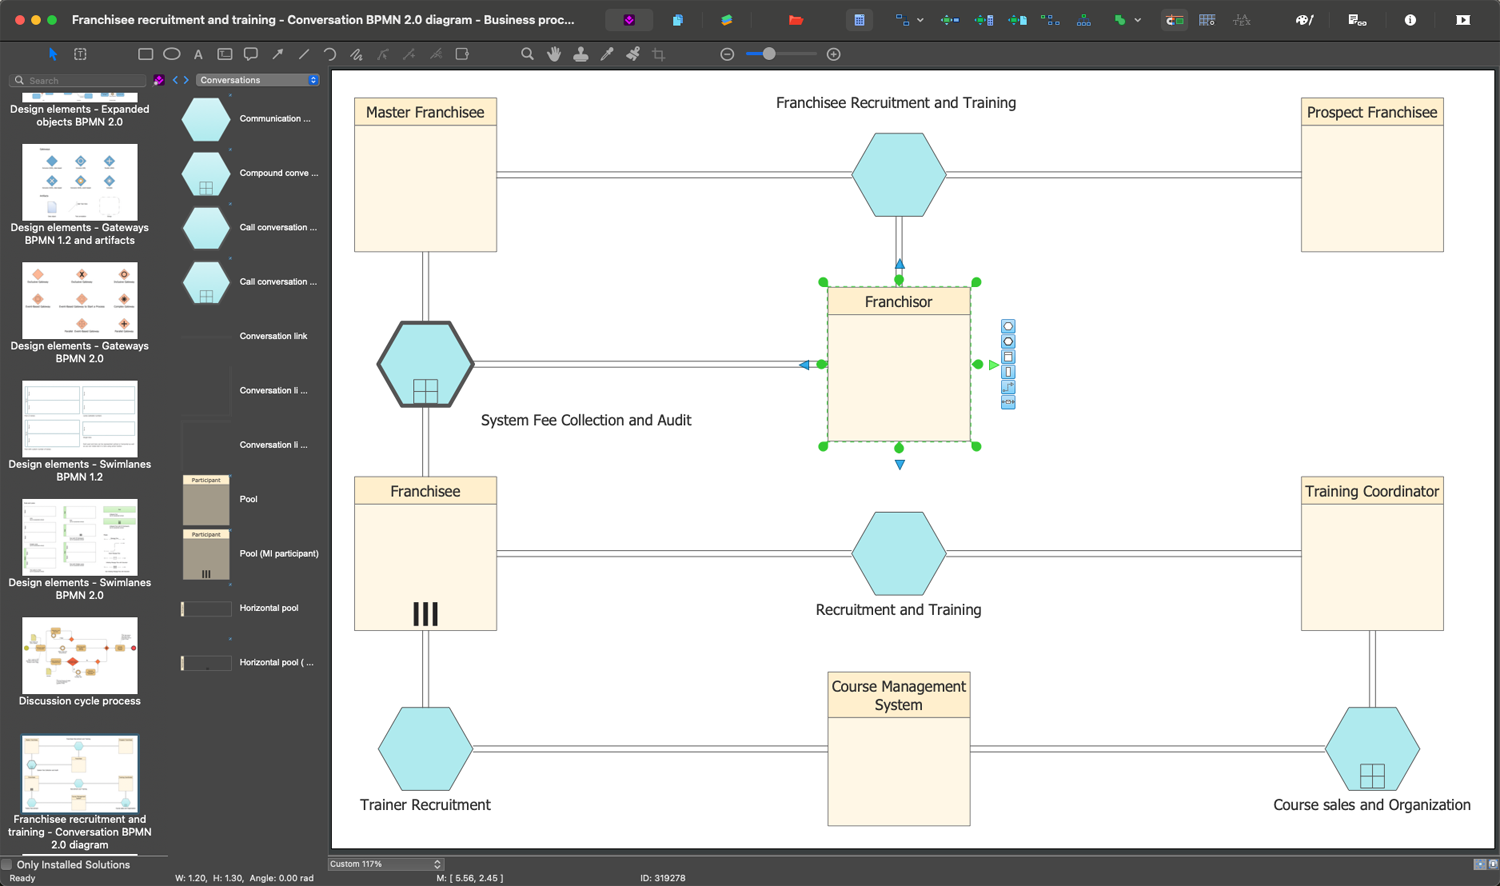
Picture: The Best Business Process Modeling Software: Comprehensive Guide
Related Solution:
Create value stream maps - for value stream analysis and value stream management, material and information flow mapping, using our quick start templates included with ConceptDraw.
Picture: Best Value Stream Mapping mac Software
Related Solution:
The UML diagram is a powerful tool which lets visually represent all system's components, the interactions between them and relationships with external user interface.
The Rapid UML solution for ConceptDraw DIAGRAM software offers diversity of UML flowchart symbols for drawing all types of UML diagrams.
Picture: UML Flowchart Symbols
Related Solution:
How do Fishbone diagrams solve manufacturing problems? Fishbone diagrams are successfully used in various fields of industries and manufacturing to analyze the set of possible causes and their effects. Fishbone diagram provides a process to clearly define the “Effect” and then puts you to thinking about the possible causes, based on the categories of common problems in manufacturing.
ConceptDraw DIAGRAM application extended with Fishbone Diagrams solution lets you construct Fishbone diagrams and represent globally recognized standards for manufacturing 6 Ms and 8 Ms.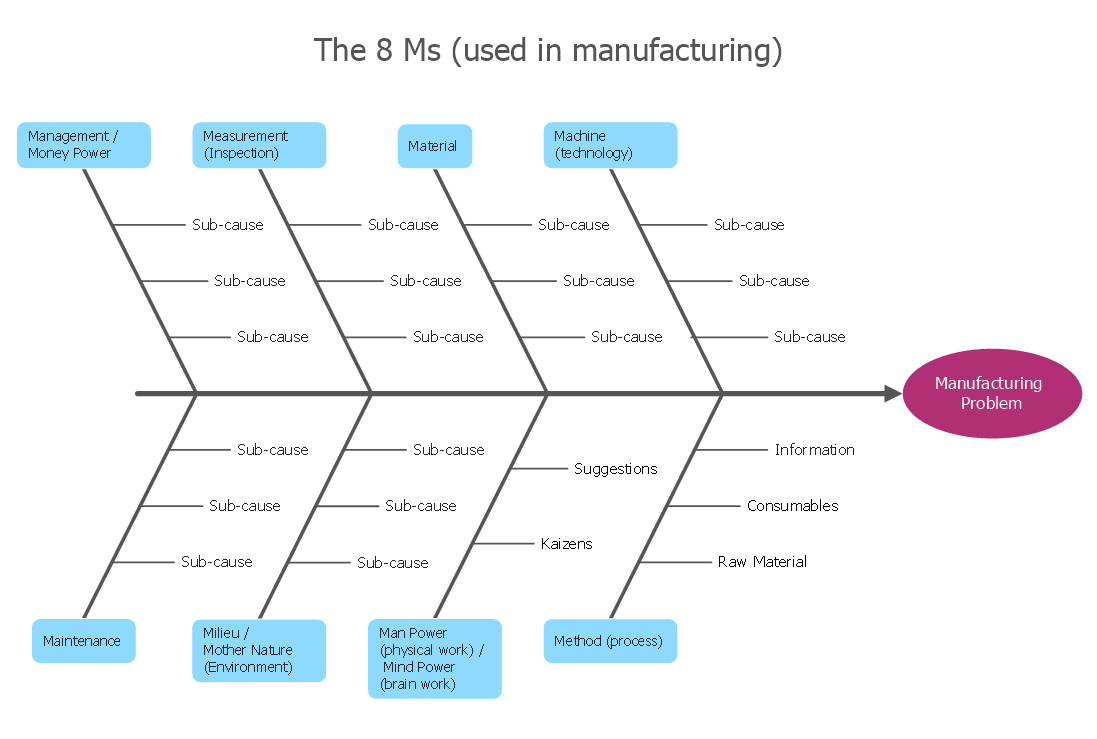
Picture: How Do Fishbone Diagrams Solve Manufacturing Problems
Related Solution:
ConceptDraw Network Drawing Software - Network design software for network drawings with abundant examples and templates.
Create computer network designs, diagrams and schematics using ConceptDraw.
Picture: Network Drawing Software