Diagramming Software for UML Composite Structure Diagrams
UML Composite Structure Diagrams
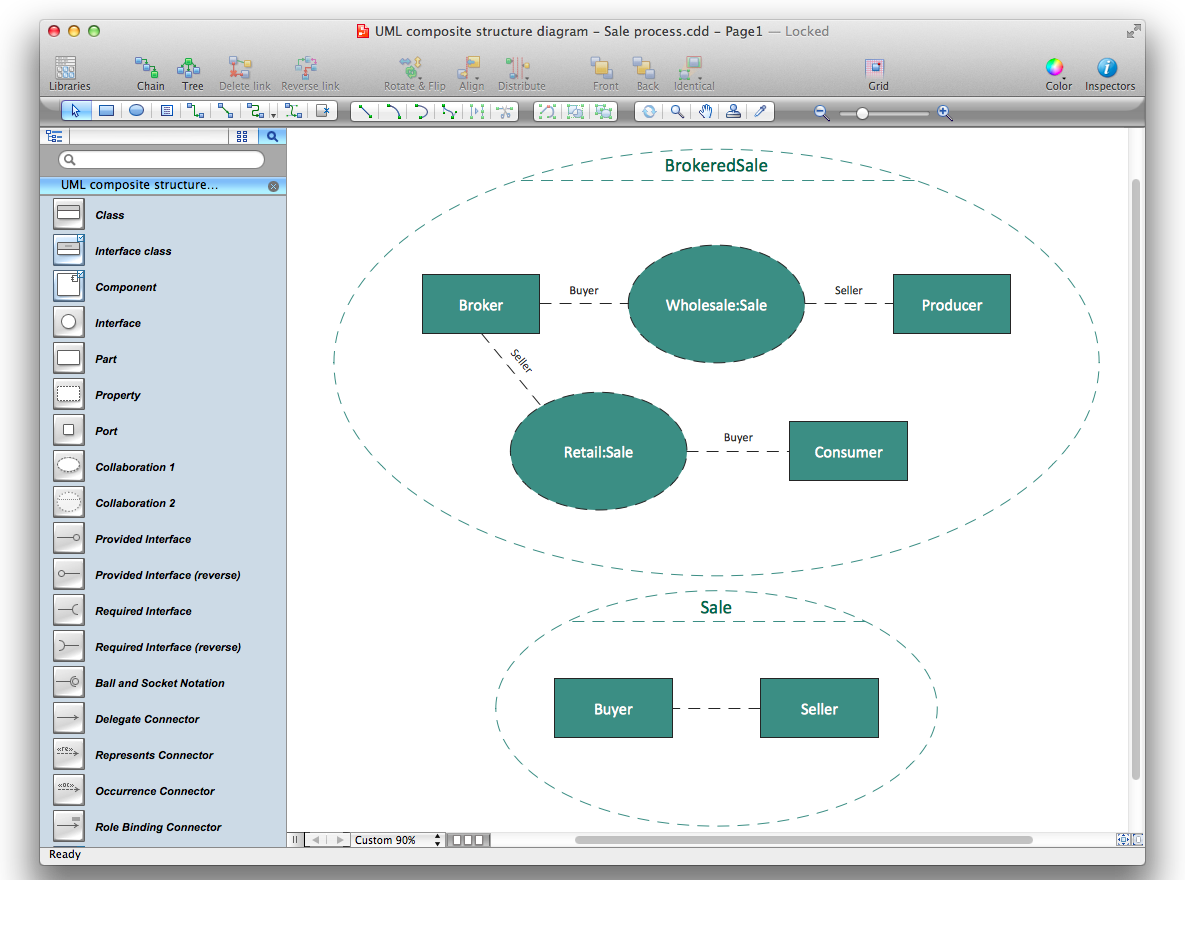
UML Composite Structure Diagram shows the internal structure of a class and the possible interactions at this structure. It includes internal parts, ports, and connectors between parts or ports. Each element has some defined roles in the collaboration.
ConceptDraw software helps you to start designing your own UML Composite Structure Diagrams with examples and templates.
You can use the appropriate stencils of UML notation for designing UML Composite Structure Diagram.
UML Composite Structure Diagram Library
ConceptDraw Rapid UML solution delivers libraries contain pre-designed objects fit UML notation, and ready to draw professional UML Composite Structure Diagram.

UML Composite Structure Diagram Design Elements
Design elements sample shows all library objects at one page for quick review.

Design UML Composite Structure Diagram in ConceptDraw DIAGRAM software
ConceptDraw DIAGRAM workspace is clear and simple. All tools you need for drawing UML Composite Structure Diagram are on hand.

Examples of UML Composite Structure Diagram
This is an example of UML Composite Structure Diagram for an Drive taxi process.

This example is created using ConceptDraw DIAGRAM diagramming and vector drawing software enhanced with Rapid UML solution from ConceptDraw Solution Park.
Rapid UML solution provides templates, examples and libraries of stencils for quick and easy drawing UML 2.4 composite structure diagram.
Use ConceptDraw DIAGRAM with UML Composite Structure Diagram templates, samples and stencil library from Rapid UML solution to model the internal structure of a class or collaboration.
TEN RELATED HOW TO's:
ConceptDraw DIAGRAM extended with Organizational Charts Solution from the Management Area is a powerful but easy-to-use Organizational Structure Diagram Software.
Organizational Charts Solution provides a wide variety of templates and samples and large quantity of predesigned vector objects to help you design your Organizational Structure Diagrams and other business diagrams.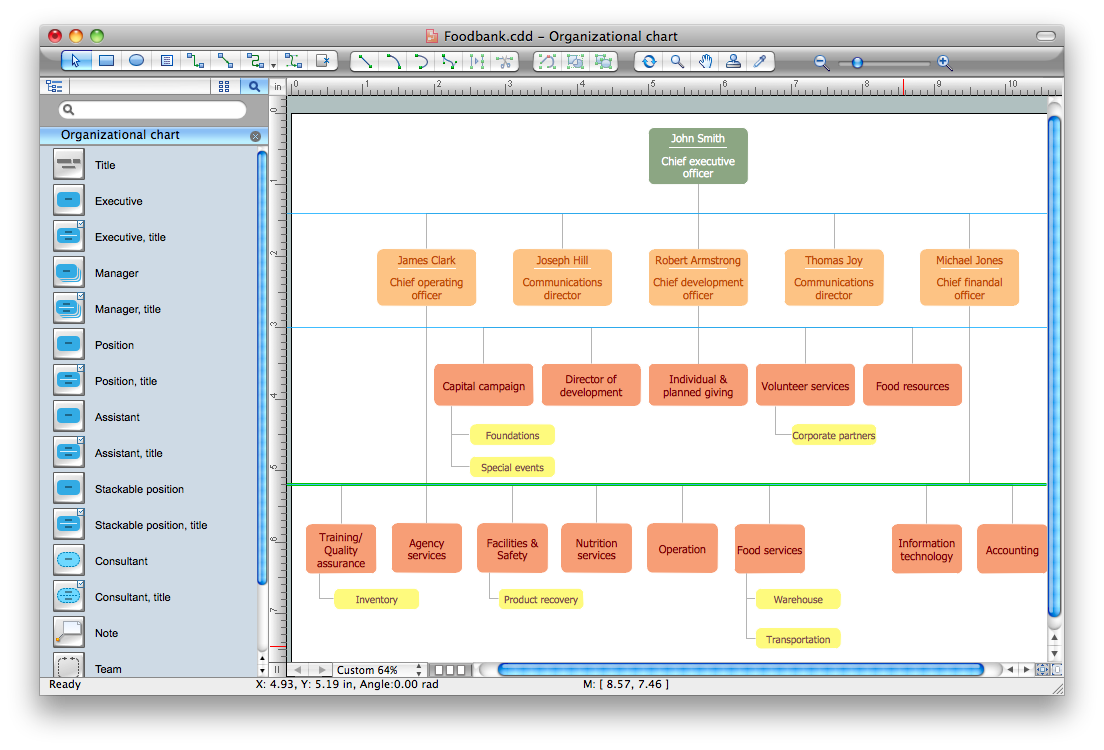
Picture: Organizational Structure Diagram Software
Related Solution:
Bureaucratic companies usually are characterized by a strict hierarchy and clearly defined responsibilities. However, sometimes organizational structure of a company reminds of somewhat tangled. To clarify it, you can create an orgchart that will represent the company as a tree with its' departments as branches.
This organization diagram represents a tree-like organizational structure. This is a typical example of a top-level branches of the hierarchical organizational structure. This part of the tree shows heads of branches who are subordinated completely to the president. The information and solutions are distributed though a tree structure down to the company's departments. Each of the sub-division has its own structure that is reflected in the corresponding organizational chart. This orgchart diagram was created using the vector graphic library supplied with ConceptDraw Organizational Charts solution.
Picture: Organizational Structure
Related Solution:
ConceptDraw DIAGRAM vector charting software enhanced with HR Flowcharts solution is a suitable tool to create the HR org structure, onboarding model, design HR organizational chart for a company of any size without efforts.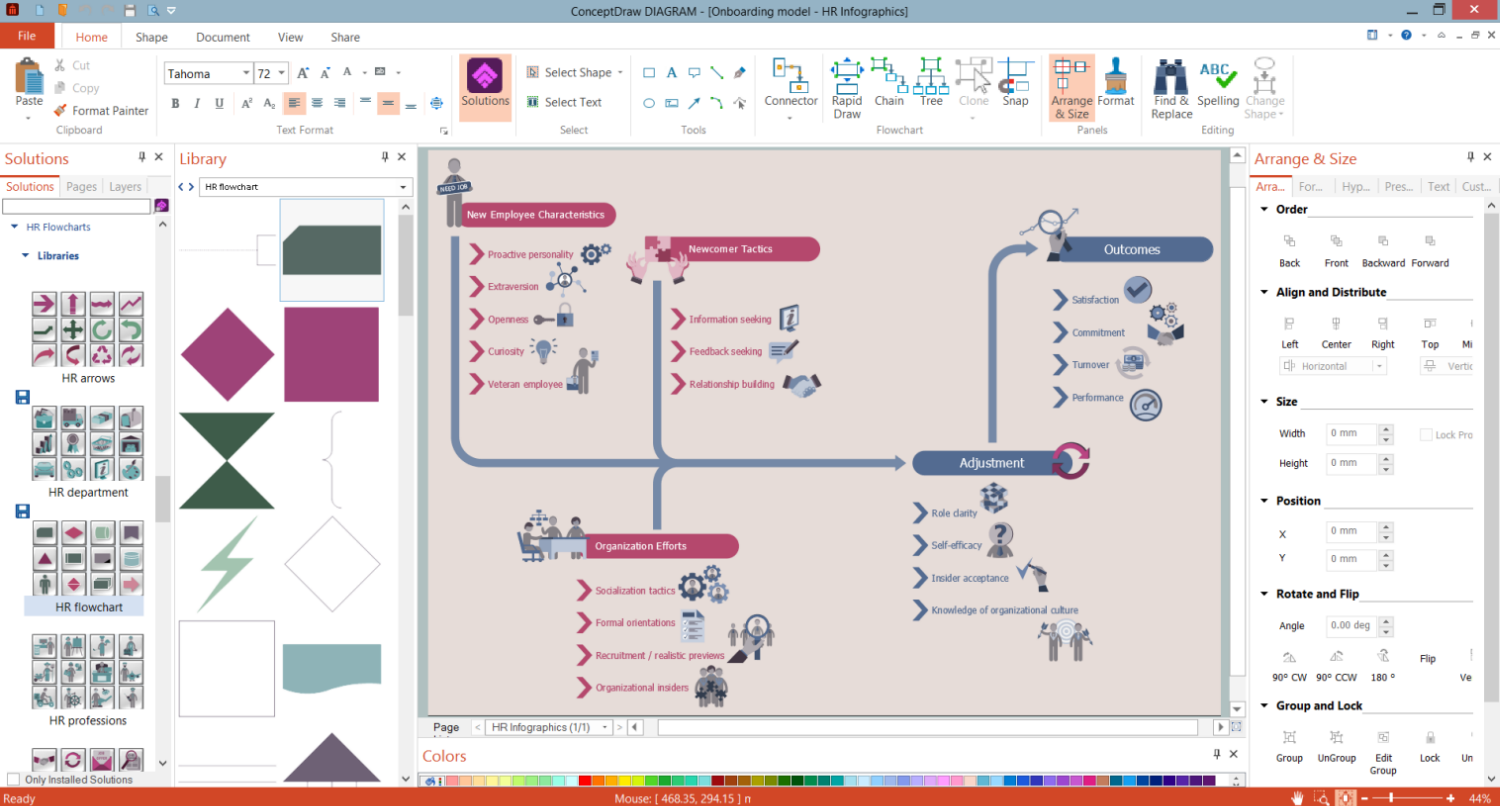
Picture: HR Org Structure
Related Solution:
A visual representation of the configuration system, as well as the internal interfaces among such drawing’s CIs, may be always done with the help of the professional tool, such as the ConceptDraw DIAGRAM diagramming software. The structure diagram may be used for identifying the CIs as well as their associated artifacts. Doing it with the aid of ConceptDraw DIAGRAM as well as its extension (the Jackson Structured Programming (JSP) Diagrams solution) may simplify anyone’s work of making such diagrams.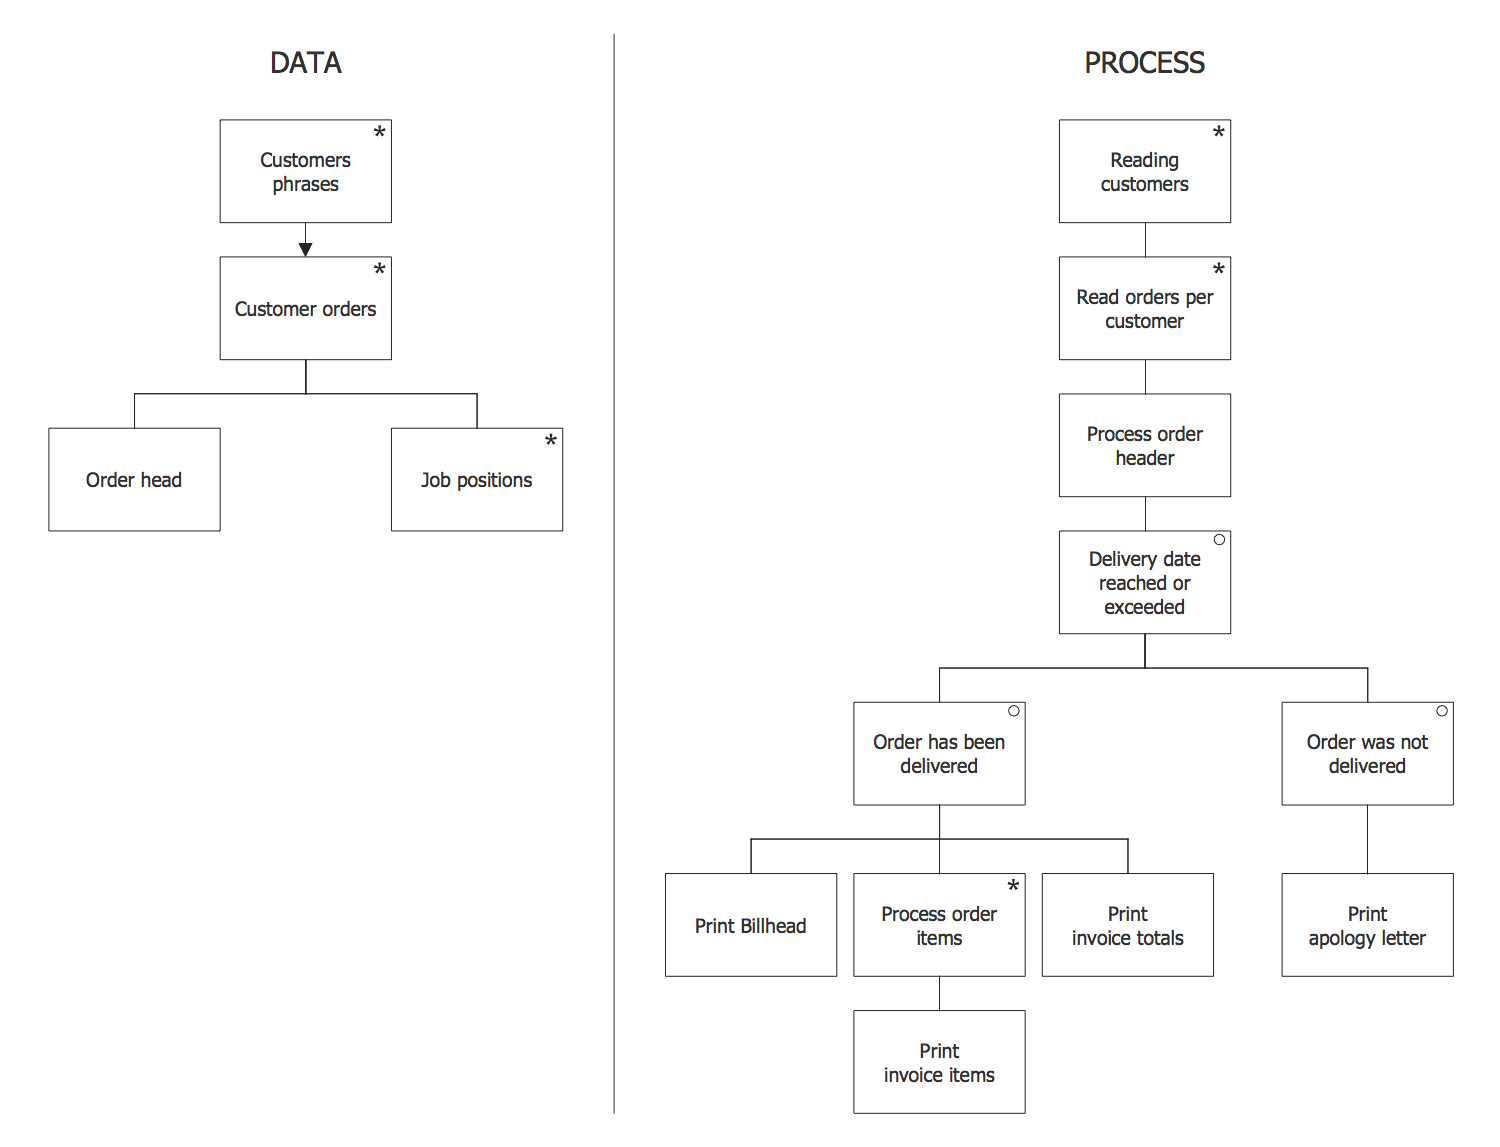
Picture: Program Structure Diagram
Related Solution:
There are many ways to define the flow of information within a system. Structured-systems analysis method often uses data flow diagrams to show data flow, data storages and data processing visualization. These diagrams are easy to develop and quite useful.
Here is a dataflow diagram presenting an example of the manufacturing process flow. The oval process shapes represent a process that controls data within the current system. The process may produce data or make some action based on data. Data flows are represented by lines. They show the movement of information through the system. The direction of the data flow is depicted by the arrow. The external entities are shown by rectangles. They represent the external entities interacting with the system. The data store objects (unclosed rectangles) are used to show data bases participating in a process flow.
Picture: Data Flow Diagram
Related Solution:
The UML Diagrams are widely used by software developers and software engineers. They can draw the UML Diagrams manually on the paper, but it is incredibly convenient to use the special UML diagramming software. The UML diagramming software allows you to draw the UML Diagrams in a few minutes.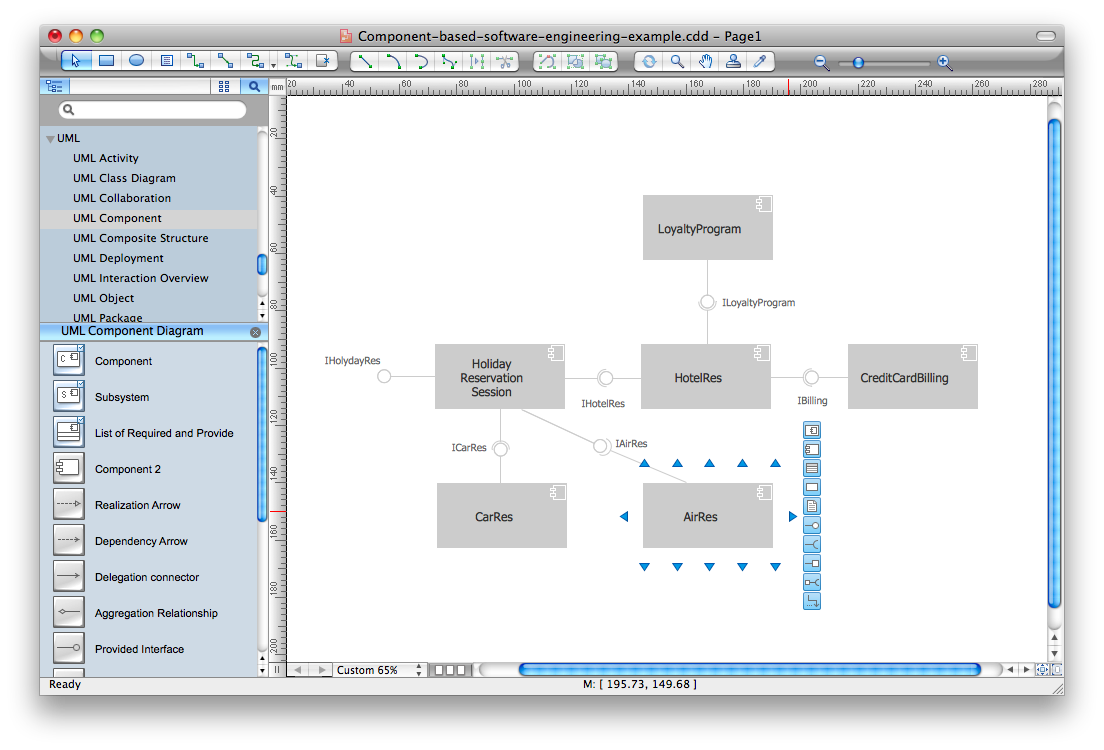
Picture: UML Diagram Software
Related Solution:
Use Case Diagram Taxi Service UML. This sample was created in ConceptDraw DIAGRAM diagramming and vector drawing software using the UML Use Case Diagram library of the Rapid UML Solution from the Software Development area of ConceptDraw Solution Park.
This sample shows the work of the taxi service and is used by taxi stations, by airports, in the tourism field and delivery service.
Picture: UML Block Diagram
Related Solution:
Once you have created your document in ConceptDraw DIAGRAM and you want to share it with your colleagues and friends, who uses MS Visio on their computers, you can easily export your document using ConceptDraw DIAGRAM export to Visio XML files (VDX) feature.
Now you can share your ConceptDraw documents with MS Visio users.
Picture: Export from ConceptDraw DIAGRAM Document to MS Visio® XML
UML Component Diagram illustrates show components are wired together to larger components and software systems that shows the structure of arbitrarily complex systems.
Rapid UML Solution for ConceptDraw DIAGRAM contains 13 vector stencils libraries with 393 interactive shapes that you can use to design your UML diagrams.
To design a Component Diagram use the UML Component Diagram library.
UML Component Diagram library contains 36 shapes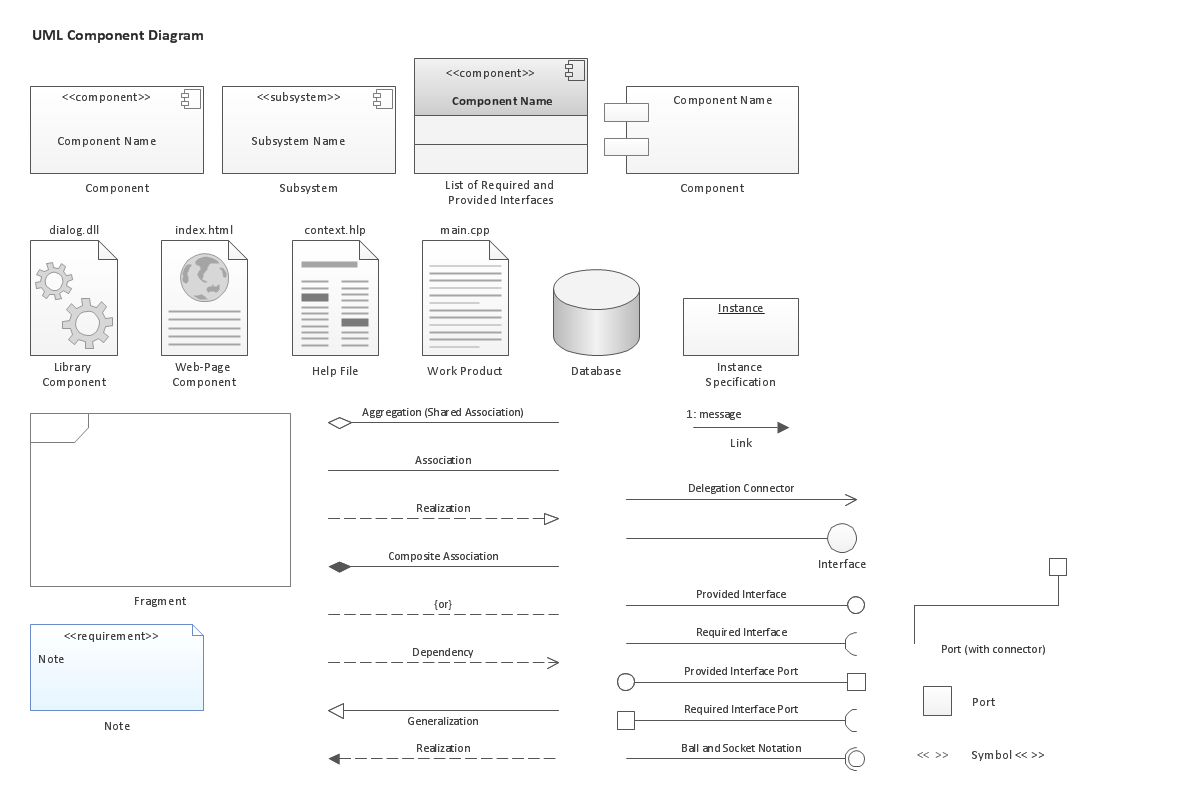
Picture: UML Component Diagram. Design Elements
Related Solution:
This sample shows the concept of working of the transport company and is used by transport companies, carriers at the transportation of various goods.
Picture: UML Class Diagram Example for GoodsTransportation System
Related Solution:


