UML Diagrams with ConceptDraw DIAGRAM
UML (Unified Modeling Language) is a general-purpose modeling language used to represent the structure of complex software in a visual form, and employed in software engineering. UML diagrams are also efficient for documenting complex computer systems and software. Such visual models facilitate communication between the customer, system analysts and programmers, who write the source code. In addition, it's much easier for new programmers to understand the source code when a detailed UML diagram of it is available. Previously, when a programmer resigned a part of his work was gone with him because the code-creating process took place exclusively in his head. Now a newcomer can understand and get familiar with someone else's code without much trouble.
Programming languages may use operations and methods which are basically same, though vary by names and graphical notations. The UML language defines standards not only for operations and methods of programming languages, but also for their terminology.
So, using UML diagrams for visual modeling will help you to improve the final software products, simplify the process of its creation and meet the deadlines.

ConceptDraw DIAGRAM is a professional software product designed for creating detailed UML diagrams. A large number of libraries with ready-made objects for UML diagrams and task-oriented templates let you create UML diagrams of any complexity without effort.
To draw a diagram, just drag the required objects from the corresponding library onto the document page, then connect them with connectors appropriate for diagrams of this type.
There are 8 types of UML diagrams:
Use case diagram:
Diagrams of this type represent a list of operations performed by the system. Such diagrams are also called functional diagrams, as the list of the system's functions is created based on them, in accordance with the specified requirements.
Use case diagrams are used to describe business processes in automated applications and to define requirement for software to be developed. They depict objects from the system and application domain as well as the tasks performed by them.

Pic.1. UML use case diagram
To draw diagrams of this type, use the UML Use Case Diagram library in ConceptDraw DIAGRAM
Deployment diagram:
UML diagrams of this type serve to analyse the hardware used in system implementations, interaction between the processor and other components. As a rule, such diagrams are used in the beginning of designing to determine the hardware configuration of the system.

Pic.2. UML deployment diagram
Use the UML Deployment Diagram library to create such diagrams in ConceptDraw DIAGRAM
Statechart diagram:
Statechart diagrams serve to model possible states of the objects in the system. They also depict the sequence of actions required for transition between the states.
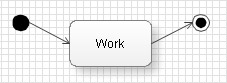
Pic.3. UML statechart diagram
Use the UML Statechart Diagram library to create such diagrams in ConceptDraw DIAGRAM
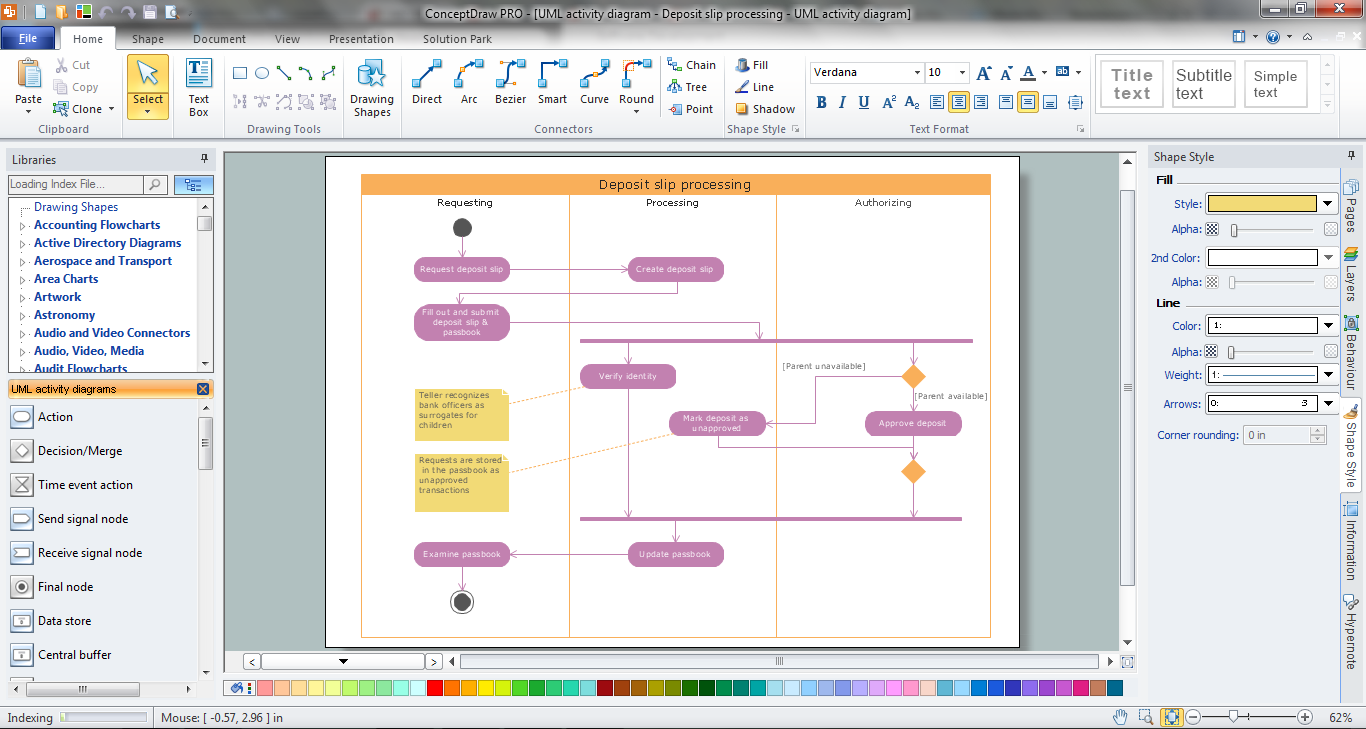
Activity diagram:
Same as Statechart diagrams, such diagrams show the states of objects in the system. The difference is that they can also depict forks for transitions from one state to another. These diagrams can be used to describe behavior algorithms of objects. You may also use them to create flow charts.

Pic.4. UML activity diagram
In ConceptDraw DIAGRAM such diagrams are represented in the UML Activity Diagram library.
Sequence diagram:
A type of interaction diagram. Sequence diagrams describe a sequence of interactions between objects.

Pic.5. UML sequence diagram
To draw such a diagram, use the UML Sequence Diagram library.
Collaboration diagram:
A collaboration diagram is also a type of interaction diagram, but unlike sequence diagrams these diagrams instead of the sequence of interactions between objects describe all variants of such interactions, regardless the sequence.

Pic.6. UML collaboration diagram
Class diagram:
They help to create graphical logical models of a system, further used to create the source code for the classes represented on the diagram.
UML class diagrams describe relationship between classes and interfaces. We recommend to create class diagrams using the Booch OOD template from the ConceptDraw STORE.

Pic.7. UML class diagram
Component diagram:
On diagrams of this type, also known as module diagrams, classes and objects are distributed by components or modules. This is very convenient for designing large systems which may count hundreds of components.

Pic.8. UML component diagram
Use the UML Component Diagram library for drawing diagrams of this type.
All libraries for creating UML diagrams are available inside the ConceptDraw DIAGRAM Templates and samples are located in the Rapid UML section of ConceptDraw STORE.

Pic.9. Rapid UML Solution in ConceptDraw STORE
TEN RELATED HOW TO's:
Every corporate network is unique, though there are guidelines and best practices in developing networks. As it is quite difficult to implement a pure topology within a company, using a hybrid network topology is considered a better solution. As a rule, such network assembles advantages and features of source topologies.
This diagram is an example of the Hybrid network. This type of network topology means a conjunction of other network topologies. Such as star-bus, ring-mesh topologies, etc. It should be obviously diverse networks. The final computer network inherits both advantages and disadvantages of its ingredients. Using the ConceptDraw Computer and Networks solution including vector graphic libraries and templates one can develop professional custom network diagrams of any topology and complexity.
Picture: Hybrid Network Topology
Related Solution:
Structured-systems analysis and design method uses data flow diagrams to represent the process of data flowing through a system. Talking about this might be useless without a proper example of DFD for online store (Data Flow Diagram). This DFD example shows all the distinctness that a diagram can bring into a scattered data structure.
Data flow diagrams are used to show how data is processed within some business processes. Making DFD is a common practice for business process modeling and analysis. This diagram represents the online store business flow. It describes inputs and outputs within online selling process and depicts the interactions between its participants. This DF diagram can be used by system analysts to create an overview of a business, to study and discover its inherent strengths and weak points.
Picture: Example of DFD for Online Store (Data Flow Diagram)
Related Solution:
Use ConceptDraw DIAGRAM software extended with Value Stream Mapping solution to create your own VSM diagrams.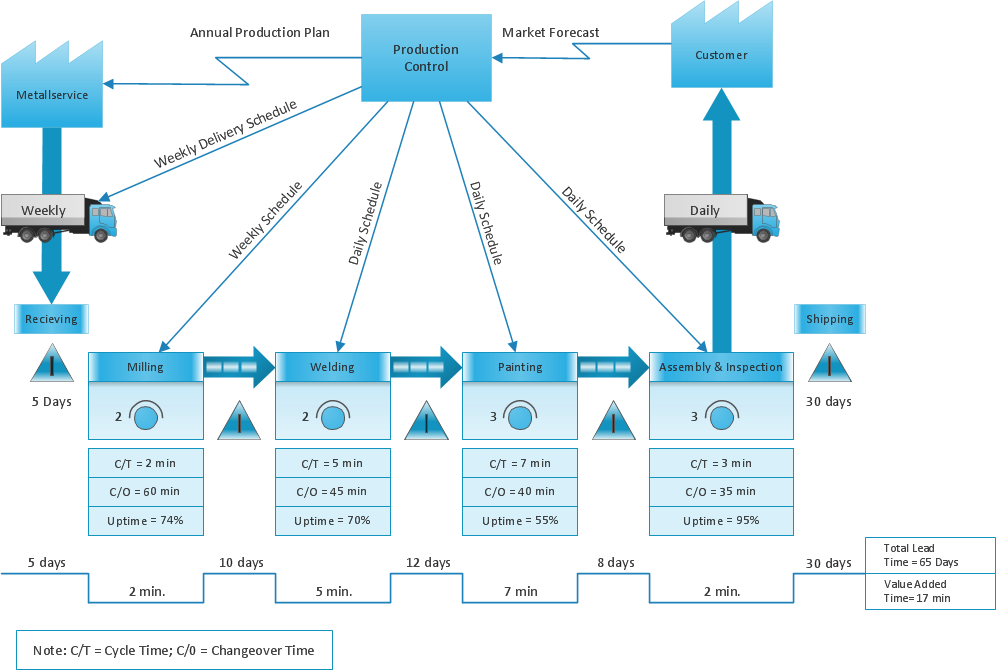
Picture: Create a Value Stream Map
Related Solution:
The network architecture and design specialization will help you gain the technical leadership skills you need to design and implement high-quality networks that support business needs.
Picture: Computer Network Architecture. Computer and Network Examples
ConceptDraw DIAGRAM Comparison with Omnigraffle Professional and MS Visio. All source ConceptDraw documents are vector graphic documents. They are available for reviewing, modifying, or converting to a variety of formats: PDF file, MS PowerPoint, MS Visio, and many other graphics formats.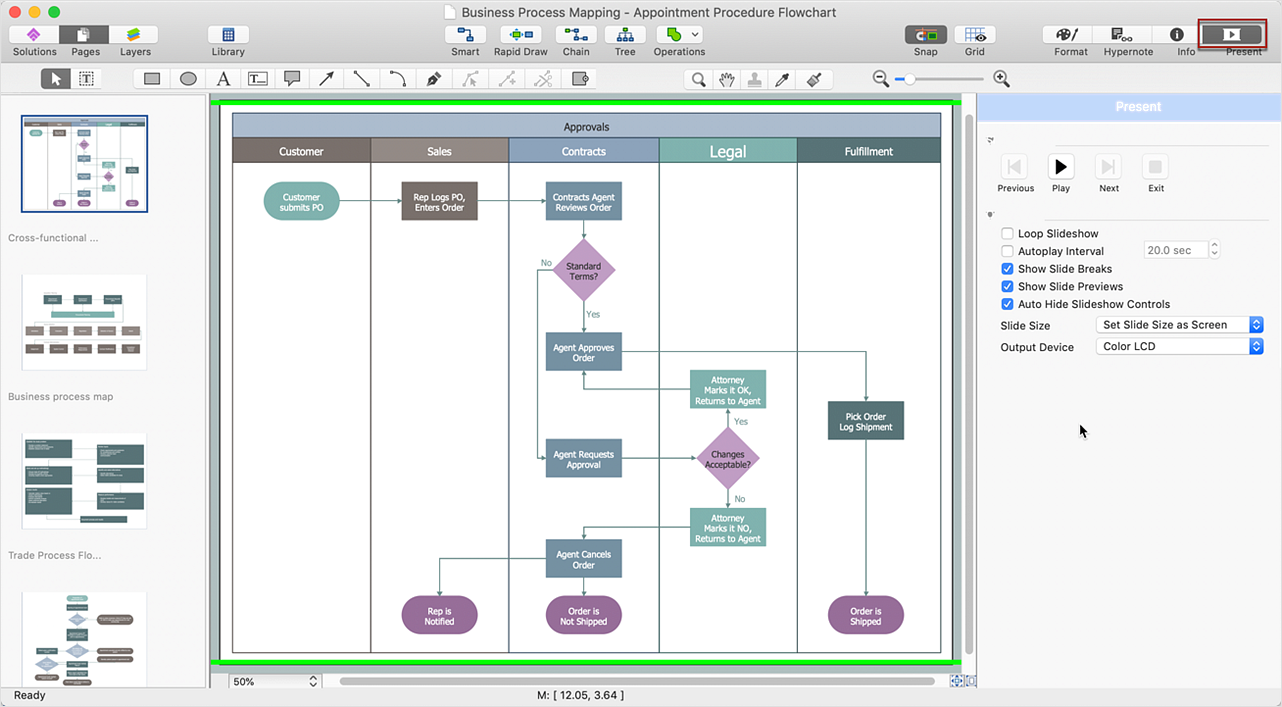
Picture: ConceptDraw DIAGRAM Comparison with Omnigraffle Professional and MS Visio
Related Solution:
ConceptDraw solution Computer and Networks provides Interactive Voice Response samples, templates and library of 35 vector stencils for drawing the IVR network diagrams.
Use ConceptDraw DIAGRAM diagramming and vector drawing software enhanced with solution Computer and Networks to visualize the logical and physical structure of IVR systems for inbound and outbound call centers and voice mail systems.
Picture: Interactive Voice Response Network Diagram
This sample shows the concept of working of the transport company and is used by transport companies, carriers at the transportation of various goods.
Picture: UML Class Diagram Example for GoodsTransportation System
Related Solution:
Sales process management is a business discipline which focuses on the development and practical application of various sales techniques, and on the management of sales operations of the company.
It is effective to use professional software for the sales process management. ConceptDraw DIAGRAM diagramming and vector drawing software extended with Sales Flowcharts solution from the Marketing area of ConceptDraw Solution Park is the best choice.

Picture: Sales Process Management
Related Solution:
In ConceptDraw DIAGRAM it really is sp simple to draw even the most complex cross-functional flowcharts. Use the RapidDraw technology and Cross-Functional libraries in ConceptDraw DIAGRAM for the best results.
Picture: How to Simplify Flow Charting — Cross-functional Flowchart
Related Solution:
Teams working with Scrum methodology use the product backlog items (PBIs), bug work item types (WITs), reports and dashboards. SCRUM Workflow solution for ConceptDraw DIAGRAM software offers collection of samples, variety of predesigned objects, clipart and graphic elements, a set of Scrum process work items and workflow which are developed for agile teams working using Scrum.
Picture: Scrum process work items and workflow
Related Solution:
