_Win_Mac.png)
Example 1. Fishbone Software Tools for Design Element
Design of Fisbone Diagram begins from the defining an effect or problem and representing it as a fish head. Then you need define the groups of factors that led to the occurrence of a given problem and to draw them as bones on horizontal line - a fish spine. These causes are often defined during brainstorming sessions (we recommend to use the ConceptDraw MindMap for brainstorming). In turn, for each group of factors if needed can be also indicated 2-3 causes leading to the problem. Thus are constructed usually 3-4 levels.
Follow all these steps fast and easy thanks to the predesigned elements of Fishbone Diagrams library from Fishbone Diagrams Solution for ConceptDraw DIAGRAM software.

Example 2. Fishbone Diagram - Causes of Low Quality Output
The Fishbone Diagram samples you see on this page were created in ConceptDraw DIAGRAM using the powerful tools of Fishbone Diagrams Solution. An experienced user spent 10 minutes creating each of these samples.
Use the Fishbone Diagrams Solution for ConceptDraw DIAGRAM Solution Park for quick, easy and effective cause and effect analysis and problem solving.
All source documents are vector graphic documents. They are available for reviewing, modifying, or converting to a variety of formats (PDF file, MS PowerPoint, MS Visio, and many other graphic formats) from the ConceptDraw STORE. The Fishbone Diagrams Solution is available for all ConceptDraw DIAGRAM or later users.
TEN RELATED HOW TO's:
Flowcharts can be used in designing and documenting both simple and complex processes or programs and, similar to the other types of diagrams, they can help visualize what happens and so help understand some definite process, and, as a result, find flaws, bottlenecks and other features within it.
Picture: Flowchart Programming Project. Flowchart Examples
Related Solution:
ConceptDraw DIAGRAM diagramming and vector drawing software offers the School and Training Plans Solution from the Building Plans Area with extensive drawing tools, predesigned vector shapes and samples which are convenient for using as is or as classroom seating chart template.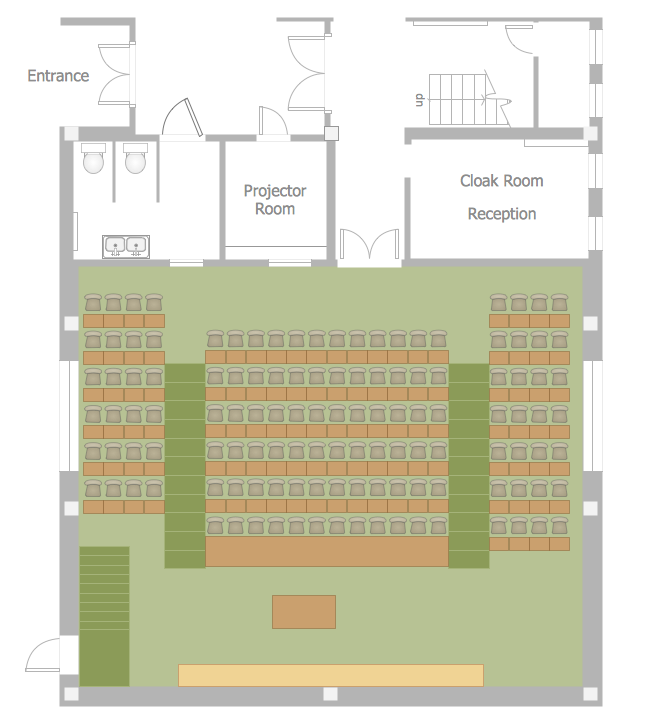
Picture: Classroom Seating Chart Template
Related Solution:
ConceptDraw DIAGRAM is a powerful tool that helps you create professional looking cross-functional flowcharts with the well-designed objects. ConceptDraw DIAGRAM - Drawing Software for Vertical Cross Functional Flowchart. ConceptDraw allows you to focus on work, not the drawing process. ConceptDraw Arrows10 Technology allows to draw connectors with smart behavior that gives flexibility to you during work process.
Picture: Vertical Cross Functional Flowchart
ConceptDraw map templates are great starting points to identify, track, and address quality initiatives in your organization.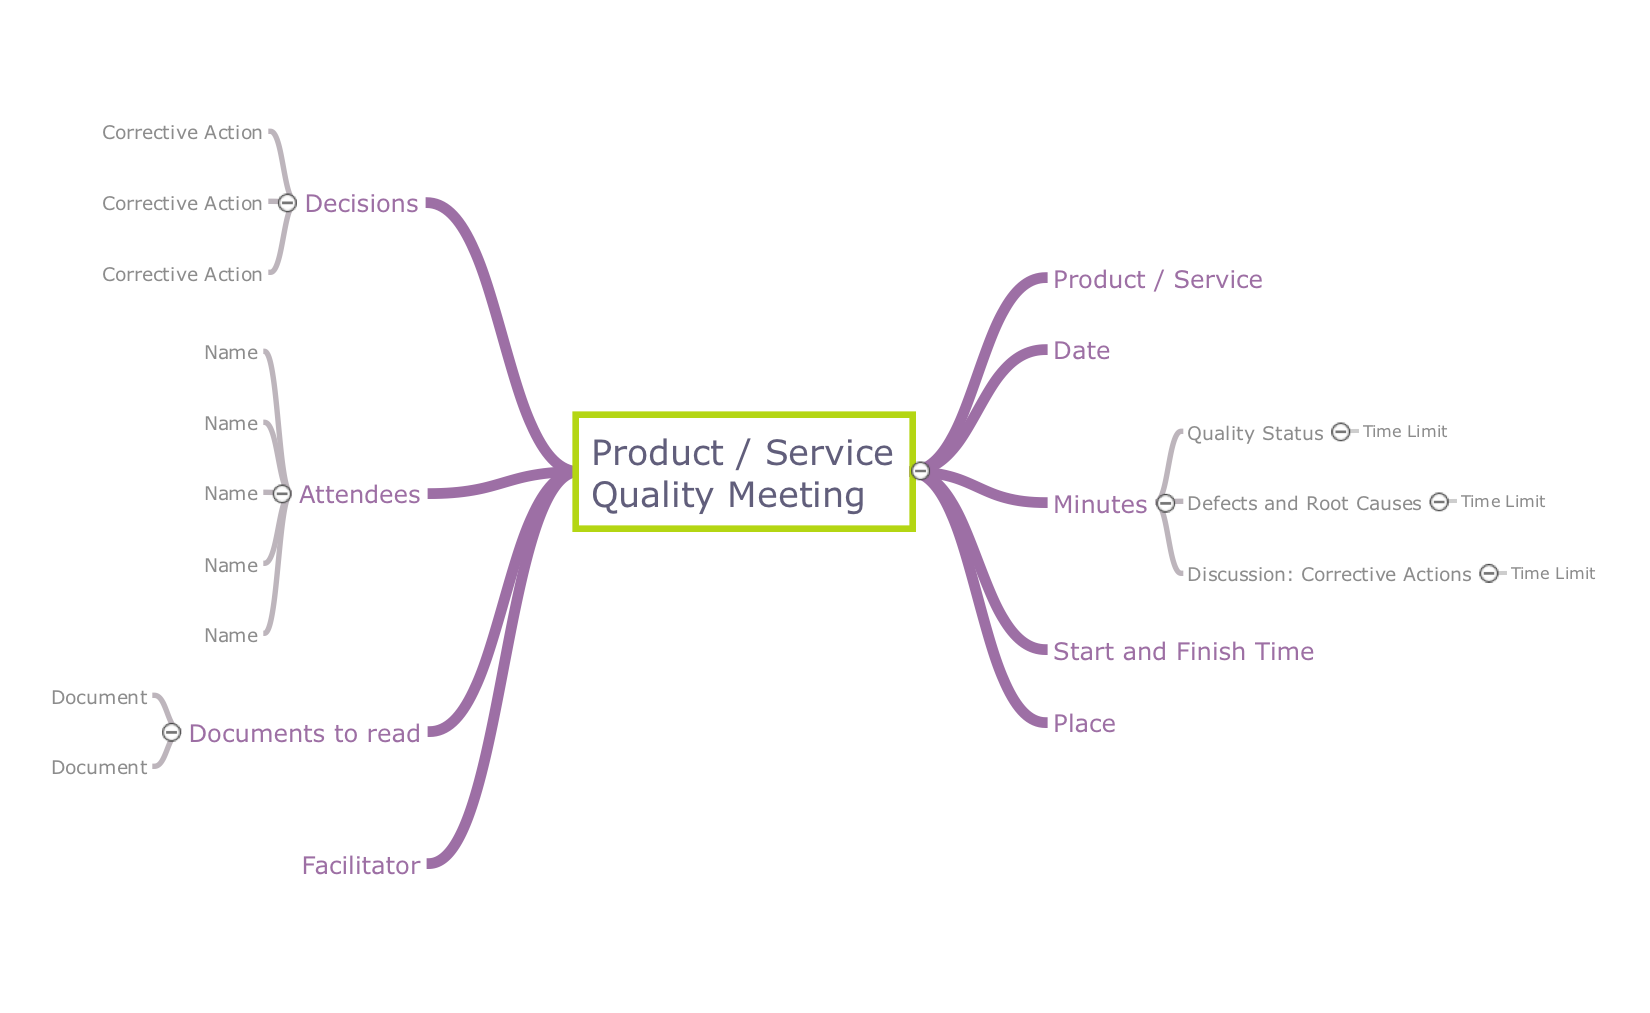
Picture: Quality Mind Maps
Related Solution:
The visual form of mind maps is helpful in all stages of quality management, from describing problem to describing and documenting a decision.
Picture: Quality Project Management with Mind Maps
Related Solution:
ConceptDraw DIAGRAM diagramming and vector drawing software extended with unique SCRUM Workflow solution from the Project Management area of ConceptDraw Solution Park allows fast and easy design professional-looking Scrum Workflow Diagrams and Scrum workflow scheme for projects required when working on projects and managing them, when developing software with cutting-edge Agile methodologies.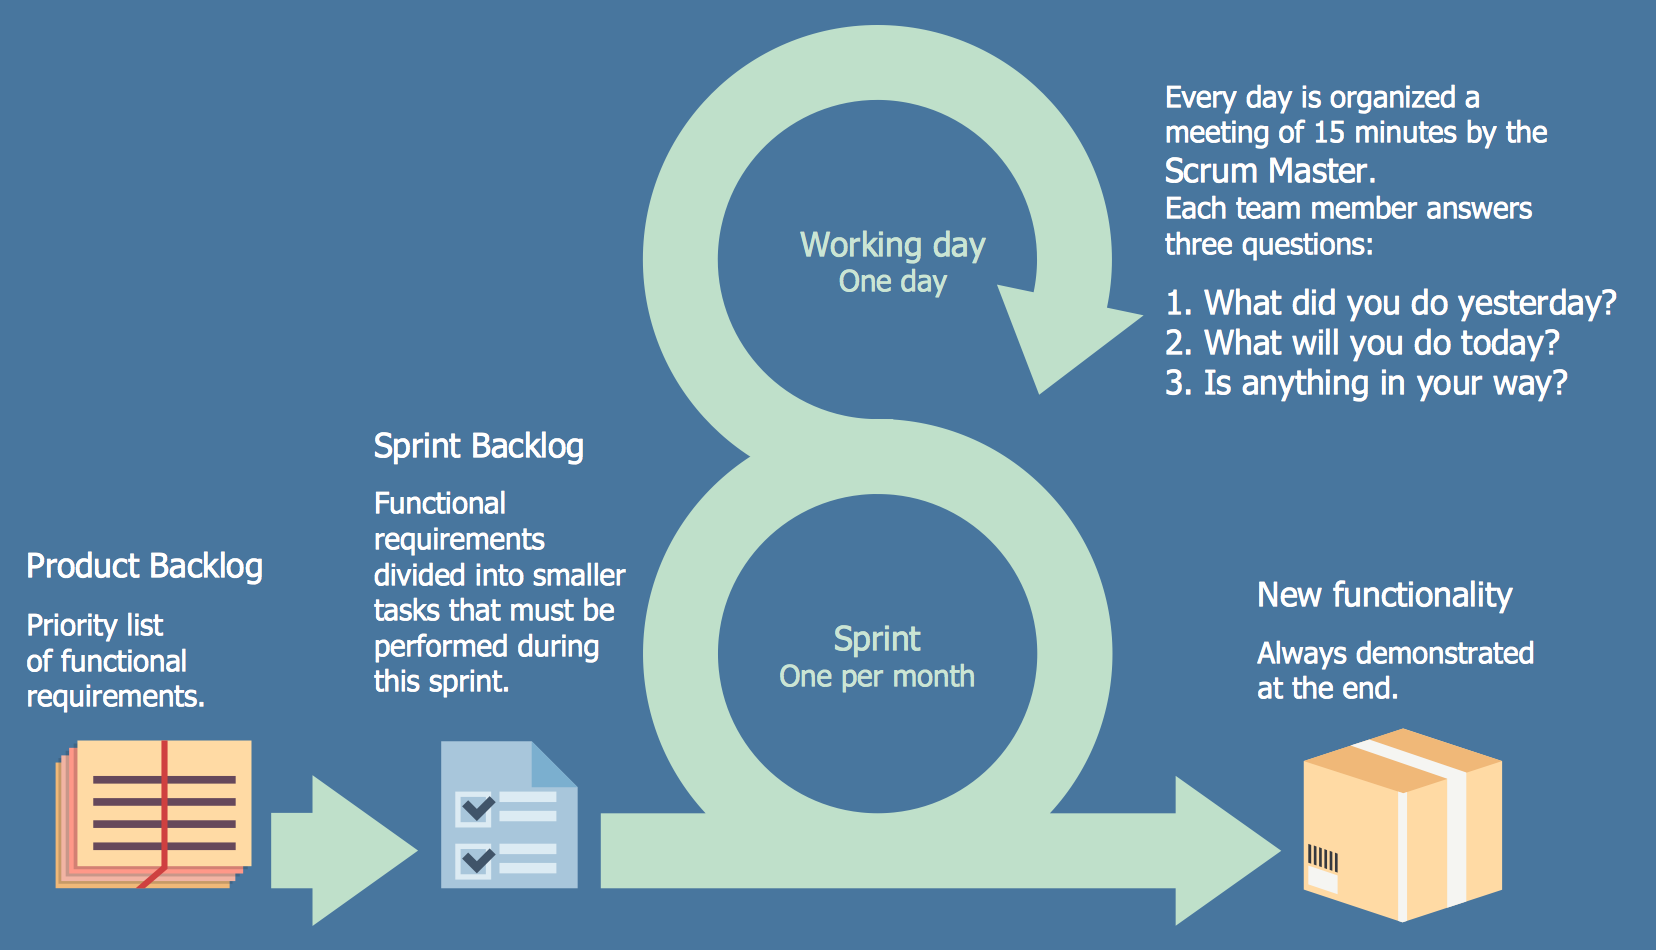
Picture: Scrum workflow
Related Solution:
ConceptDraw DIAGRAM extended with Floor Plans Solution from the Building Plans Area is a quick floor plan software for creating great-looking floor plans, floor charts and blueprints for facilities management, move management, office supply inventories, assets inventories, office space planning, and cubicles.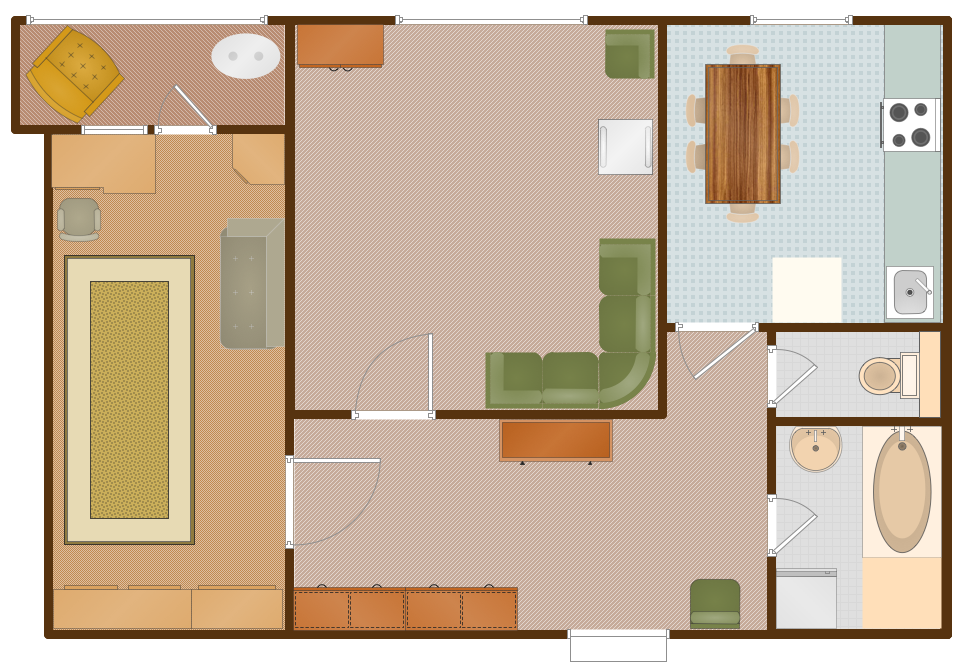
Picture: Floor Plan
Related Solution:
The knowledge and ability to apply various strategies for dealing with problems and difficult situations is very useful in many areas. The Fishbone strategy is one of the most progressive. This graphical technique helps to identify possible causes of problems, to set the goals, and also show internal connections between the different parts of problem. After reviewing all causes and facts, you can easily find right solution.
ConceptDraw DIAGRAM diagramming and vector drawing software extended with Fishbone Diagrams Solution from the Management Area of ConceptDraw Solution Park is a powerful Fishbone Problem Solving tool.
Picture: Fishbone Problem Solving
Related Solution:
A database is a data collection, structured into some conceptual model. Two most common approaches of developing data models are UML diagrams and ER-model diagrams. There are several notations of entity-relationship diagram symbols and their meaning is slightly different. Crow’s Foot notation is quite descriptive and easy to understand, meanwhile, the Chen notation is great for conceptual modeling.
An entity relationship diagrams look very simple to a flowcharts. The main difference is the symbols provided by specific ERD notations. There are several models applied in entity-relationship diagrams: conceptual, logical and physical. Creating an entity relationship diagram requires using a specific notation. There are five main components of common ERD notations: Entities, Actions, Attributes, Cardinality and Connections. The two of notations most widely used for creating ERD are Chen notation and Crow foot notation. By the way, the Crow foot notation originates from the Chen notation - it is an adapted version of the Chen notation.
Picture: ERD Symbols and Meanings
Related Solution:
Rack Diagrams visualize the rack mounting of computer and network equipment as the drawing of frontal view of the rack with equipment installed. They are used for choosing the equipment or racks to buy, and help to organize equipment on the racks virtually, without the real installation.
Network Diagramming Software - ConceptDraw DIAGRAM is perfect for software designers and software developers who need to draw Rack Diagrams._Win_Mac.png)
Picture: Network Diagramming Software for DesignRack Diagrams
Related Solution:
