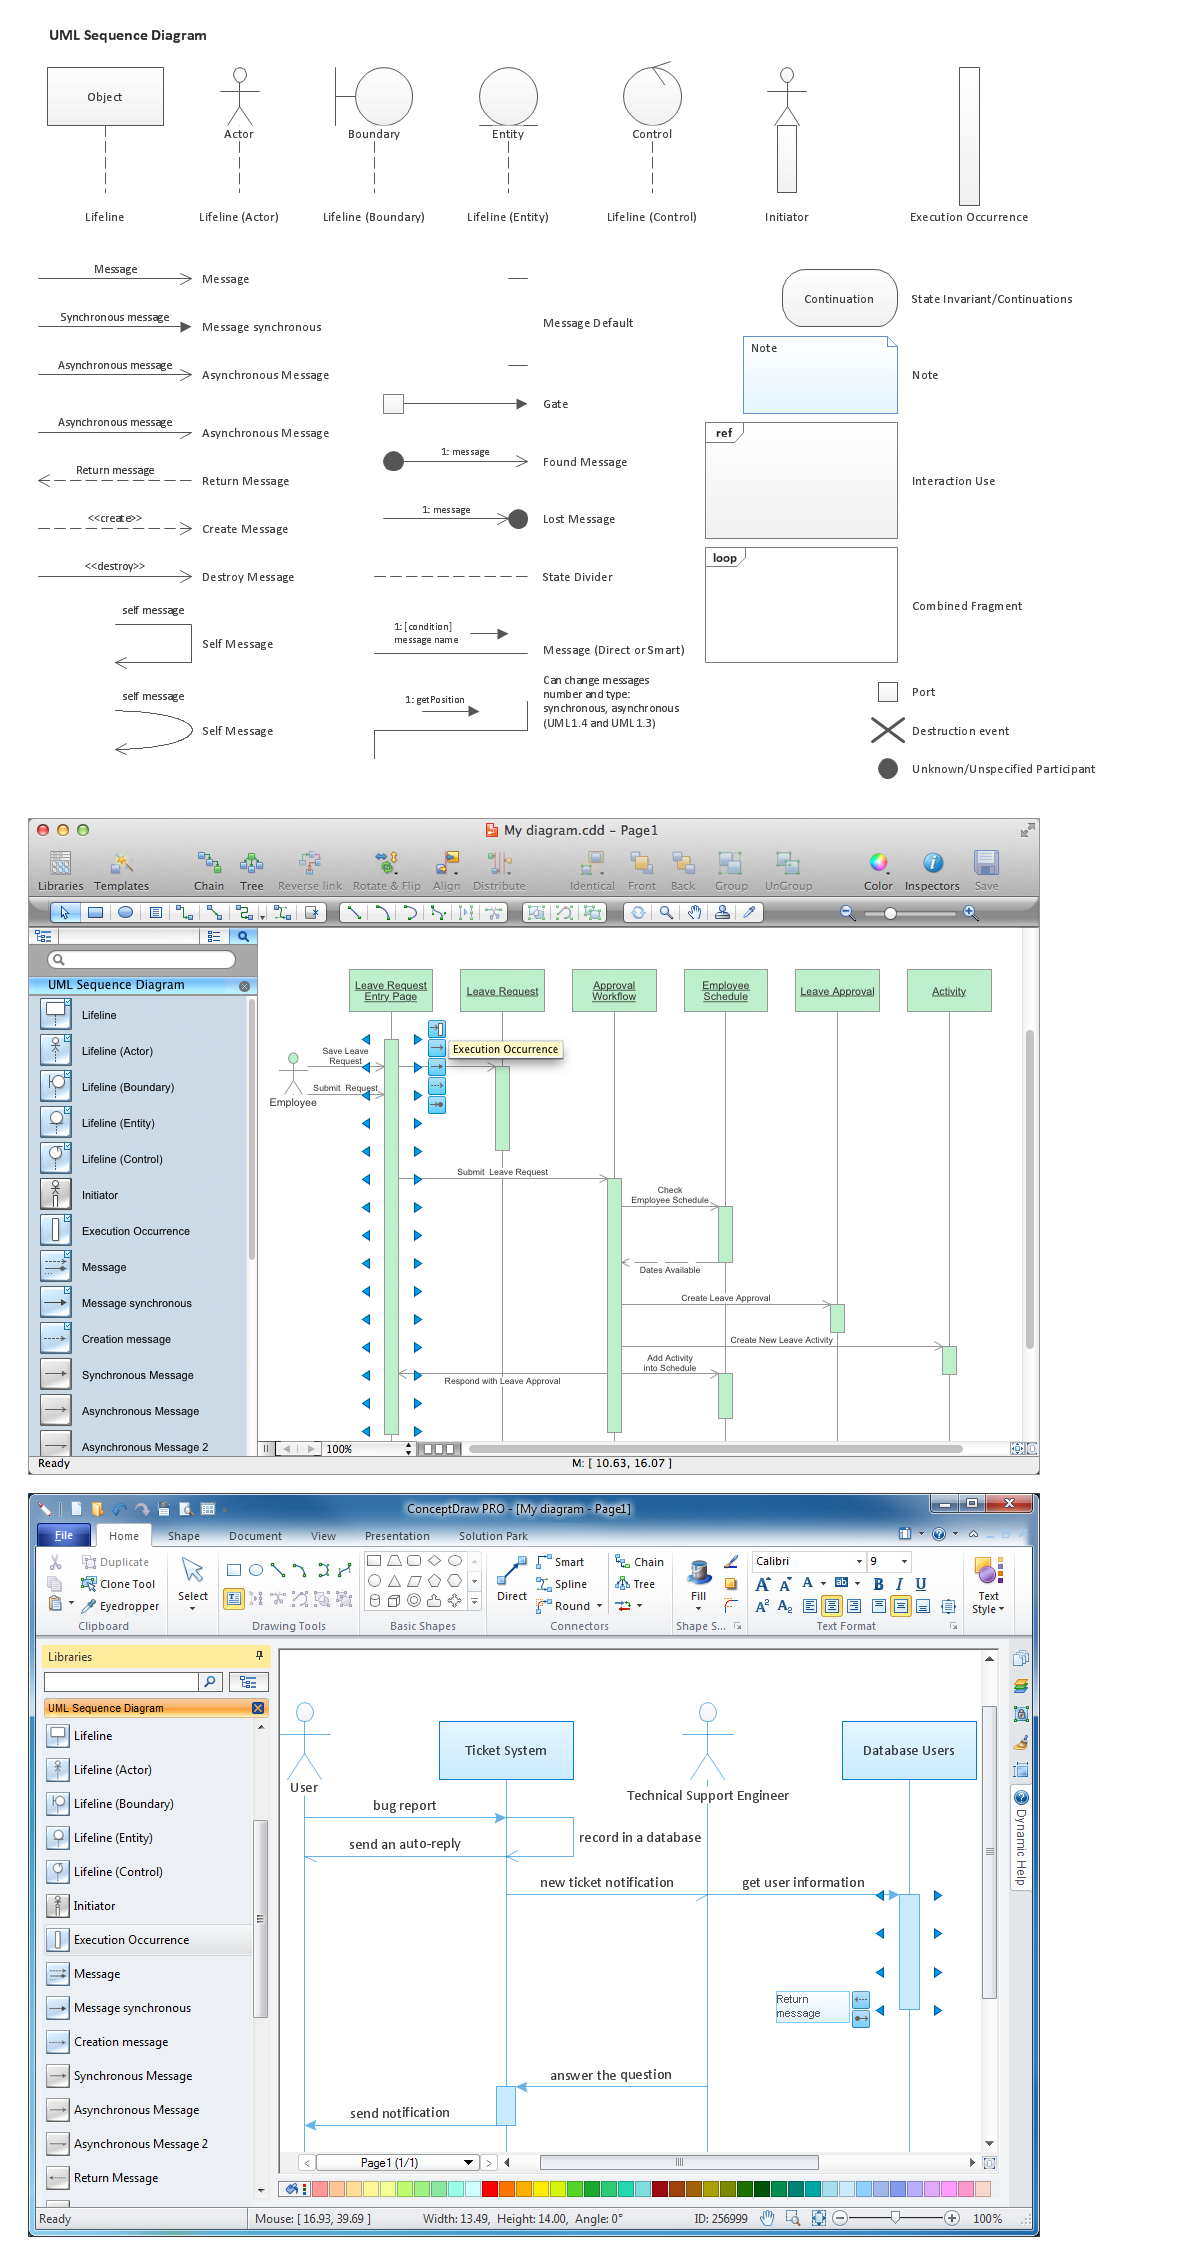
ConceptDraw Rapid UML solution provides UML Sequence Diagram library of vector stencils for UML sequence diagram elements like lifelines and message arrows.
Use the UML Sequence Diagram library to draw your own UML sequence diagrams that show process interactions as messages exchange arranged in time sequences during runtime scenarios.
All libraries for creating UML diagrams are available inside the ConceptDraw DIAGRAM Templates and samples are located in the Rapid UML section of ConceptDraw STORE.

TEN RELATED HOW TO's:
The diagrams with highest level in the hierarchy define the main processes or subsystems with external and internal data sources. To detail them, DFD Library is used to build a system of lower level diagrams. This decomposition continues hereinafter it is meaningless.
This data flow diagram of a system of a library management is a context-level DFD. The data flow diagram of this type depicts the large system as a solid process, and does not input any explanation of its content. It is an ordinary practice - creation of a context-level data flow diagram when starting system development. This DFD was made using ConceptDraw solution designed especially for data flow diagrams development. One can find out Data Flow Diagrams Solution in a Solution Park of ConceptDraw and can use in as addition to the common Conceptdraw DIAGRAM diagramming tools.
Picture: DFD Library System
Related Solution:
This sample shows the UML Class Diagram of Learning Object Metadata (LOM) base schema. The classes represented as boxes with attributes and are connected with associations. You can see the composition associations on this diagram. The associations are indicated with the multiplicities 0..1, 0..*. This sample can be used in electrical and electronics engineering.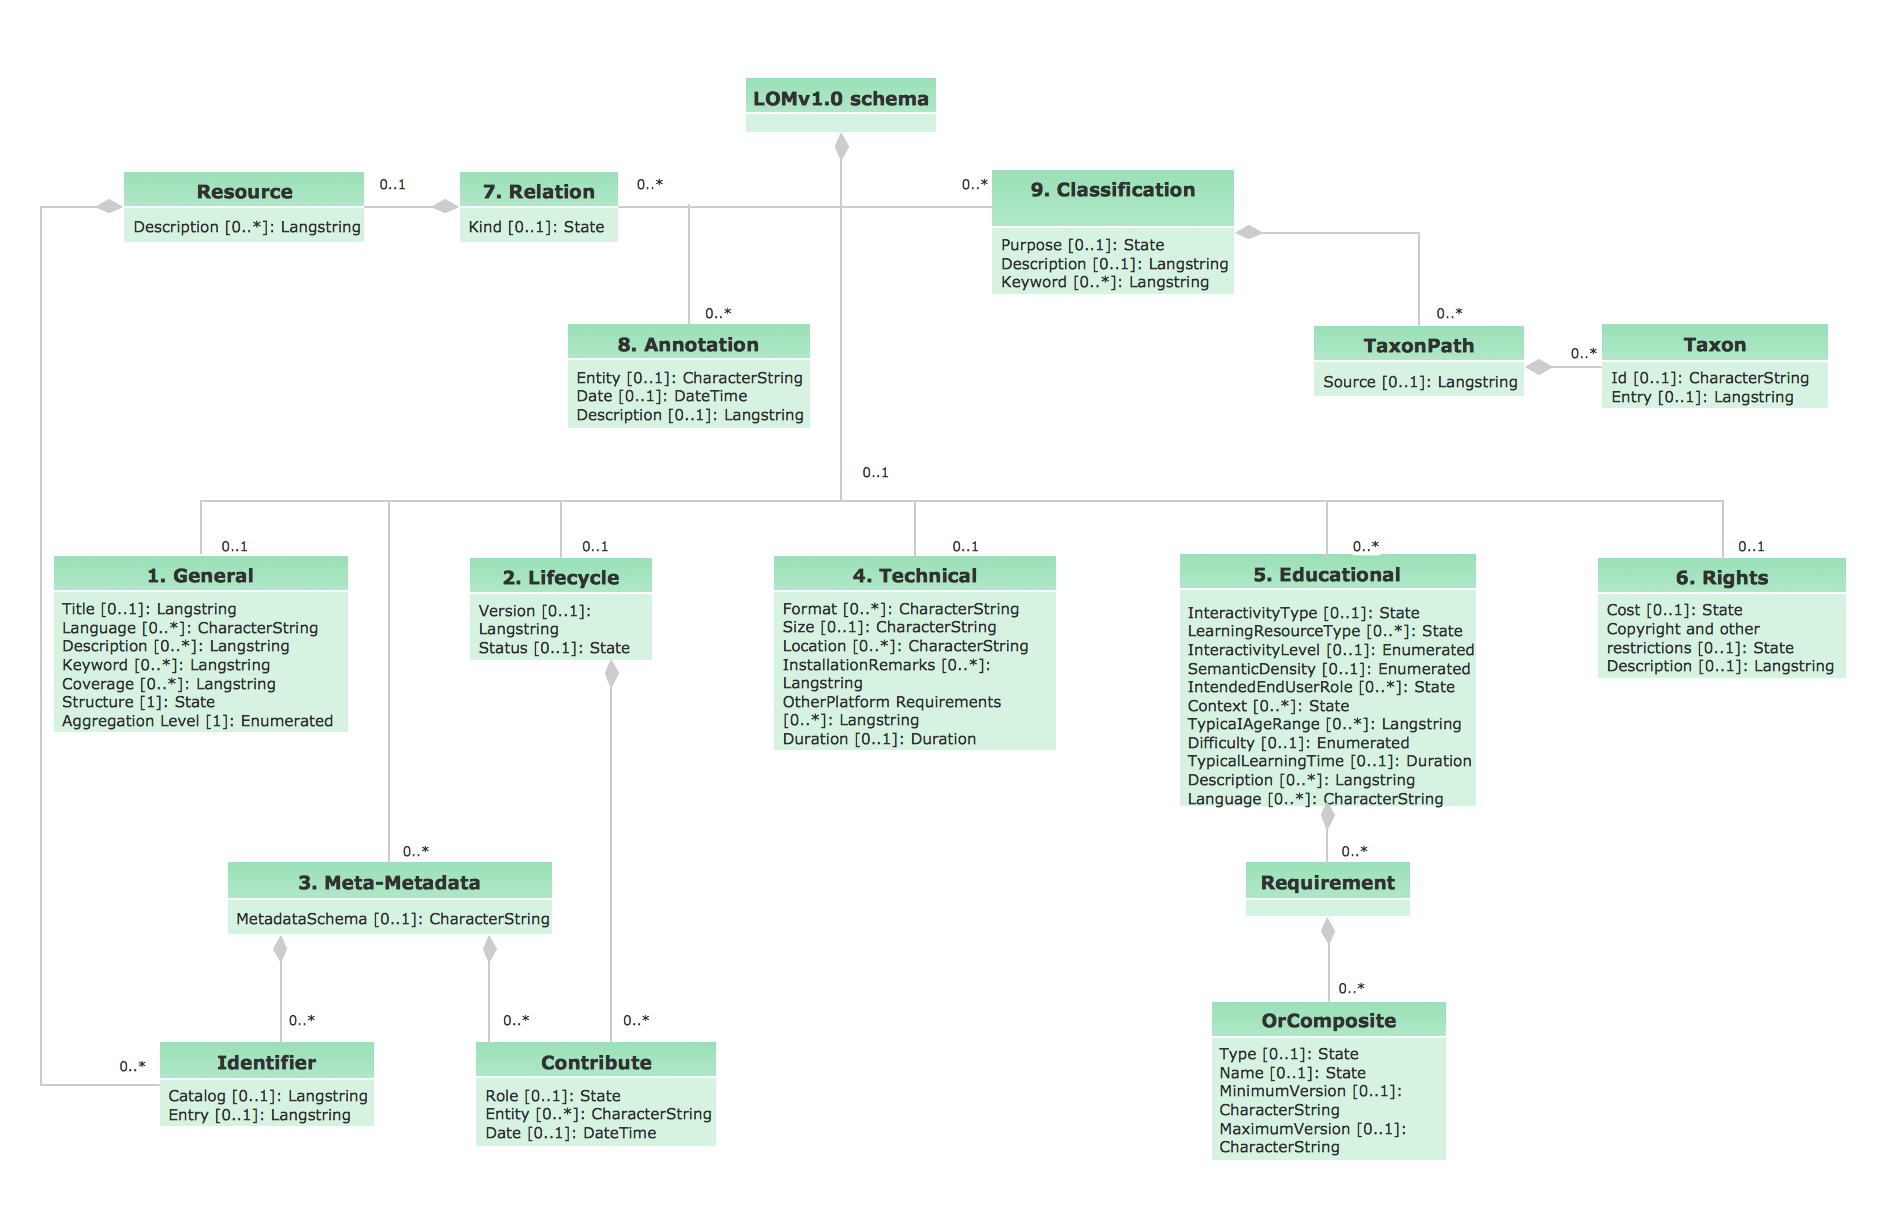
Picture: UML Diagram Editor
Related Solution:
ConceptDraw DIAGRAM is perfect for software designers and software developers who need to draw Network Active Directory Diagrams.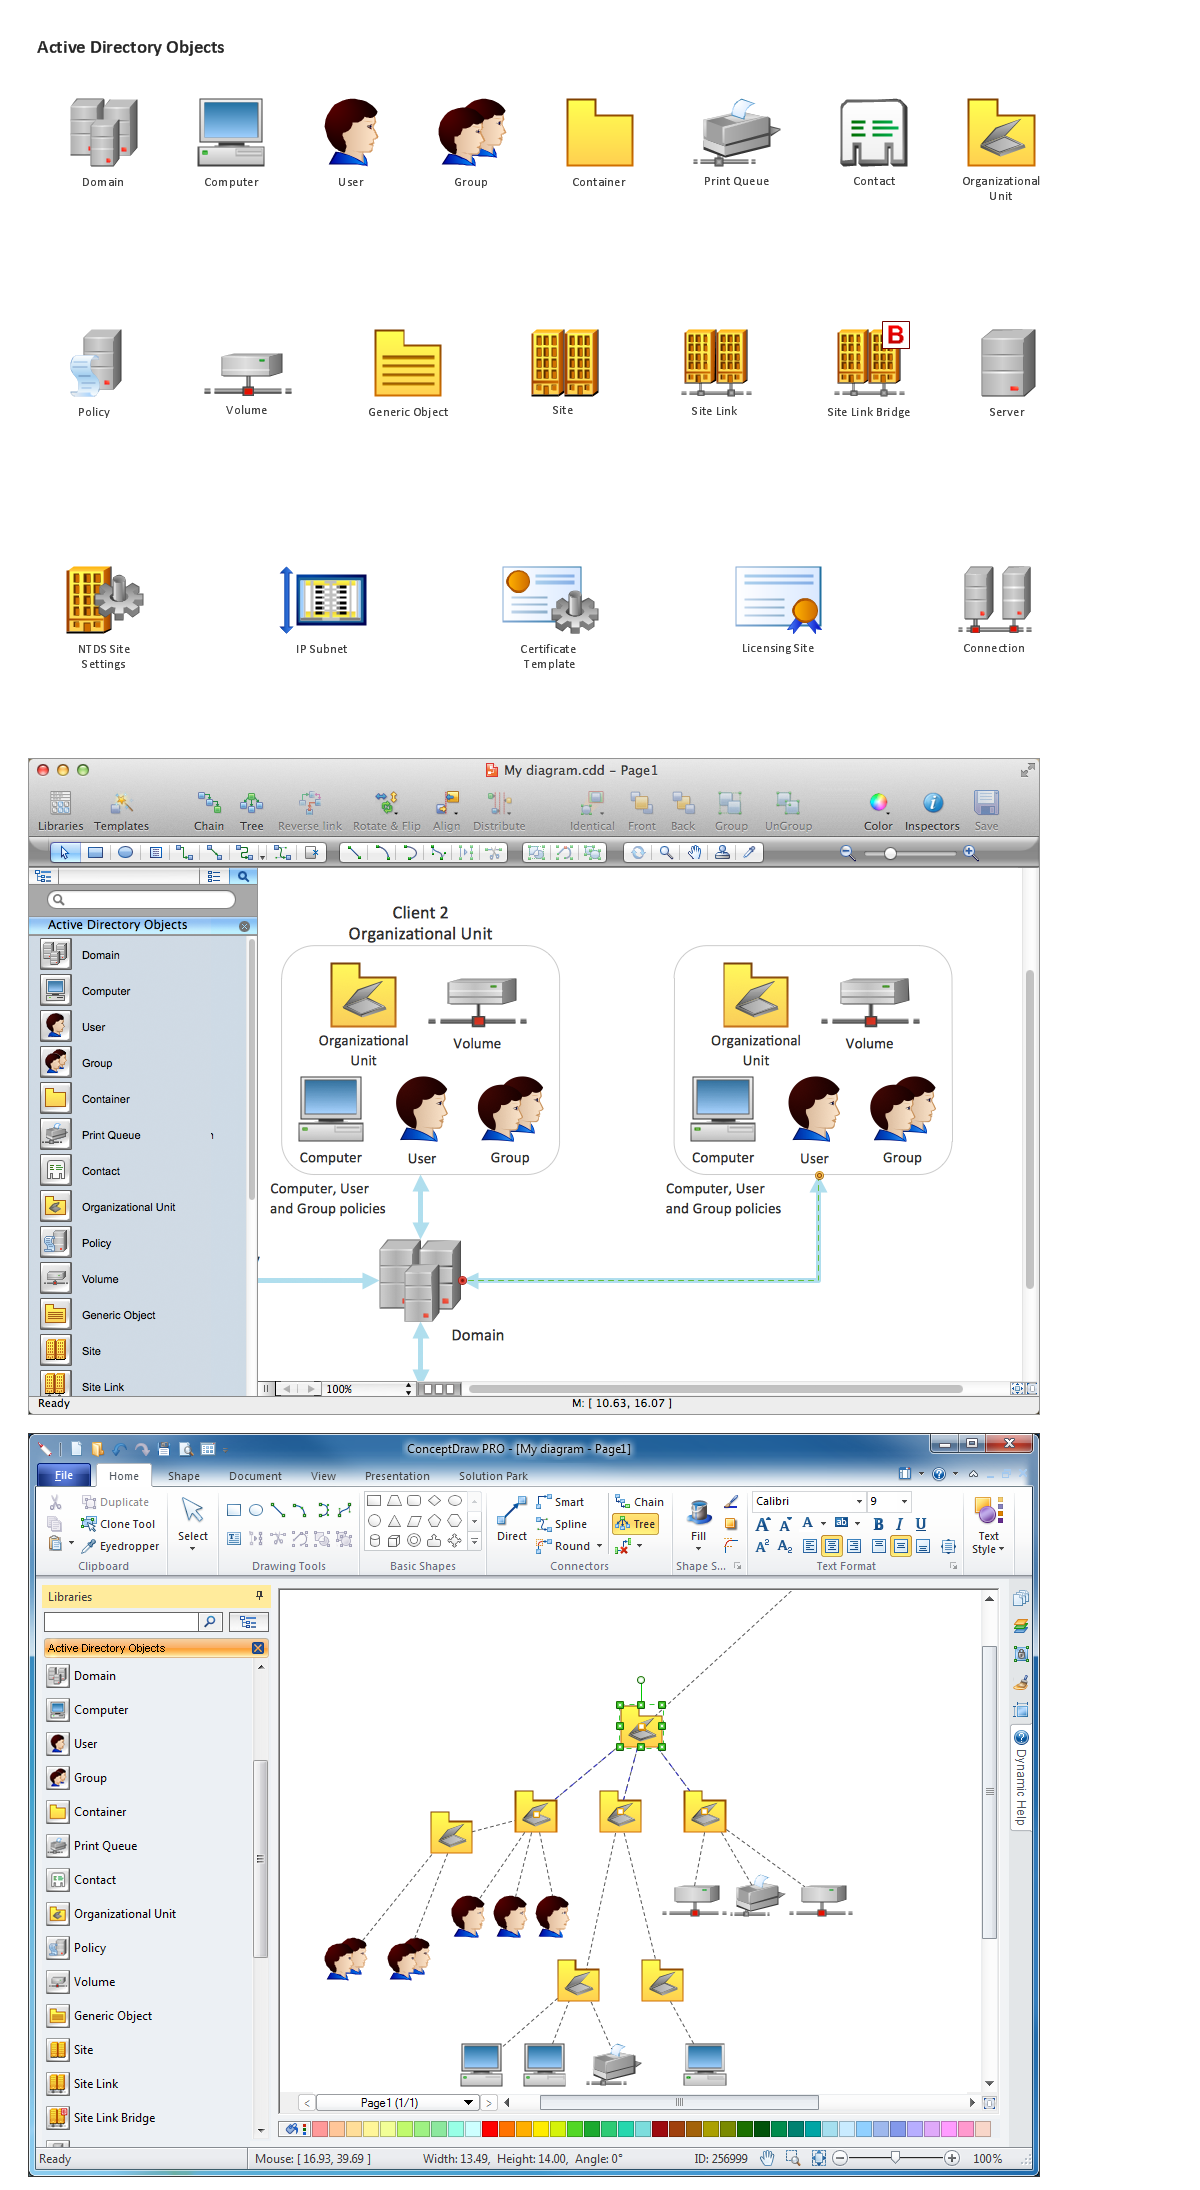
Picture: Network Diagramming Software for Network Active Directory Diagrams
The UML Diagrams are widely used by software developers and software engineers. They can draw the UML Diagrams manually on the paper, but it is incredibly convenient to use the special UML diagramming software. The UML diagramming software allows you to draw the UML Diagrams in a few minutes.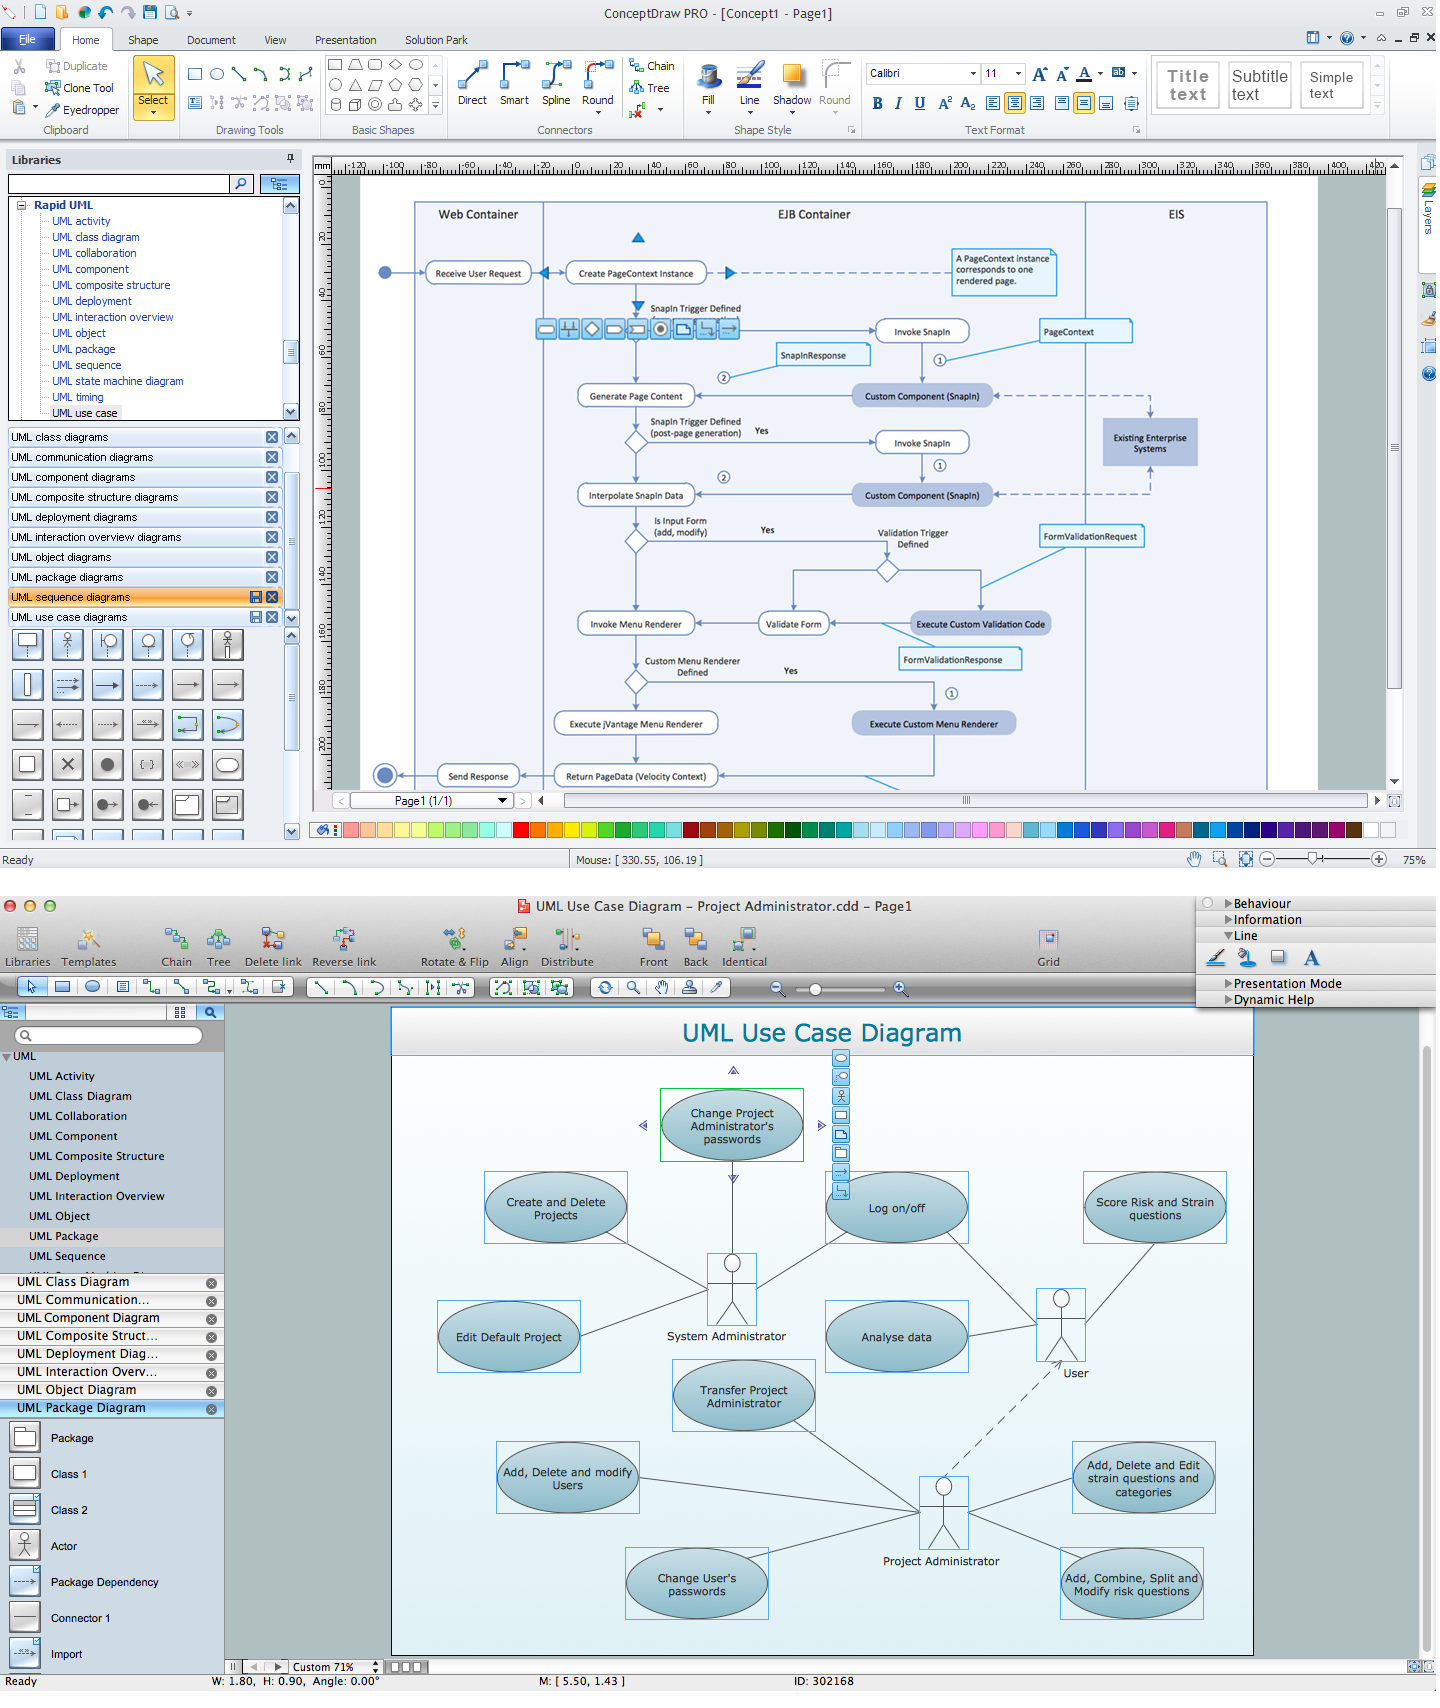
Picture: UML Diagramming Software
Related Solution:
This sample was created in ConceptDraw DIAGRAM diagramming and vector drawing software using the UML Use Case Diagram library of the Rapid UML Solution from the Software Development area of ConceptDraw Solution Park.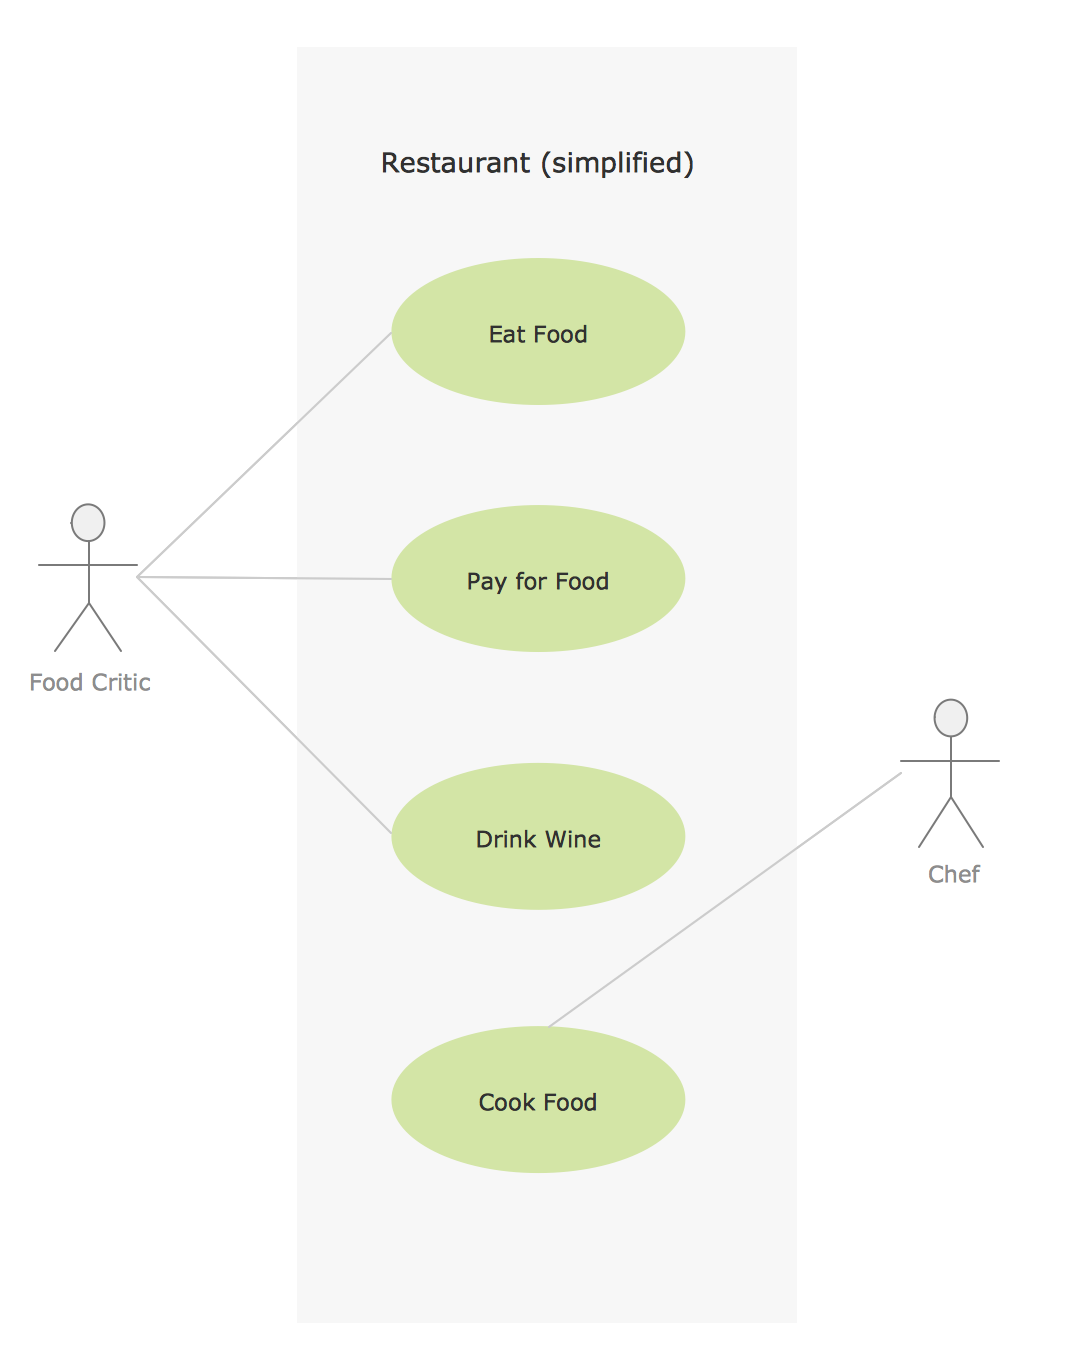
Picture: Sample for UML
Related Solution:
Use Case Diagrams describes the functionality provided by a system in terms of actors, their goals represented as use cases, and any dependencies among those use cases.
Picture: Diagramming Software for Design UML Use Case Diagrams
The Building Plans are very useful and even necessary for architects, builders, designers and simple for those who want to build the home, office, flat or anyone other building. They are also convenient for those who want to design or redesign the home, flat, room, etc.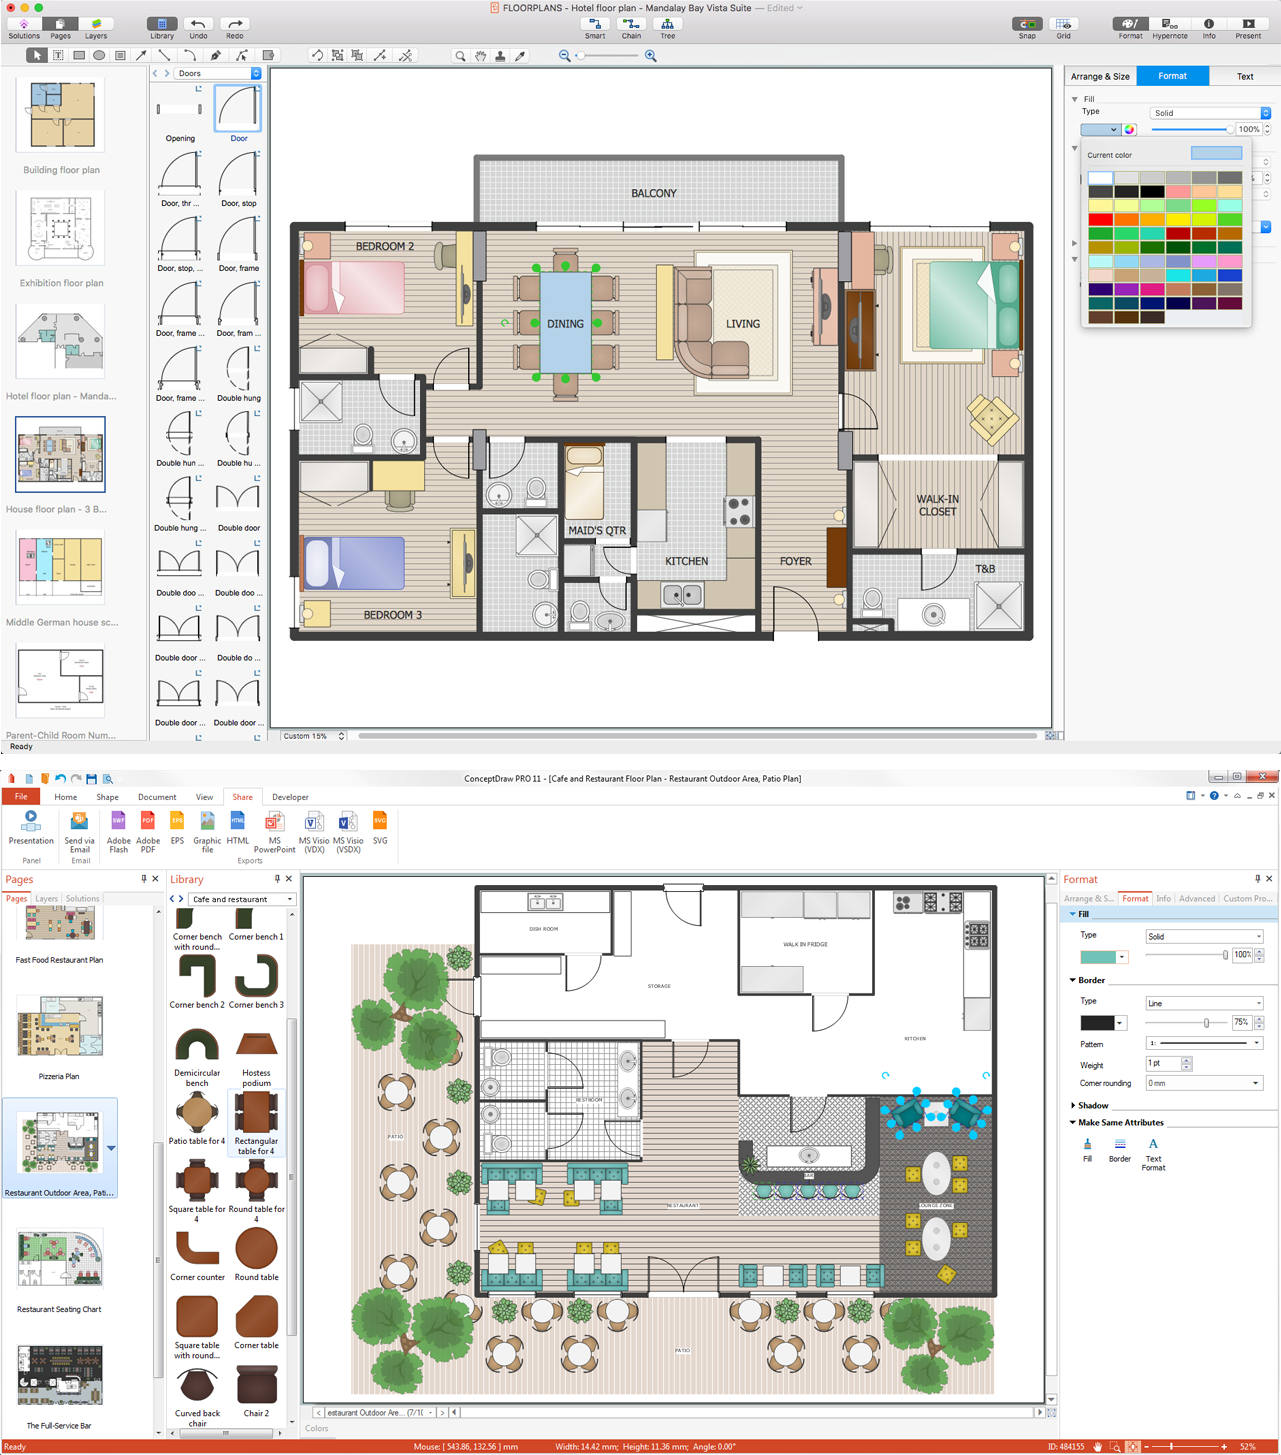
Picture: Building Plan Software. Building Plan Examples
Related Solution:
Drawing an electric circuit plan with all the wiring might seem very complex. If you ever felt afraid to ask how to use electrical and telecom plan software, then it’s time to actually start from altering the templates from the Solution Park. You won’t even notice the moment when you would become an experienced user.
This electrical and telecommunication floor plan plan presents electrical and telecommunication devices located in a country house floor plan. Each electrical or telecom device on this plan is indicated with the particular symbol. Using standard Electrical and Telecommunication symbols makes this floor plan clear for anybody who will be involved into construction process. All the electrical and telecom symbols used in the current floor plan are placed to a legend. This electrical and telecom floor plan can be included as a separate piece into a package of building documentation.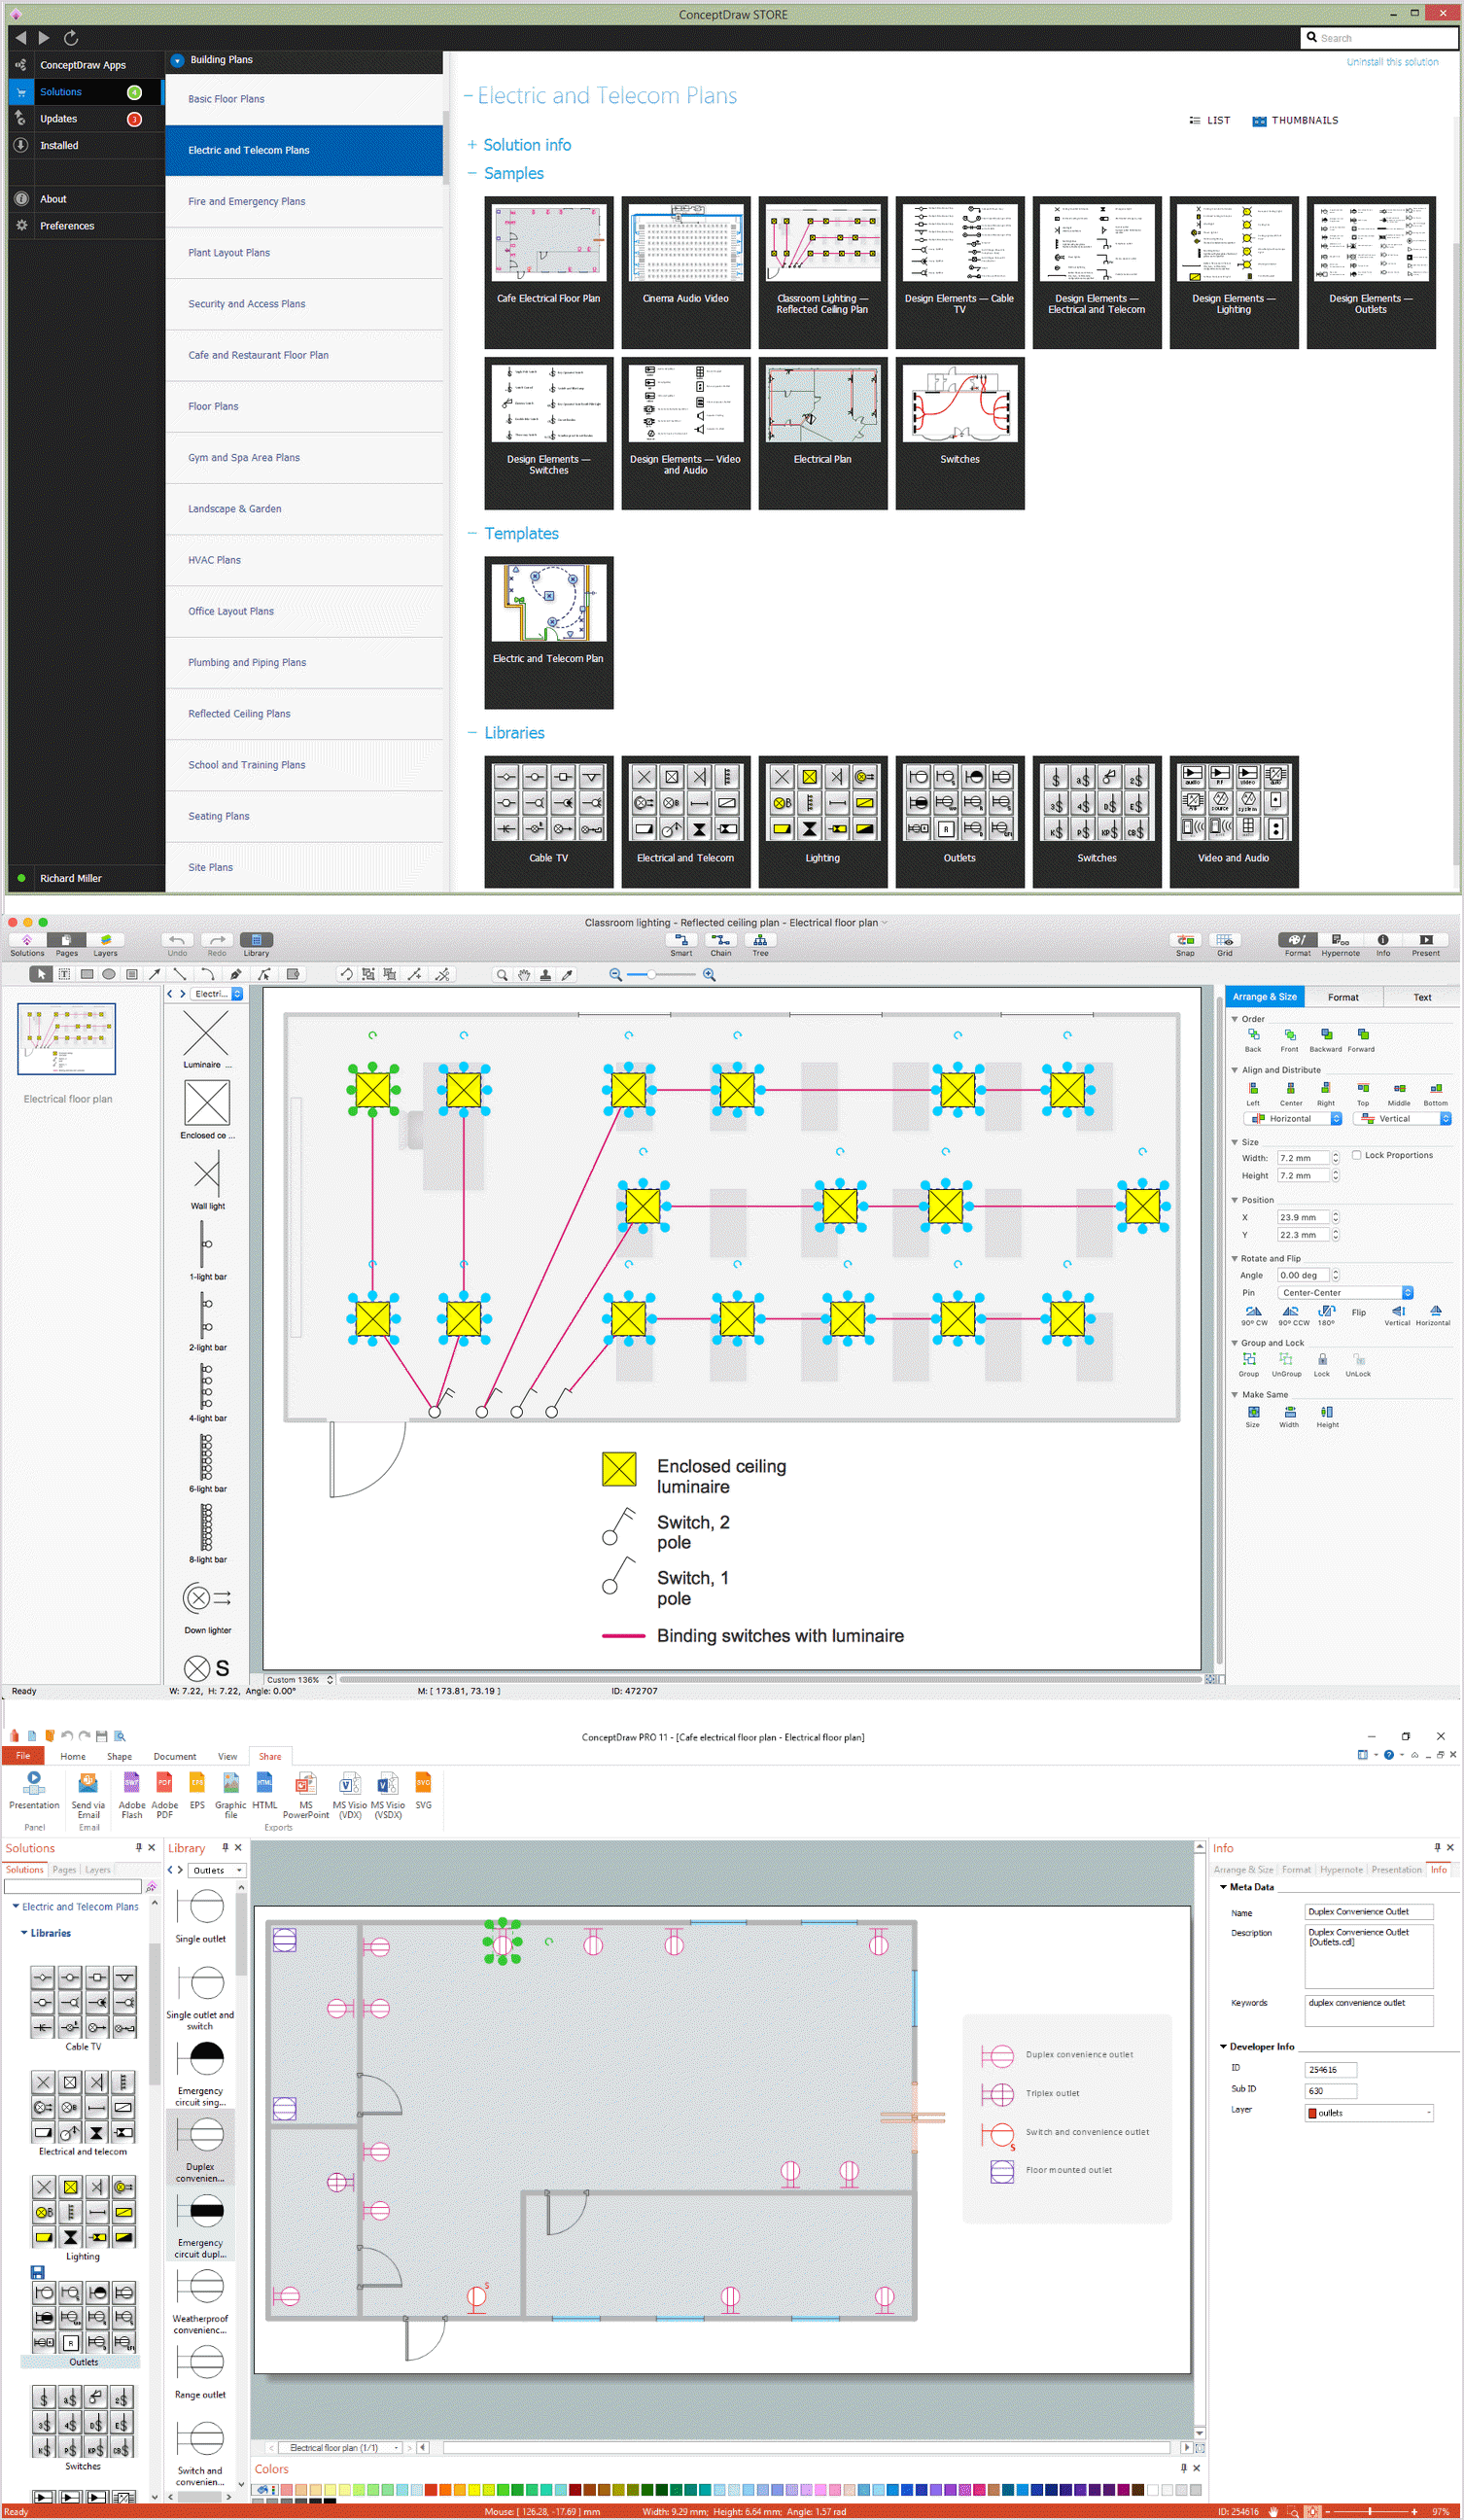
Picture: How To use Electrical and Telecom Plan Software
Related Solution:
Successful quality management implemented in a company of any size is a critical component of a company organization.
Picture: What is a Quality Management
Related Solution:
ConceptDraw DIAGRAM Software is a cross-platform flowcharting tool with extended HTML capabilities. It contains more than 10 000 pre-created objects and many templates, available for PC and Macintosh.
Creating great designs and diagrams involves having the right drawing software. ConceptDraw is the business diagram software of choice for business professionals who need to quickly and easily visualize, explore, and communicate information.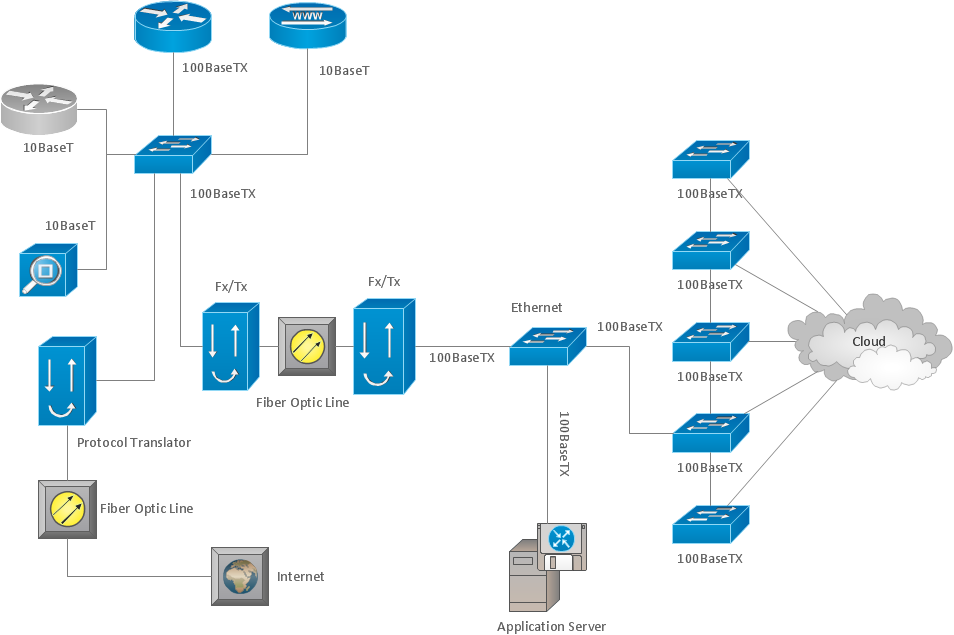
Picture: Business and Software Diagrams

