
Example 1. When To Use a Fishbone Diagram
When you need create a Fishbone diagram as quickly as possible, you can use one of ConceptDraw templates. Fishbone templates are offered in large quantity by Fishbone Diagrams solution at ConceptDraw STORE, moreover for both ConceptDraw DIAGRAM and ConceptDraw MindMap applications.
You can draw a Cause and Effect diagram fully at ConceptDraw DIAGRAM If you prefer to use brainstorming technique when creating, you can use the ConceptDraw MindMap application and then output your mind map as Fishbone diagram to ConceptDraw DIAGRAM document.

Example 2. Well Constructed Fishbone Diagram - HAN Project
Fishbone Diagrams Solution provides also variety of samples and examples of Fishbone diagrams, and Fishbone Diagrams library with predesigned vector objects for self-drawing.
You can also benefit from the ConceptDraw DIAGRAM wide export capabilities, just a few seconds you can export your Ishikawa diagram to PDF, PPT, HTML, Visio, or any from variety of graphic formats.

Example 3. Export Fishbone Diagram to PDF, PPT, HTML and Visio
The samples you see on this page were created in ConceptDraw DIAGRAM using the predesigned objects from the Fishbone Diagrams library. They show some cases when to use a Fishbone Diagram is effective and reasonable. An experienced user spent 10 minutes creating each of these samples.
Use the tools of Fishbone Diagrams Solution for ConceptDraw DIAGRAM Solution Park to draw quick, easy and effective your own Ishikawa diagrams for problem solving.
All source documents are vector graphic documents. They are available for reviewing, modifying, or converting to a variety of formats (PDF file, MS PowerPoint, MS Visio, and many other graphic formats) from the ConceptDraw STORE. The Fishbone Diagrams Solution is available for all ConceptDraw DIAGRAM or later users.
TEN RELATED HOW TO's:
ConceptDraw DIAGRAM is a powerful diagramming and vector drawing software. Extended with Windows 8 User Interface solution from the Software Development area, ConceptDraw DIAGRAM became the ideal software for prototype and design professional looking user interfaces for Windows 8 and Windows 8.1. Windows 8 User Interface solution offers you wide variety of user interface design examples, templates and samples.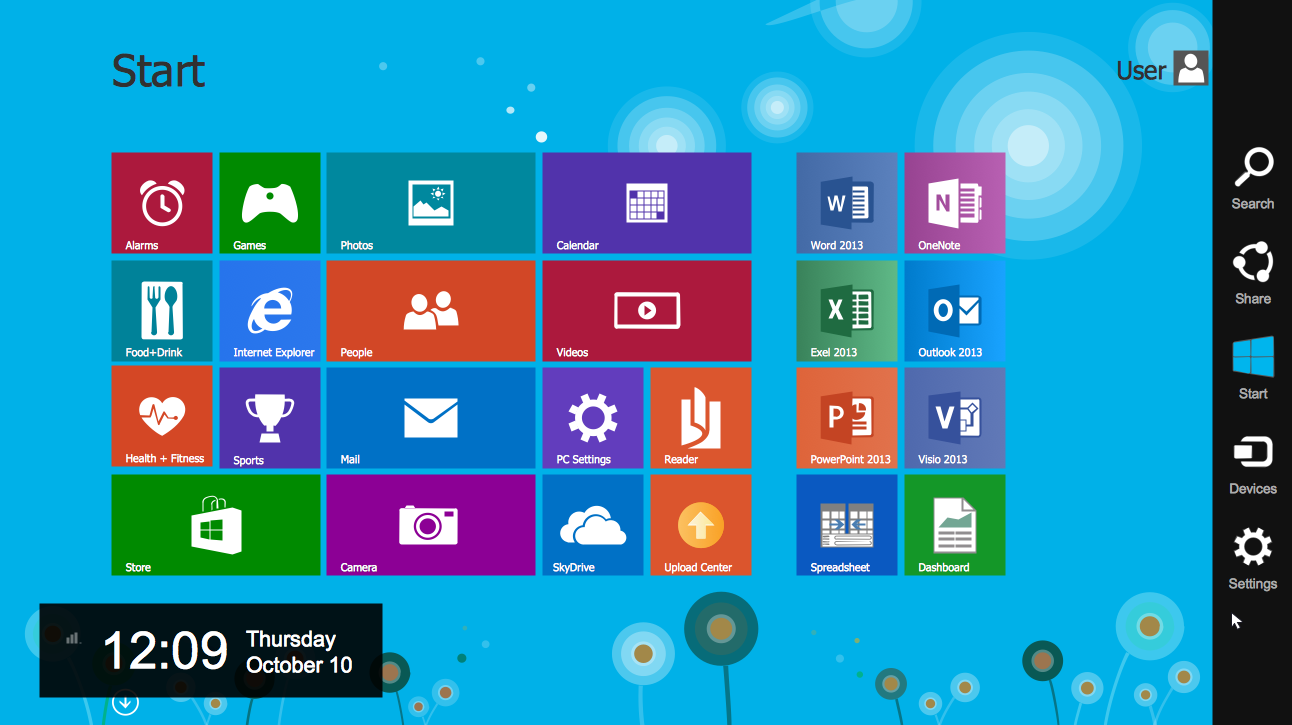
Picture: User Interface Design Examples
Related Solution:
Using diagrams, you can visualize the flow of the information or build a detailed data structure. There's no need to have a degree in software and database design with ConceptDraw DIAGRAM , because this software has all the tools needed in developing models and diagrams. Project planning, designing and prototyping was never so easy.
This UML diagrams can be used to visualize a model of the data base development process. A UML diagram shows a graphical view of a structure of software system: components and relationships.
Using Unified Modeling Language helps to depict logical and physical elements of a data base, visually represent requirements and sub-systems. UML diagrams allows developers to organize and predict critical issues, as well as collaborate data base information.
Picture: Software and Database Design with ConceptDraw DIAGRAM
Related Solution:
This sample shows the UML Class Diagram that was created in ConceptDraw DIAGRAM on the Mac and then was opened for editing in MS Visio.
Using the 13 libraries of the Rapid UML Solution for ConceptDraw DIAGRAM you can create your own visual vector UML diagrams quick and easy.
Picture: UML Diagram Visio
Related Solution:
ConceptDraw DIAGRAM is the best diagramming and vector drawing software. Now, enhanced with Mechanical Engineering solution from the Engineering area of ConceptDraw Solution Park it became ideal for creating: Technical Mechanical Drawings, Mechanical Engineering Diagrams, Pneumatic Schematics, Hydraulic Schemes, etc.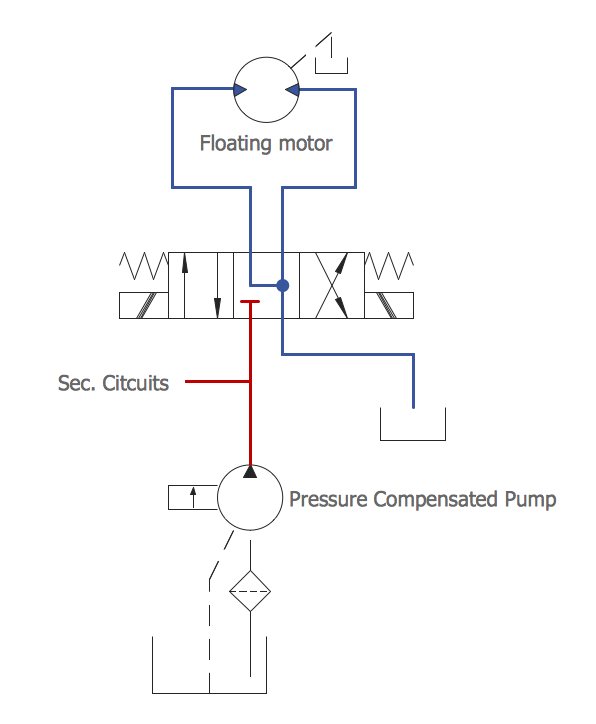
Picture: Mechanical Engineering
Related Solution:
This sample was created in ConceptDraw DIAGRAM software using the Flowcharts solution.
Picture:
Copying Service Process Flowchart.
Flowchart Examples
Related Solution:
Total Quality Management (TQM) system is the management method where the confidence in quality of all organization processes is placed foremost. The given method is widely used in production, in educational system, in government organizations and so on.
Picture: Total Quality Management with ConceptDraw
Audit procedures are the specific tests and methods that auditor executes when gathering the evidence which are necessary for making an opinion on the financial statements of the firm. There are three types of audit procedures: data selection, reliability validation, relevance confirmation.
Thanks to the extensive drawing tools which provides the Audit Flowcharts solution from the Finance and Accounting area of ConceptDraw Solution Park, you can easy and effectively develop and realize various audit procedures.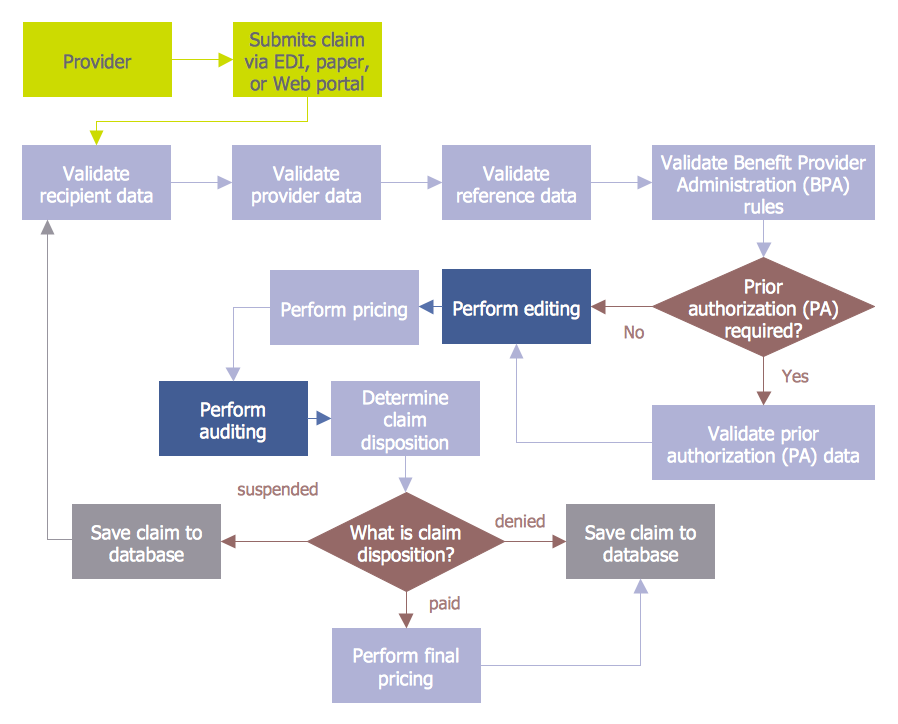
Picture: Audit Procedures
Related Solution:
An inductor, also called a coil or reactor, is a passive two-terminal electrical component which resists changes in electric current passing through it. It consists of a conductor such as a wire, usually wound into a coil. Energy is stored in a magnetic field in the coil as long as current flows. When the current flowing through an inductor changes, the time-varying magnetic field induces a voltage in the conductor, according to Faraday’s law of electromagnetic induction.
26 libraries of the Electrical Engineering Solution of ConceptDraw DIAGRAM make your electrical diagramming simple, efficient, and effective. You can simply and quickly drop the ready-to-use objects from libraries into your document to create the electrical diagram.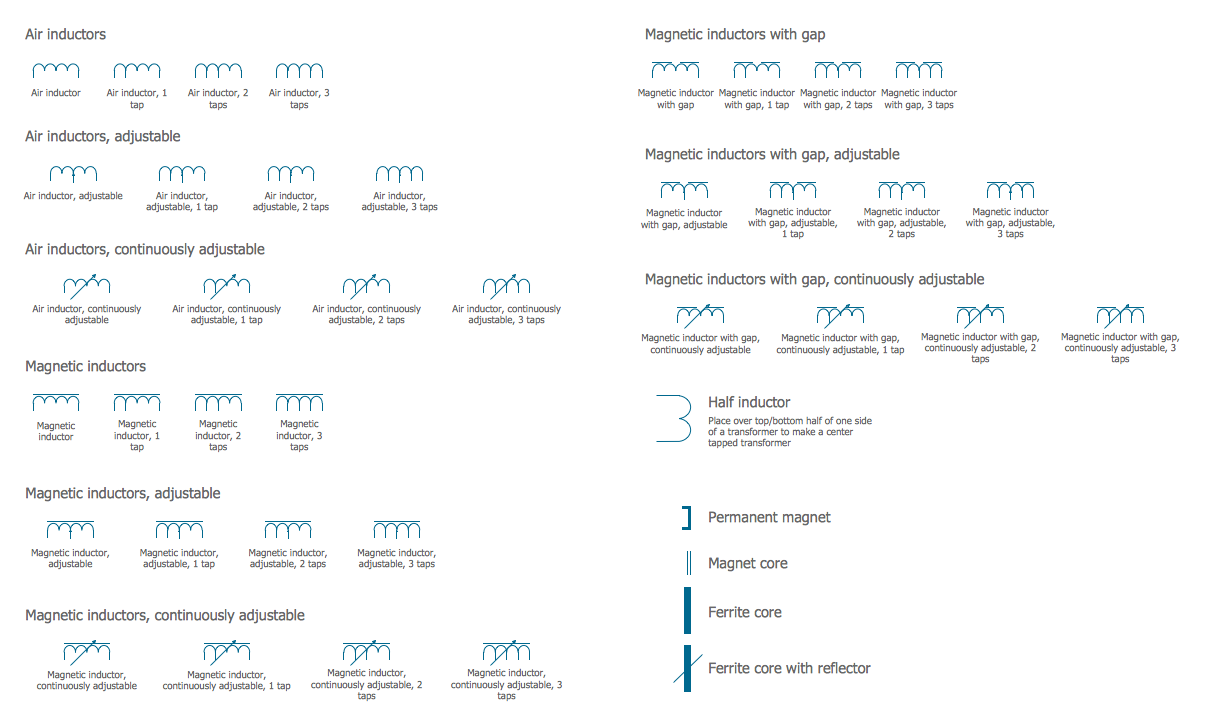
Picture: Electrical Symbols — Inductors
Related Solution:
ConceptDraw DIAGRAM software offers the Electric and Telecom Plans Solution which provides the extensive tools for drawing attractive Electric Visual plans.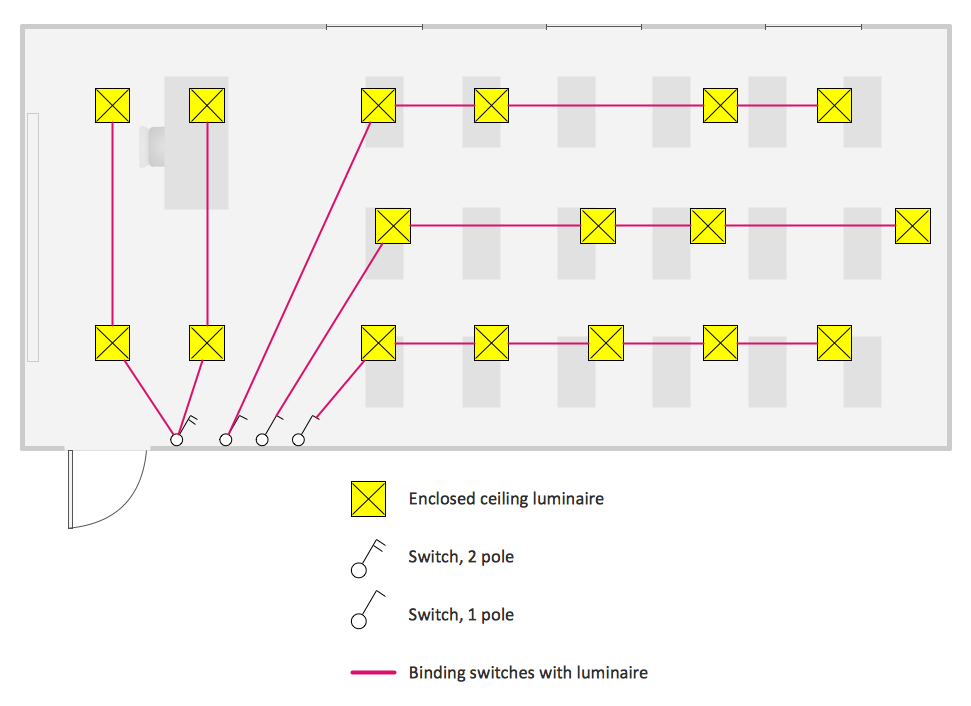
Picture: Electric Visual
Related Solution:
This diagram represents the electrical floor plan. This is a common practice - to draw the electrical plan on the floor plan. The outlets, fixtures and other electrical equipment are depicted on the floor plan with special symbols. This drawing was created using the possibilities of ConceptDraw DIAGRAM as CAD software. Computer-aided design software is intended to replaces manual engineering drafting with an automated process. CAD software is used by engineers, architects, and others to make high-precision technical drawings and illustrations. CAD software allows technical specialists to develop, examine and manage various engineering projects.
It is almost impossible nowadays to imagine mechanical engineering without digital technologies. Finding a suitable CAD software for creating mechanic diagram and electrical diagram architectural designs can take a lot of time and effort. However, with ConceptDraw DIAGRAM you can create any diagram that you want and later convert it to the most popular graphic formats like.vsdx,.png,.pptx etc.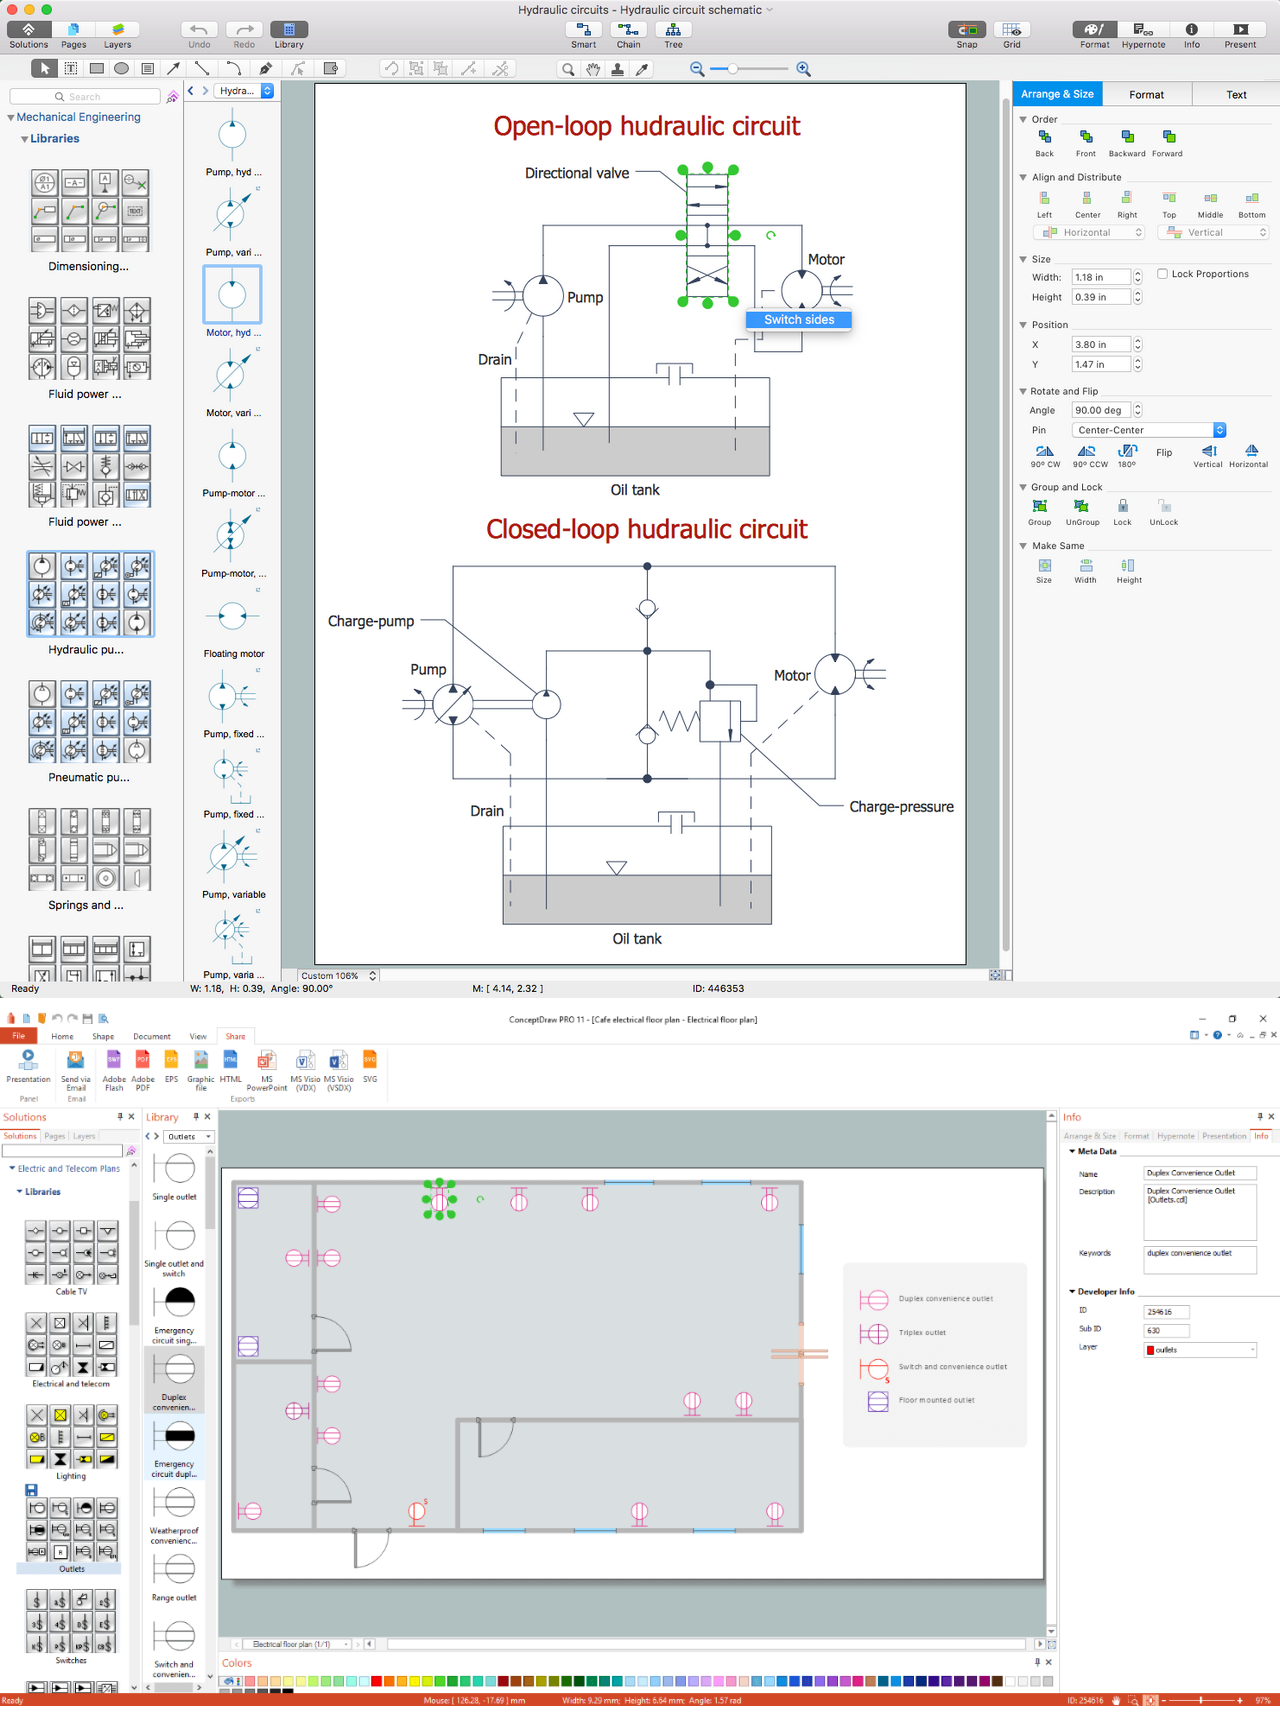
Picture: CAD Drawing Software for Making Mechanic Diagram and Electrical Diagram Architectural Designs
Related Solution:

