Fishbone Diagram
Project ManagementIn PM solutions we support many project methodologies such as Agile and Simple Projects. Methodology solutions help in implementing best practices in project management. CS Odessa provides Toolbox solutions to support solving issues related to planning, tracking, milestones, events, resource usage, and other typical project management functions. Toolbox Solutions help you deal with common project situations in an extraordinary way. PM ResponseBenefits This solution helps improve response time to project changes. PM Response also helps with iteration planning, discussing project layout approaches, and solving project challenges. ObjectivePlan how to respond to issues and events that impact the project. Solution PurposeUse project maps to plan, convert project mind maps to project implementations, represent the project as a project map, use visual diagrams to solve problems and make decisions, and plan resource usage to respond to changes in the project environment. Intended ForManagers, team leaders, and participants. Products and MethodsIn the background of the solution, you use mind mapping for iteration planning and applying project changes, representing project data as a project mind map for clearer understanding, discussing detail breakdown, creative collaboration, and decision-making. Fishbone Diagram
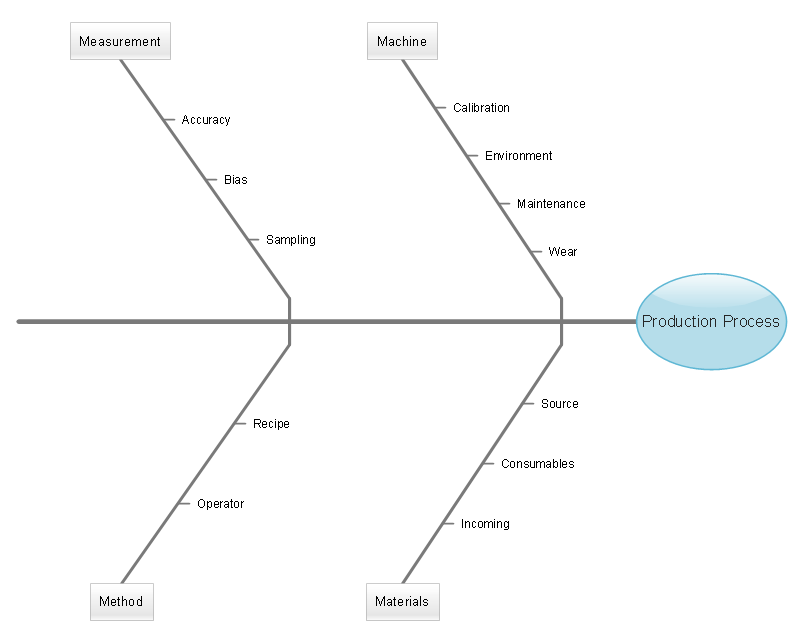
Identify the root causes of quality issues with Fishbone diagram. Because Fishbone diagram is hierarchical it is well-suited for capturing in a mind map for reviewing process towards proving which branch is the real root cause of an issue. |

Example 1. Fishbone Diagram
The Benefits for ConceptDraw MINDMAP Brainstorming Software
- ConceptDraw MINDMAP is effective for brainstorming, designing mind maps, idea generating, creative and lateral thinking, creativity and problem solving.
- ConceptDraw MINDMAP is ideal for team and personal work in Business, Marketing and Project Management.
- The libraries with large quantity of vector objects help to illustrate your mind maps and to make them bright, visual and comprehensible.
- Use of View Navigator tool lets create presentations from a mind map: you can simply select the map parts you want to present, sequence your slides, and preview the presentation.
- ConceptDraw MINDMAP provides wide capabilities of importing and exporting in various formats: Microsoft PowerPoint, Microsoft Word, MS Excel, Mindjet MindManager, image, HTML, PDF file.
EIGHT RELATED HOW TO's:
How to create a UML Diagram →
ConceptDraw DIAGRAM extended with the Rapid UML solution is perfect for drawing professional UML diagrams.
Cause and Effect Diagram →
ConceptDraw DIAGRAM software extended with Fishbone Diagrams solution from the Management area of ConceptDraw Solution Park is perfect for Cause and Effect Diagram creating. It gives the ability to draw fishbone diagram that identifies many possible causes for an effect or a problem. Causes and Effects are usually grouped into major categories to identify these sources of variation. Causes and Effects in the diagram show relationships among various factor. Fishbone diagram shows factors of Equipment, Process, People, Materials, Environment and Management, all affecting the overall problem.
Entity Relationship Diagram Software Engineering →
While designing a conceptual data model, you should use appropriate software. For instance, ConceptDraw DIAGRAM is a user-friendly ER diagram tool that has a lot of samples and templates to facilitate your work. A clear entity-relationship diagram helps to define the relations between system’s components. Software engineering is the section of a computer science engaged to design, realization, and support of complex software products. An ERD is a data modeling method that is widely applied in the software engineering practice. Commonly it is used for developing a structure of a a relational database. An entity relationship diagram is helpful for structuring and organizing databases that can be modeled using a relational structure. An entity relationship diagram is designed to depicts the interrelationships within the sets of entities which are accumulated in the database. Each entity represents a particular component of a data. Thus, ER diagrams depicts the logical structure of databases. ConceptDraw ER Diagrams solution provides software engineers with the professional tool for making entity-relationship diagrams.
Local area network (LAN). Computer and Network Examples →
Computer networks nowadays are spread all across the world. The large number of parameters, such as geographic scale or communication protocols, can divide networks. One of the most common types of networks is called local area network (LAN). It convenient to represent network examples by means of diagrams. This local area network (LAN) diagram provides an easy way to see the way the devices in a local network are interacted. The diagram uses a library containing specific symbols to represent network equipment , media and the end-user devices such as computers (PC, mac, laptop) , network printer, hubs, server and finally a modem. There are two types of network topologies: physical and logical. The current diagram represents precisely a physical type of LAN topology because it refers to the physical layout of a local network equipment.
Fishbone Diagram Problem Solving →
The Ishikawa diagram, Cause and Effect diagram, Fishbone diagram — all they are the names of one and the same visual method for working with causal connections. Originally invented by Kaoru Ishikawa to control the process quality, the Ishikawa diagram is well proven in other fields of management and personal scheduling, events planning, time management. It is a chart in the form of a fish, whose head is a problem, the fins are variants for its causes. To design easily the Fishbone diagram, you can use a special ConceptDraw DIAGRAM vector graphic and diagramming software which contains the powerful tools for Fishbone diagram problem solving offered by Fishbone Diagrams solution for the Management area of ConceptDraw Solution Park.