.png)
Example 1. Fishbone Diagram Design Element
Turn attention for the variety of vector elements predesigned and offered by Fishbone Diagrams library. The first step that you need to do when designing a Fishbone diagram is to draw the fish's backbone with a head. In ConceptDraw DIAGRAM simply drag ready backbone object from the library, if needed you can change the lenght of backbone line dragging the green handles on it. Then attach the categories elements to the backbone using connection dots, add the causes elements and type the text. Finally you can add the fish frame fishbone diagram design element and recolor your diagram.
Often for defining causes are used brainstorming sessions. The ConceptDraw Office innovative toolset is also helpful at this question, it offers the specialized ConceptDraw MindMap application for easy brainstorming. Having resulting Mind Map you can then easy output it as ready Fishbone diagram in ConceptDraw DIAGRAM for further work with it.

Example 2. Fishbone Diagram - Factors Reducing Competitiveness
You can also use ready samples or templates offered by Fishbone Diagrams solution in ConceptDraw STORE as the base or as the source of inspiration for your own diagrams.

Example 3. Easy Design in ConceptDraw DIAGRAM - Fishbone Diagram
The samples and templates you see on this page were created in ConceptDraw DIAGRAM using the Fishbone diagram design elements from the Fishbone Diagrams library. They successfully demonstrate solution's capabilities and professional results you can achieve using it. An experienced user spent 10 minutes creating each of these samples.
Use the Fishbone Diagrams Solution for ConceptDraw DIAGRAM Solution Park for easy and effective cause and effect analysis.
All source documents are vector graphic documents. They are available for reviewing, modifying, or converting to a variety of formats (PDF file, MS PowerPoint, MS Visio, and many other graphic formats) from the ConceptDraw STORE. The Fishbone Diagrams Solution is available for all ConceptDraw DIAGRAM or later users.
TEN RELATED HOW TO's:
This mind map shows 8 steps approach to solving any kind of product or service problems.
Picture: 8 Step Problem Solving
Related Solution:
ConceptDraw DIAGRAM is the best network diagram software. To design the Cisco Network Diagrams and visualize the computer networks topology use ConceptDraw DIAGRAM diagramming and vector drawing software extended with Cisco Network Diagrams solution for ConceptDraw DIAGRAM Solution Park.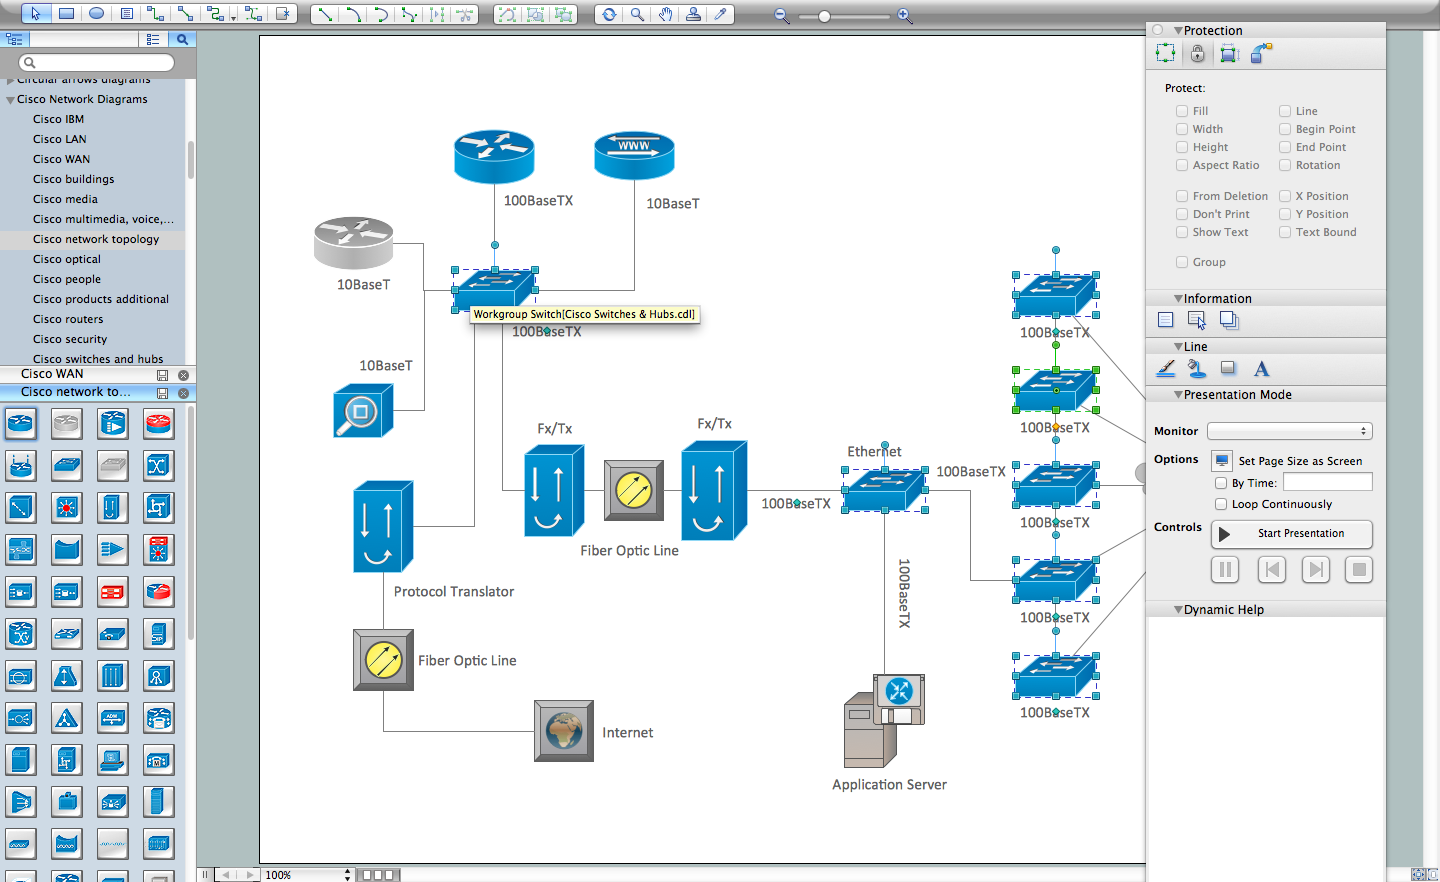
Picture: Cisco Network Diagram Software
Related Solution:
Samples, templates and libraries contain vector clip art for drawing the Aerospace Illustrations.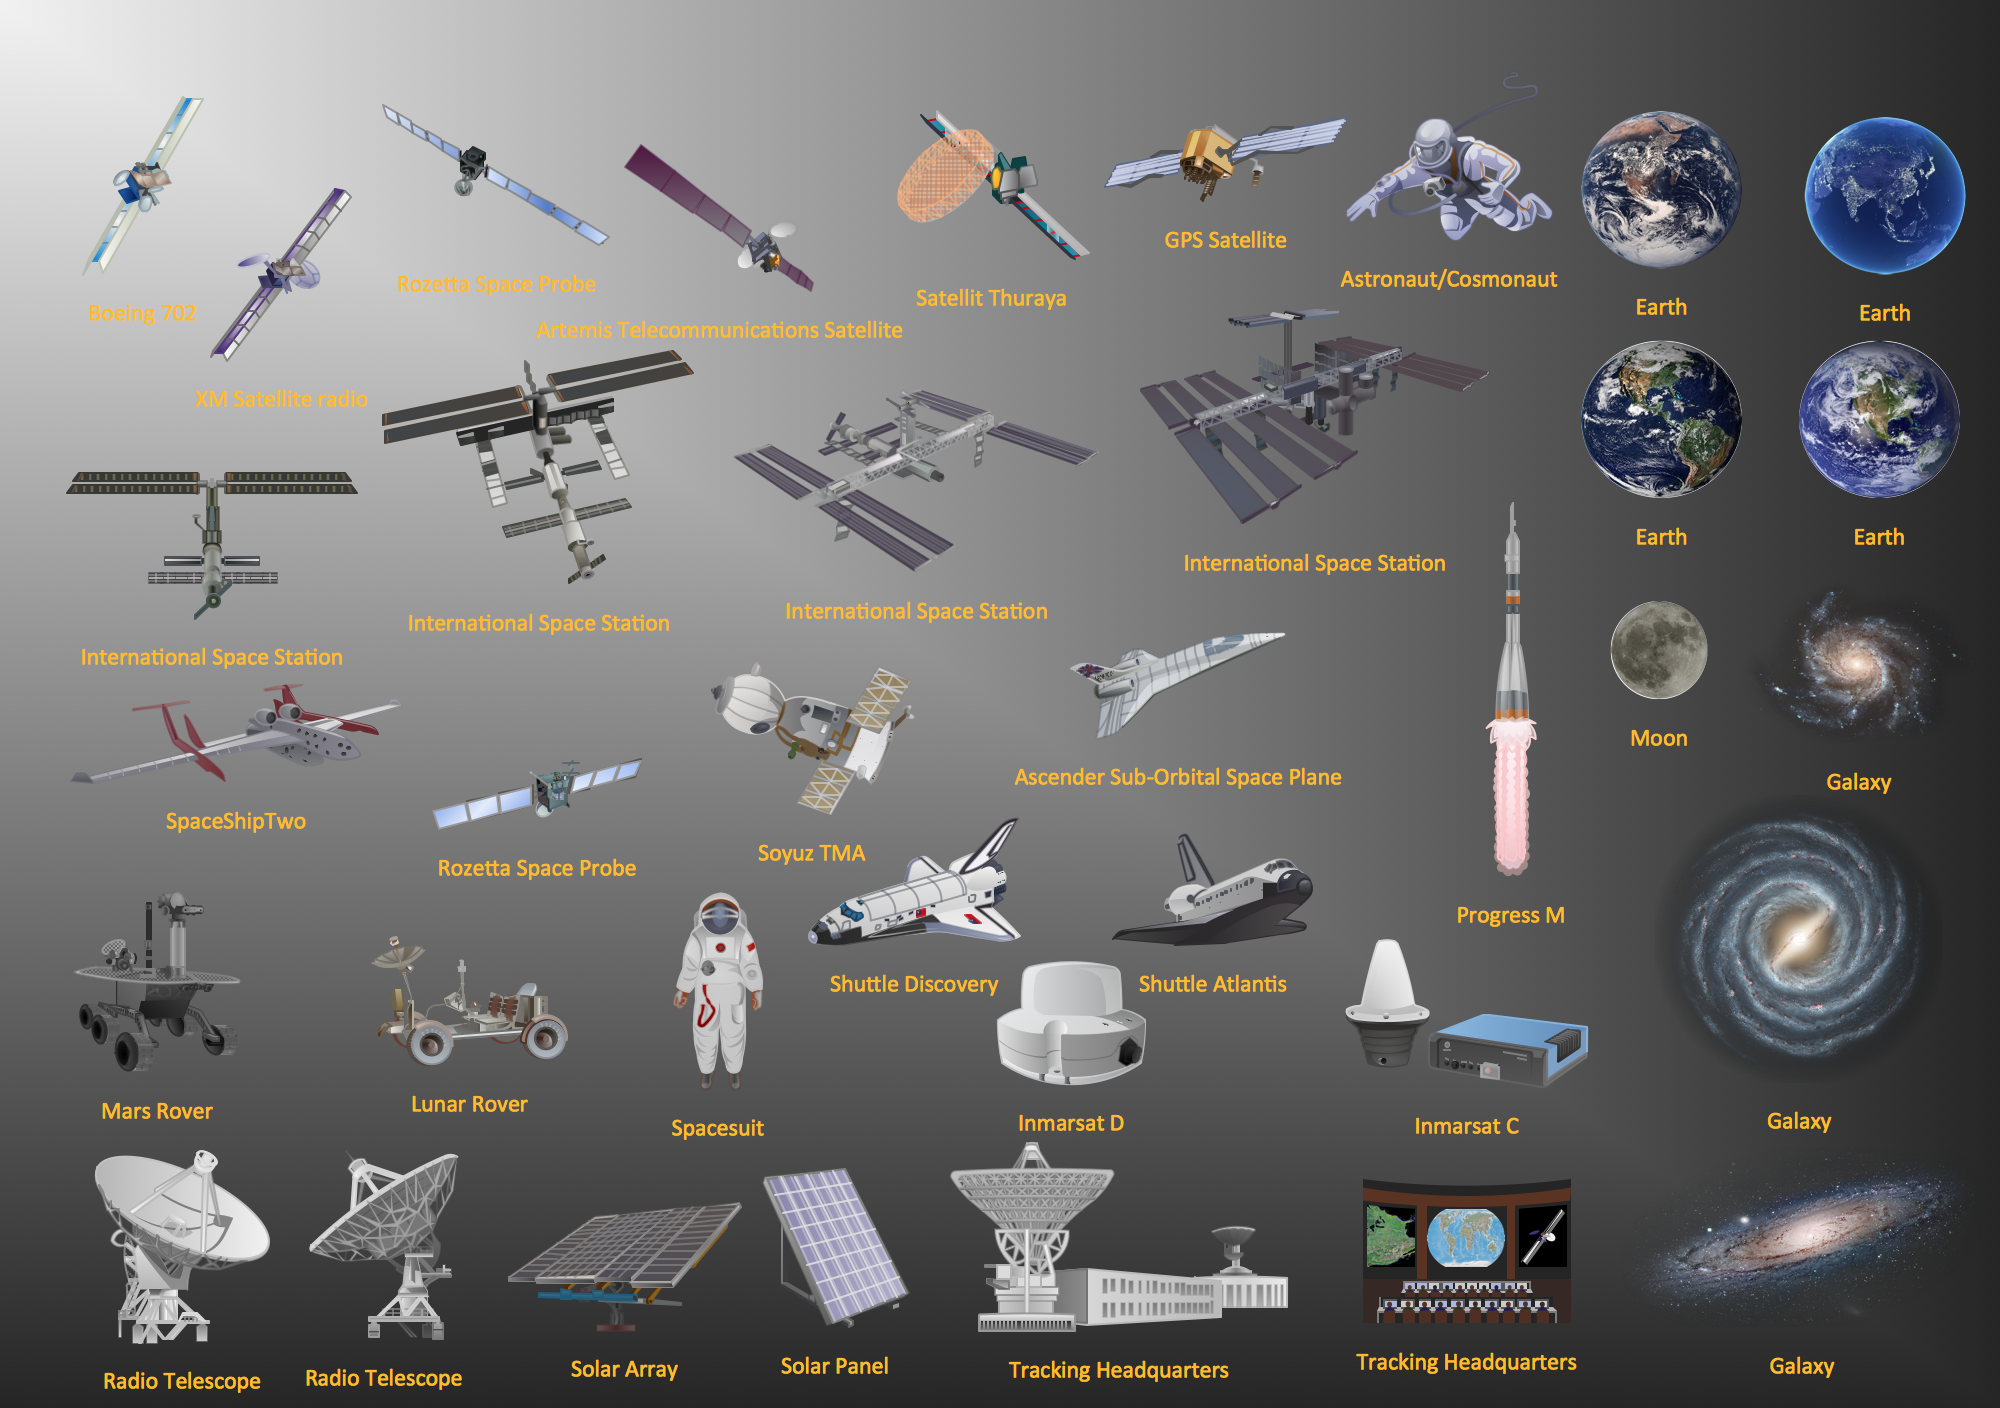
Picture: Aerospace - Design Elements
Related Solution:
Nature solution expands our software possibilities to create beautiful illustrations and cliparts with the new library which contains 17 vector objects.
Picture: Beauty in nature Illustrations and Clipart
Use of various charts, diagrams and infographics is the most effective way of visual presenting information about healthy foods, healthy eating and healthy diet. ConceptDraw DIAGRAM diagramming and vector drawing software offers the Health Food solution from the Food and Beverage area of ConceptDraw Solution Park which is overfull of powerful drawing tools, libraries with ready-to-use vector objects and clipart, predesigned samples and examples which will help you easy design healthy foods illustrations.
Picture: Healthy Foods
Related Solution:
Imagine the diagram which is looking smart. That is how ConceptDraw Arrows10 Technology or Smart connectors work.
Thanks to auto-routing feature connectors flow around objects. But if you want some background objects that the connectors flow through - that is also possible to do.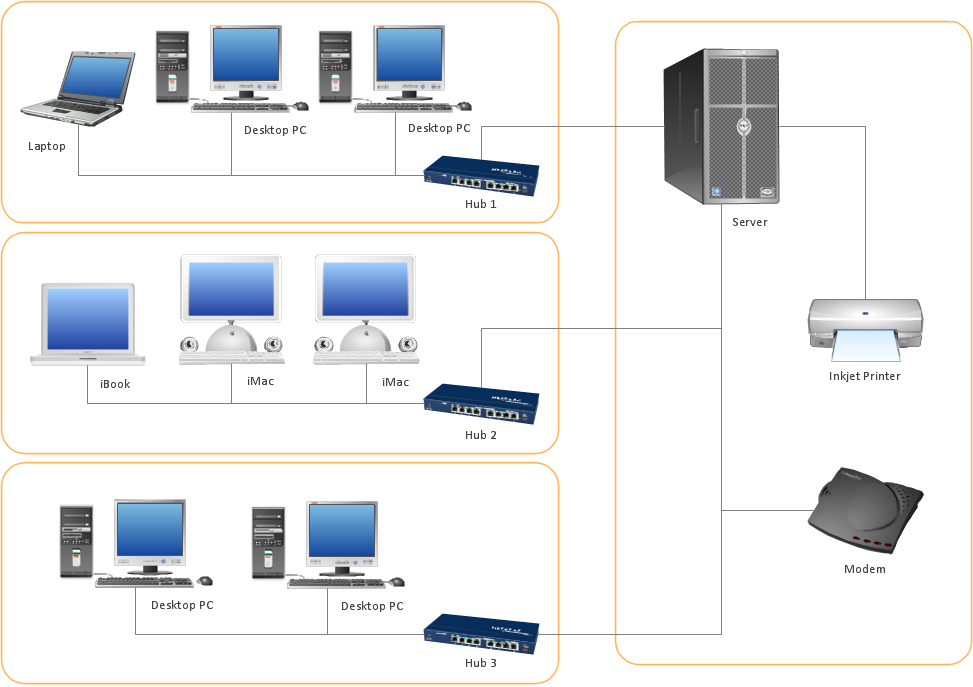
Picture: ConceptDraw Arrows10 Technology
Few other areas benefited as much from the development of advanced digital drawing software as interior design. Previously only done by professionals, nowadays it is made available to virtually anyone with the help of software such as ConceptDraw DIAGRAM. You can design whatever you want - a living room, an office, a garage, a school layout - design elements provided by ConceptDraw DIAGRAM fit all of these purposes. All you need to get started is your creativity and the right software tools.
This library of vector graphic objects includes images of different school furniture and equipment related to school or training classes interior. These graphical elements are embedded into the ConceptDraw School and Training Plans solution. You can use them when designing interior layout of classroom or training office.Organization of the learning environment is an important element of a students learning. By using ConceptDraw DIAGRAM you can easily visualize and present your ideas related to any classes layout.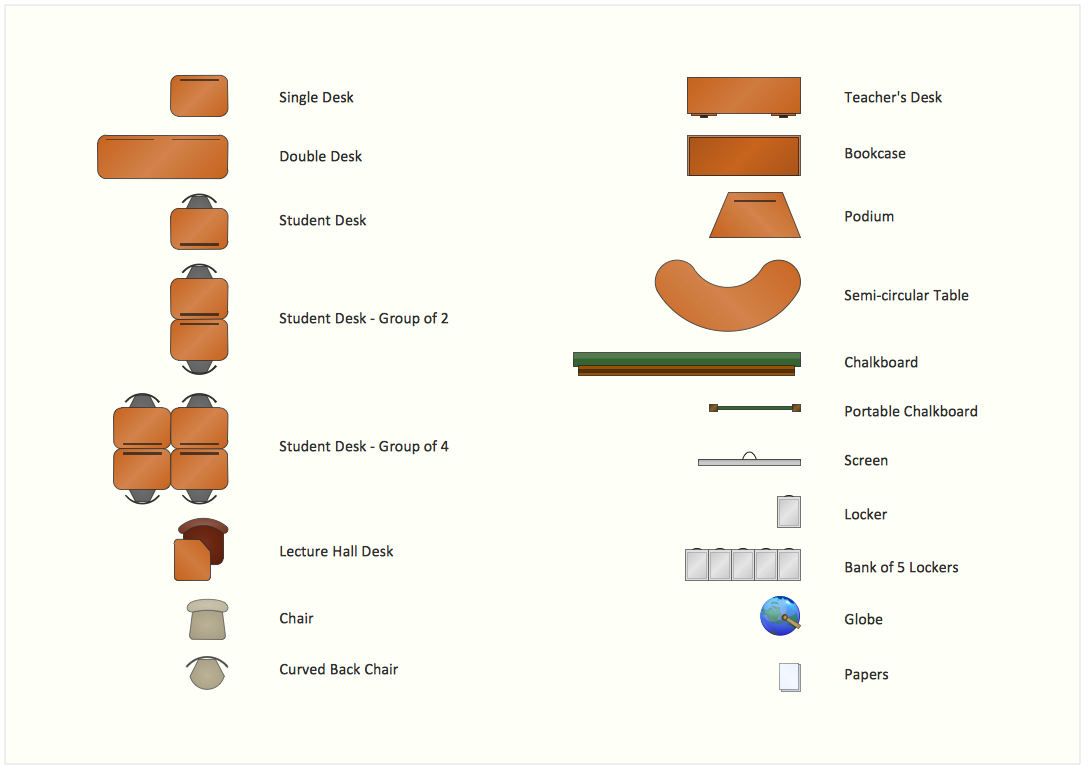
Picture: Interior Design. School Layout — Design Elements
Related Solution:
ConceptDraw DIAGRAM diagramming and vector drawing software extended with Wireless Networks Solution gives the ability to its users to create professional looking WLAN schemes and diagrams quick and easy.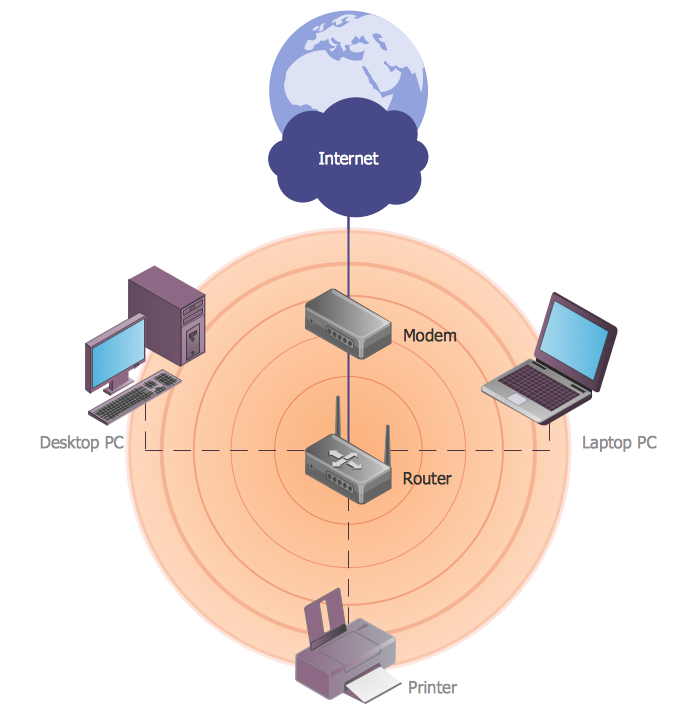
Picture: WLAN
Related Solution:
Activity Network and Project Evaluation and Review Technique, or PERT, charts are a way of documenting and analyzing the tasks in a project.
This diagram is constructed as part of the process in creating a schedule of corrective actions. The Activity Network Chart (PERT) shows the logical connections and consequence of tasks to be performed. It displays the time period for problem solving and the implementation of all activities through the critical path.
Picture: Activity Network (PERT) Chart
Related Solution:
Fishbone Diagram, also referred as Cause and Effect diagram or Ishikawa diagram, is a fault finding and problem solving tool. Construction of Ishikawa diagrams is quite complicated process and has a number of features.
Fishbone Diagrams solution included to ConceptDraw Solution Park contains powerful drawing tools and a lot of examples, samples and templates. Each Fishbone diagram example is carefully thought-out by experts and is perfect source of inspiration for you.
Picture: Fishbone Diagram Example
Related Solution:

