System Design
ConceptDraw DIAGRAM system design software is a product of CS Odessa that was developed especially for making it much simpler to create all the needed diagrams, charts, flowcharts, schemes and other drawings when there is such a need in it. Having the Specification and Description Language (SDL) solution installed from the ConceptDraw STORE application may be another bonus to any ConceptDraw DIAGRAM diagramming and drawing software’s user as it offers both stencil libraries with the design elements and the pre-made examples of the diagrams, such as the SDL ones.

Example 1. Specification and Description Language (SDL) solution
Systems design is known to be the process of defining the modules, the interfaces, the data and the architecture for the systems in order to satisfy some specified requirements. Systems design can be treated as the application of systems theory to product development and there is some overlap with the disciplines of systems architecture, systems engineering and systems analysis.
The Design is known to be the act of taking the marketing information and creating the design of the product that is intended to be manufactured and systems design is the process of both defining and developing the appropriate systems in order to satisfy some specified requirements of the user.
Systems design had a crucial as well as a well-respected role in the data processing industry until the 1990s, but in the 1990s the standardization of both software and hardware resulted in the ability to build the modular systems. After, the importance of the software that is running on the generic platforms has slowly enhanced the discipline of software engineering and its popularity got increased.
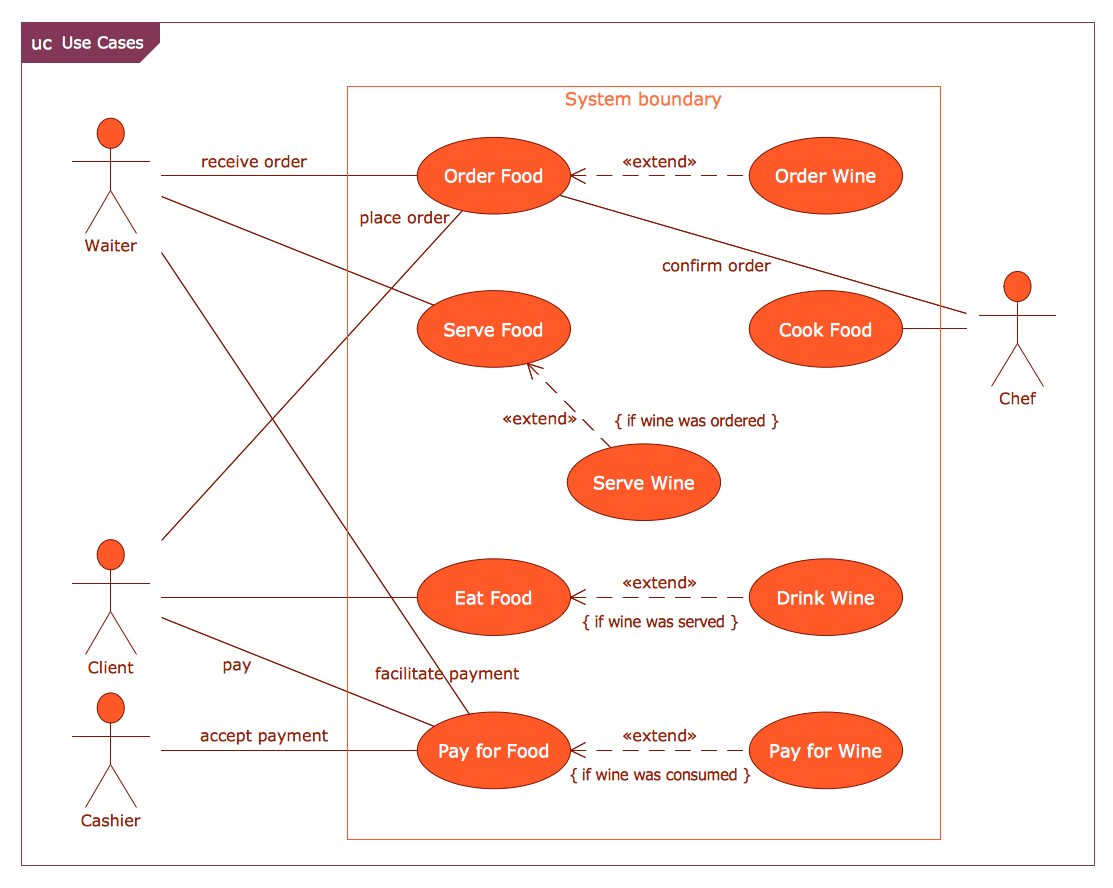
Object-oriented design and analysis methods are becoming more and more popular, being most widely used methods for computer systems design nowadays already. The UML can be now described as the standard language that is used in the object-oriented analysis and design, being widely used for modeling software systems. It is increasingly used for high designing non-software systems and organizations and the UML diagrams are such drawings that can be also made in the ConceptDraw DIAGRAM diagramming and drawing software with the help of an appropriate solution.
There are a few types of the design, such as, for example, the architectural one. The architectural design of a system is used for designing the system architecture that describes the behavior, the structure and more views of that system and analysis. Another type, the logical design of a system is known to be pertaining to an abstract representation of the inputs, outputs and data flows of the system. It can be often conducted via using an over-abstract as well as a graphical model of the actual system. This particular type of design is known to be including the entity-relationship diagrams that can be also known as the ER diagrams.
Next, physical design can be related to the actual output and input processes of the system which can be explained in terms of the way some data is input into some system. The way it is authenticated and/or verified can be also defined, same as how it is processed and displayed. In physical design, there are a few requirements about the system that should be decided, such as an input requirement, the output requirements, the storage requirements, the processing requirements, system control and backup/recovery.
User Interface Design is known to be figuring out the way the users add some information to the system as well as the way such system presents this information back to them. Data Design can be concerned with the way such data is stored and represented within the system. Also, Process Design is known to be concerned with the way data moves through some particular system.

Example 2. System Design
It is always important to find out how and where the data is validated, transformed and /or secured while it flows through into and out of some system. At the very end of the system design phase, there should be documentation used for describing the three previously mentioned sub-tasks that were produced making them available for being used in the next phase. To compare to the previously mentioned types, the physical design does not refer to the tangible physical design of any information system.
Creating the DSL diagrams can be done within only a few minutes by using the design elements from the stencil libraries of the Specification and Description Language (SDL) solution. The mentioned solution can be found within the ConceptDraw STORE application which is another product of CS Odessa that can be used by all the ConceptDraw DIAGRAM users for making the professionally looking drawings, such as the DSL diagrams.
The benefits of using both products of CS Odessa — the ConceptDraw DIAGRAM diagramming and drawing software and the ConceptDraw STORE application — are obvious: having the pre-made design elements can be very useful in terms of making the smart as well as good looking diagrams.
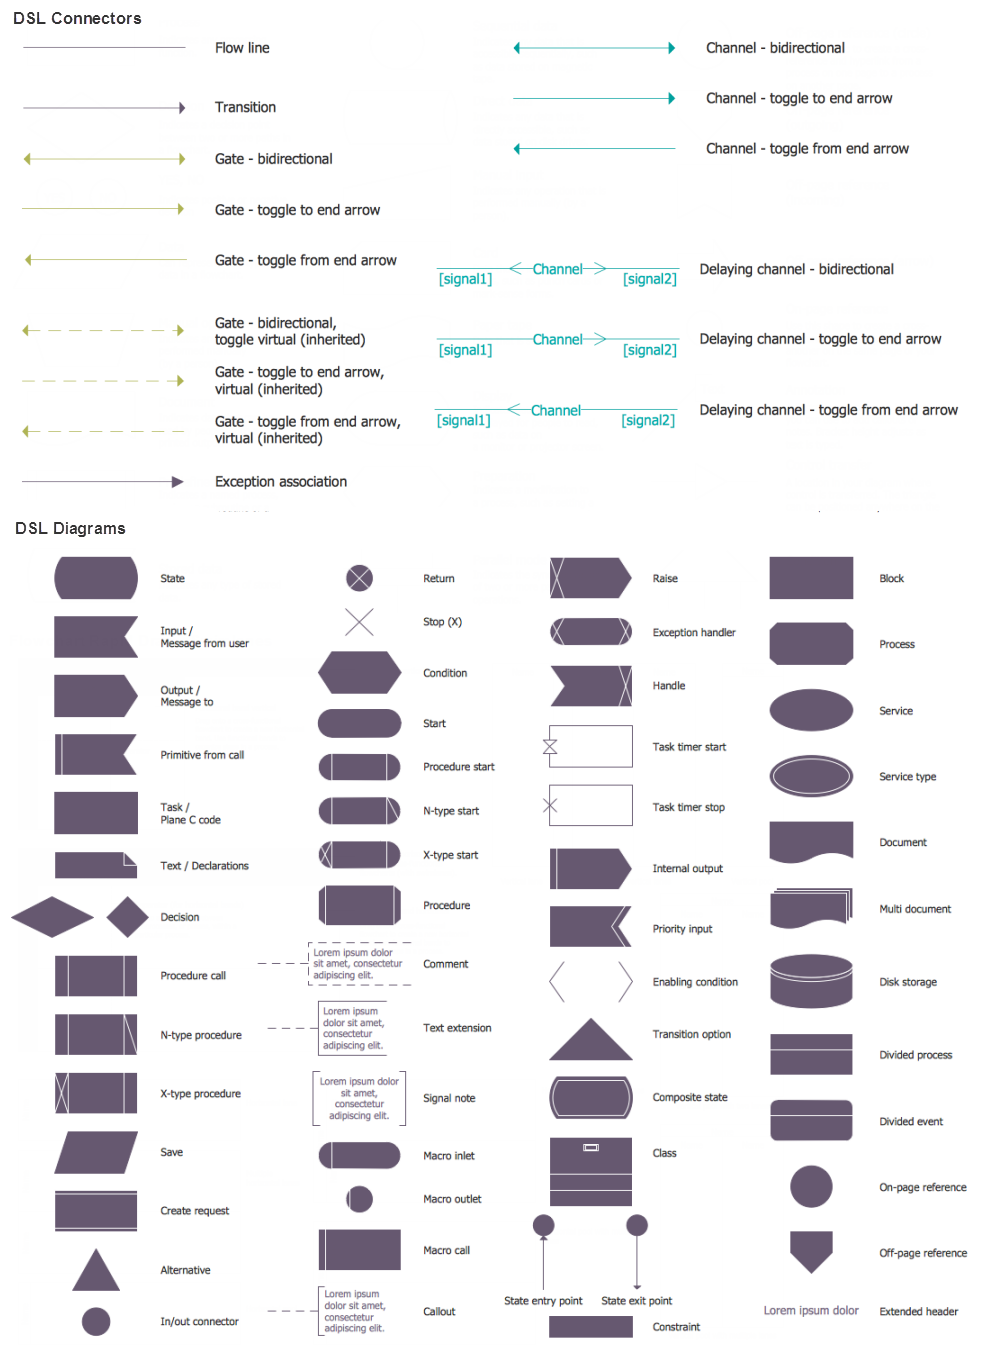
Example 3. System Design. Design Elements — SDL Architecture for Apple OS X and Windows
Thus, there is the “DSL Connectors” stencil library that is full of the design elements, such as “flow line”, “transition”, “gate — bidirectional”, “gate — toggle to end arrow”, “gate — toggle from end arrow”, “gate — bidirectional, toggle virtual (inherited)”, “gate — toggle to end arrow, virtual (inherited)”, “gate — toggle from end arrow, virtual (inherited)”, “exception association”, etc.
Next library is called as the “DSL Diagrams”. It includes such design objects as “state”, “input/message from user”, “output/message to”, “primitive from call”, “task/plane C code”, “text/declarations”, “decision”, “procedure call”, “N-type procedure”, “X-type procedure”, “save”, “create request”, “alternative”, “in/out connector”, “return”, “stop (X)”, “condition”, “start”, “procedure start”, “N-type start”, “X-type start”, “procedure”, “comment”, “text extension”, “signal note”, “macro inlet”, “macro outlet”, “macro call”, etc.