What is a Systems Engineering?Examples of Systems Engineering Diagrams
Being involved in such business activity as systems engineering, you may find the SysML Solution for ConceptDraw DIAGRAM truly useful as it provides all the necessary systems engineering software tools for making your great-looking drawings related to systems engineering within only a very short period of time.
Systems engineering itself is a well-known interdisciplinary field of engineering as well as engineering management, focused on finding ways to design and manage some complex systems all over their so-called “life cycles”. As its main aim, any systems engineering activity is known to be utilizing the systems thinking principles in order to organize it.
Such issues as reliability, logistics, requirements engineering, coordination of different teams, evaluation and testing, maintainability as well as many other disciplines, which are simply necessary for successful engineering system design, its development and implementation become more difficult in case you have to deal with some complex or large projects.
Development of complex systems requires a complex approach and coordination between different development directions, task areas, and subject matter experts. These are the systems comprising multiple interrelated subsystems and interdependent parts or components, such as machines, materials, procedures, and people. And changing just one part of the system affects its other parts. Therefore, it is valuable to track any changes, anticipate them, and develop methods to eliminate or accommodate them.
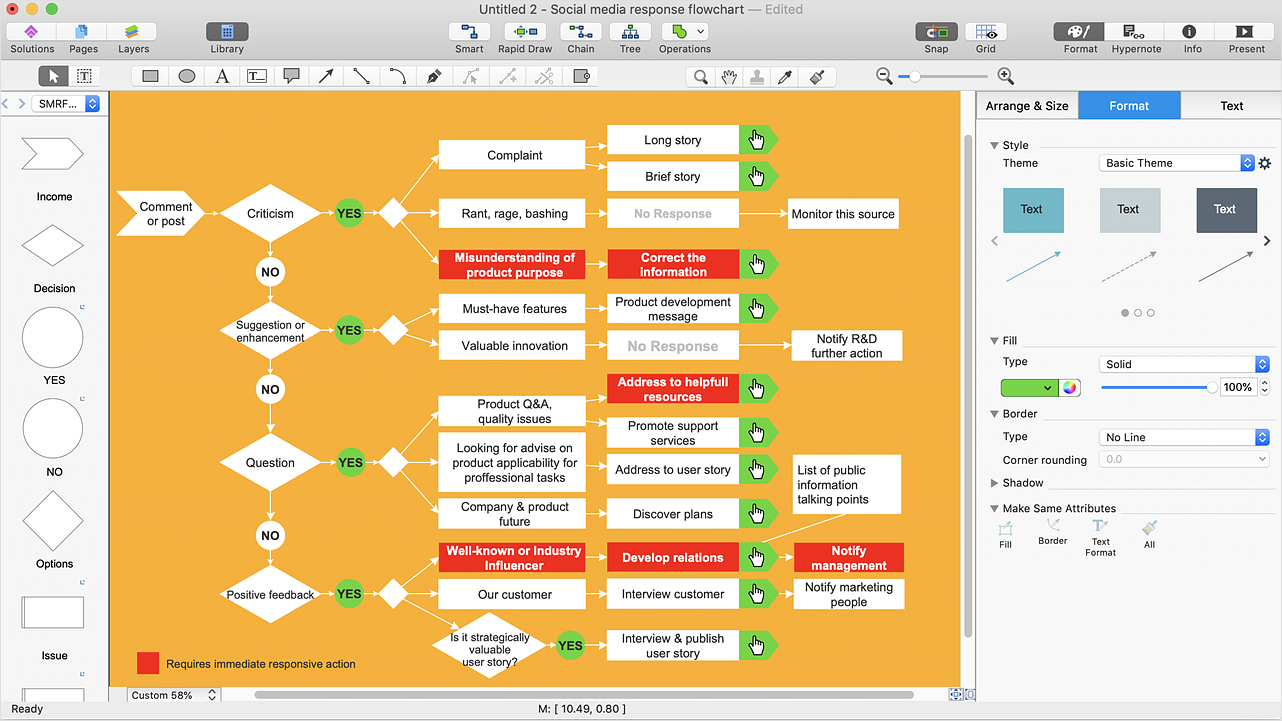
Example 1. Systems Engineering in ConceptDraw DIAGRAM
What is a Systems Engineering?
Systems engineering is a holistic approach focused on the design, development, integration, and management of complex systems over their life cycles. It combines the approaches and methods of engineering and engineering management, engineering concepts, systems thinking principles, research opportunities, mathematical methods and techniques allowing you to improve planning, decision-making, and problem-solving in complex organizational systems. Sometimes it intersects also with some other disciplines, such as software engineering, electrical engineering, industrial engineering, control engineering, process systems engineering, project management, and so on.
The Role of Systems Engineering in Complex Projects
Systems engineering has an invaluable value for complex projects in various industries including large industries like defense and aerospace. It overlaps manufacturing, project management, safety engineering, system diagram software engineering, mechanical engineering, electrical engineering, control engineering, etc. This is because systems engineering ensures accounting for different aspects of a system, covers all work processes, and integrates them into a unified whole.
Systems engineering provides different methods and techniques of optimization and risk management, identification of problems and probable failures at any level to prevent or cope with them. The development of graphic representations in the form of systems engineering diagrams helps to comprehend better complex systems and their current or probable problems.
Types of Systems Engineering
One differs various types of systems engineering and engineering system design, such as industrial and manufacturing systems engineering, software systems engineering, applied systems engineering, operations research and systems analysis, and so on. The basic implementations of systems engineering include discovery, program systems engineering, and approach. In addition, one differs the following types: classical systems engineering, agile systems engineering, model-based systems engineering (MBSE), and systems of systems engineering (SoSE).
Classical
Classical systems engineering provides the base for the development of complex products and uses the top-down or “waterfall” approach. The requirements analysis, functional analysis, and synthesis are conducted in order of priority as an iterative process. Classical systems engineering is based on the formal documents and specifications developed by engineers and then implemented by developers. However, in modern conditions of rapid technological advancements, actively developed markets, and increasing complexity of systems, classical systems engineering is usually improved with new flexible, cost-efficient, speed, and mass-customization methods, modern and future-proof developments and techniques.
Agile
Agile systems engineering is an approach for developing and managing complex systems using principles of both structured systems engineering and iterative and incremental agile software development. The focus is on the overall system architecture and engineering principles. According to the principles of agile systems engineering, security, reliability, and performance have a special value. Changes are integral aspects of system development and should be continuously introduced from the early stages.
Agile systems engineering supposes the use of modern technologies and market opportunities, beliefs and actions from agile values, simplified and flexible processes and tools, which allow teams to respond efficiently to changing requirements and priorities. It includes collaboration with domain experts, customers, and other stakeholders during the entire development process. Another aspect is using cross-functional teams including various experts, such as systems engineers, software developers, quality assurance professionals, and others who can quickly respond to changes and make informed decisions.
Model-Based (MBSE)
Model-based systems engineering (MBSE) is a technical multidisciplinary approach to systems engineering based on intelligent digital system models including all information about the system — requirements, architecture, and interfaces between the system parts. MBSE is used to create digital systems, engineering domain models to exchange information, and complex systems in a wide range of industries. These include defense, aerospace, manufacturing, automotive, rail, etc. It helps to design, develop, employ, and maintain a balanced system, make its overview, analysis, verification, and validation activities at all levels. MBSE simplifies understanding of the entire process, interrelationships, and system requirements, provides control of complexity, sharing system information and parameters, updating changes, earlier and better error detection, and communication between all project participants.
Systems of Systems Engineering (SoSE)
System of Systems Engineering (SoSE) is an innovative and prospective methodology focused on engineering system design, analysis, transformation, and managing complex systems, which integrate multiple independent systems into a cooperative and coordinated entity to achieve an overall objective. SoSE is applied in transportation, communication, healthcare, space exploration, military, defense, and other domains. It includes a set of tools and methods for designing, re-designing, developing architectural solutions for system-of-systems tasks, and deploying them at multiple levels. SoSE focuses on the interactions of systems and their optimization to satisfy the requirements and multiple common objectives, through continuous developing and updating programs.

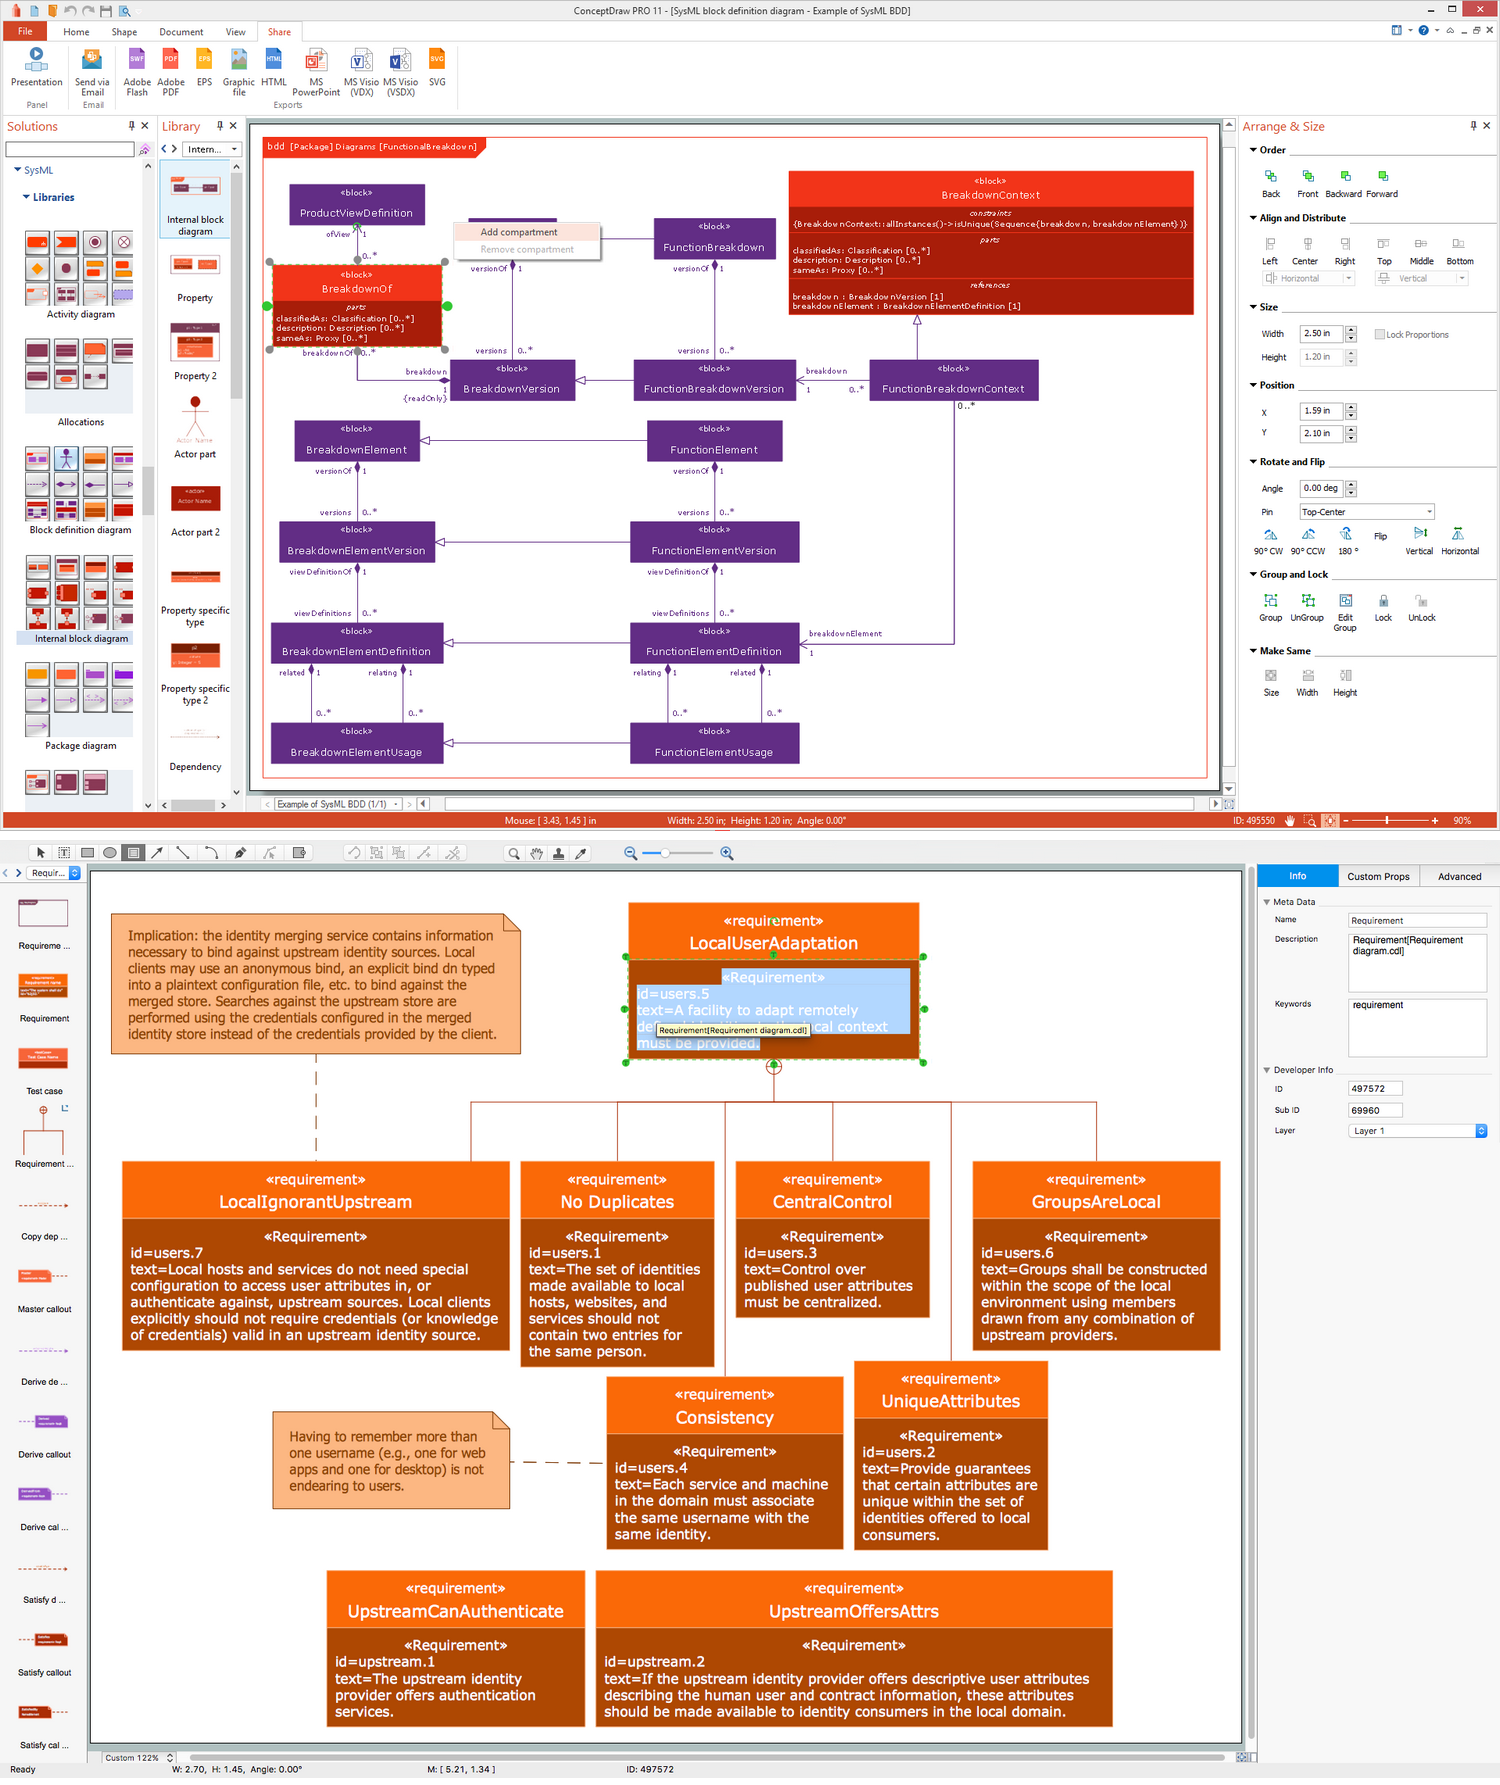
Example 2. SysML Solution in ConceptDraw STORE
How to Draw System Engineering Process Diagrams?
Any graphical representation is known to be related to the numerous parts or subsystems of a system through functions, interfaces, data, etc. Any of the above-mentioned methods and approaches can be used in any needed industry, which is based on its requirements. In case all the requirements are understood, then it becomes obvious that the responsibility of a systems engineer is to simply refine them. Later, he or she has to determine them with all other engineers who are known to be involved in the project in order to solve all the current issues.
Thus, systems engineering may encourage the use of the so-called weighted choices for determining the best of all the existing options. A so-called “decision matrix” can be also known as a “Pugh method”. It is one of all the possible and existing ways of making this choice if you consider all the important criteria. For example, in any SE process, the mentioned stage can represent the iterative step for carrying out until a feasible solution is eventually found. Any decision matrix is known to be populated by using special techniques: statistical analysis, system dynamics, optimization methods, and reliability analysis.
System Engineering Process Diagram helps to model, manage, and analyze systems engineering process, test and evaluate it, establish requirements and design details, specify the series of steps that make up a systems engineering approach, break down the complex system into smaller and show them, as well as system components, entities, interactions, processes, and boundaries between the system or its part and its environment. It helps to trace potential risks and troubleshoot problems.
ConceptDraw SysML Diagram Software Overview
Being involved in any of the described activities you may find ConceptDraw DIAGRAM vector drawing and diagramming software a convenient tool for solving all of your problems with creating the needed drawings, such as those which are known to be systems engineering related. All the mentioned drawings can be always created in this systems engineering software.
Nowadays, ConceptDraw DIAGRAM software is known as one of the best for simplifying work with any drawing, especially with system engineering-related ones in case you have the SysML solution. The solution is downloaded and installed with the help of the ConceptDraw STORE application — also a product of CS Odessa.
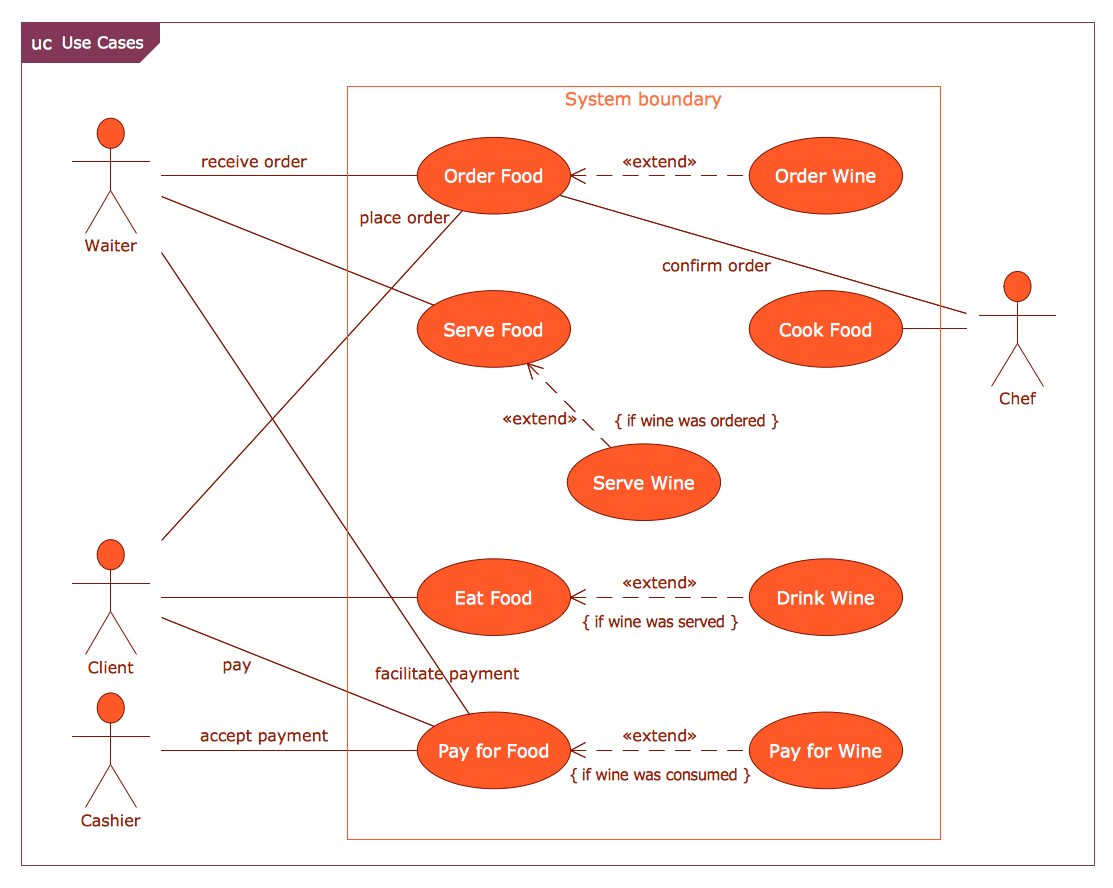
Example 3. Systems Engineering — SysML Use Case Restaurant Model
SysML is steadily gaining popularity and many companies successfully use it in systems engineering. Among the system engineering tools which provides a SysML Solution, a special place occupies a wide collection of libraries — 13 libraries containing 284 vector objects:
SysML Activity Diagram
SysML Allocations
SysML Block Definition Diagram
SysML Internal Block Diagram
SysML Package Diagram
SysML Parametric Diagram
SysML Ports and Flows
SysML Profiles and Model
SysML Requirement Diagram
SysML Sequence Diagram
SysML State Machine Diagram
SysML Diagrams
SysML Use Case Diagram
Examples of Systems Engineering Diagrams
Having such solution, as the SysML solution for ConceptDraw Solution Park, can be very beneficial for you as it allows you to have a collection of pre-made examples and samples as the base for your own great-looking SysML Diagrams, Systems Engineering Diagrams, and System Engineering Process Diagrams. All professionally designed examples for systems engineering software ConceptDraw DIAGRAM you can find in ConceptDraw STORE.